https://doi.org/10.5194/essd-10-805-2018 © Author(s) 2018. This work is distributed under the Creative Commons Attribution 4.0 License.
Historical glacier outlines from digitized topographic
maps of the Swiss Alps
Daphné Freudiger1,2, David Mennekes1, Jan Seibert2, and Markus Weiler1
1Chair of Hydrology, University of Freiburg, 79098, Freiburg, Germany
2Hydrology and Climate Unit, Department of Geography, University of Zurich, 8057, Zurich, Switzerland
Correspondence:Daphné Freudiger (daphne.freudiger@geo.uzh.ch)
Received: 12 July 2017 – Discussion started: 4 August 2017
Revised: 26 February 2018 – Accepted: 23 March 2018 – Published: 20 April 2018
Abstract. Since the end of the Little Ice Age around 1850, the total glacier area of the central European Alps
has considerably decreased. In order to understand the changes in glacier coverage at various scales and to model past and future streamflow accurately, long-term and large-scale datasets of glacier outlines are needed. To fill the gap between the morphologically reconstructed glacier outlines from the moraine extent corresponding to the time period around 1850 and the first complete dataset of glacier areas in the Swiss Alps from aerial photographs in 1973, glacier areas from 80 sheets of a historical topographic map (the Siegfried map) were manually digitized for the publication years 1878–1918 (further called first period, with most sheets being published around 1900) and 1917–1944 (further called second period, with most sheets being published around 1935). The accuracy of the digitized glacier areas was then assessed through a two-step validation process: the data were (1) visually and (2) quantitatively compared to glacier area datasets of the years 1850, 1973, 2003, and 2010, which were derived from different sources, at the large scale, basin scale, and locally. The validation showed that at least 70 % of the digitized glaciers were comparable to the outlines from the other datasets and were therefore plausible. Furthermore, the inaccuracy of the manual digitization was found to be less than 5 %. The presented datasets of glacier outlines for the first and second periods are a valuable source of information for long-term glacier mass balance or hydrological modelling in glacierized basins. The uncertainty of the historical topographic maps should be considered during the interpretation of the results. The datasets can be downloaded from the FreiDok plus data repository (https://freidok.uni-freiburg.de/data/15008, https://doi.org/10.6094/UNIFR/15008).
1 Introduction
The total glacier area of the central European Alps has con-siderably decreased during the last decades with differences of change in certain sub-periods (e.g. Fischer et al., 2014). Long-term glacier datasets are of great importance for under-standing and assessing glacier changes (Fischer et al., 2015; Huss and Fischer, 2016) as well as for hydrological mod-elling of past and future streamflow (Huss, 2011; Stahl et al., 2016; Viviroli et al., 2011). Some glaciers of the central European Alps have been regularly monitored since nearly the end of the Little Ice Age (ca. 1850), but the majority were only recently or sporadically monitored and long time series of glacier data are rarely available (GLAMOS, 2015; WGMS, 2015). Remote sensing offers unique opportunities
possi-ble to also create a glacier inventory for the whole of Switzer-land around 1850 (Maisch, 1992; Maisch et al., 2000, 2004; Müller et al., 1976). Between 1850 and 1973 no information on glacier area can be obtained from satellite images analysis and aerial photographs are only available locally. Neverthe-less, other sources exist in Switzerland, such as historical to-pographic maps, where glacier areas have been surveyed and drawn manually.
The first topographic surveys started in 1809 in Switzer-land, leading to the publication of the first topographic map for the whole of Switzerland (the Dufour map) based on ge-ometric measurements at a scale of 1 : 100 000. It was subse-quently published between 1845 and 1864. During the sec-ond half of the 19th century cartographic techniques were improved. For example, triangulation with angles was intro-duced (in ca. 1870), the absolute elevation of the “Pierre du Niton” was measured (in 1879), and the depth of the ma-jor Swiss lakes was assessed for the first time (in ca. 1870). These improvements made it possible to map glaciers in re-mote regions more accurately (Imhof, 1927). As a result, the Siegfried map was produced between 1868 and 1949 using the Dufour map as a baseline. The aim was to create homoge-nous maps for the whole of Switzerland for the Topographic Atlas of Switzerland at a scale of 1 : 50 000 for the Alps and 1 : 25 000 for the rest of Switzerland. The project started un-der the direction of the Chief of Staff, Hermann Siegfried, but most of the mapping was done by cartographers and topogra-phers from the private sector. To ensure homogeneity, precise mapping instructions were set from the beginning (Imhof, 1927; Swisstopo, 2017). At that time, the Siegfried map was considered the most advanced topographic map ever pro-duced; especially impressive was the drawing in the moun-tainous regions and the representation of rocks e.g. in glacier-ized areas (Imhof, 1927). Such historical topographic maps provide unique information on large-scale glacier areas for the time period 1868–1949 and are therefore valuable to fill the data gap between 1850 and 1973. They are linked, how-ever, to uncertainties due to the mapping methods available at the time and possible errors in geo-referencing. Such un-certainties may sometimes lead to inaccuracies when glacier areas from historical maps are compared to other products, for example glacier areas from remotely sensed data (Imhof, 1927; Hall et al., 2003; Racoviteanu et al., 2009).
The aim of our study was (1) to digitize the historical Siegfried map at two time slices between 1892 and 1944; (2) to validate the digitized glacier areas through their com-parison with glacier areas of different time periods and from different data sources in order to assess their accuracy at the large scale and locally; and (3) finally to create a dataset use-ful for long-term studies of glacier changes or hydrological modelling.
Siegfried map sheets: Rhone, Po & Inn basins Siegfried map sheets: Rhine basin Swiss border
Digitized glacier areas
Figure 1.The 80 sheets of the Siegfried map covering the glacier-ized area of the Swiss Alps.
2 Data
2.1 Description of the Siegfried map of the Swiss Alps
The Siegfried map consists of a total of ca. 550 sheets that were revised at different publication years. Each sheet covers
an area of 210 km2at a scale of 1 : 50 000 (Alpine regions) or
52.5 km2at a scale of 1 : 25 000. Elevation contours are
rep-resented every 30 and 10 m respectively (Fig. 1). The glacier-ized part of the Swiss Alps is covered by 80 sheets that we digitized for the publication years 1878–1918, with the high-est frequency around 1900 (further called the first period) and 1917–1944, with the highest frequency around 1935 (further called the second period) as shown in Fig. 2. Only the origi-nal publication year is available for the sheets of the Siegfried map, which might differ from the survey year (see Sect. 3.5). The Siegfried map was digitized, geo-referenced, and made available by the Swiss Federal Office of Topography (Swis-stopo).
points (Caminada, 2003) and are therefore difficult to exactly estimate (Hall et al., 2003; Rastner et al., 2016).
2.2 Glacier areas and outlines for validation
We use four datasets of glacier areas and outlines covering the Swiss Alps for the years 1850, 1973, 2003, and 2010 (Fischer et al., 2014; Maisch et al., 2000; Müller et al., 1976; Paul et al., 2011) for the validation of the digitized glacier areas of the Siegfried map at the large scale for the first and second periods (around 1900 and around 1935). These four glacier inventories were produced with different technologies and methodologies summarized in Table 1. Furthermore, the outlines of seven glaciers (Silvretta, Oberaar, Unteraar, Lim-mern, Untergrindelwald, Damma, and Clariden) digitized by Andreas Bauder (ETH Zurich) from different historical maps from several years between 1864 and 1959 were available for local validation. The glacier outlines from years earlier than 1930 were digitized from the first publications of the Dufour and Siegfried maps and later than 1930 from the first publi-cation of the National Map (e.g. Bauder et al., 2007, 2017; Huss et al., 2010). The glacier outlines used for local valida-tion are visible in Fig. 4.
3 Digitization and validation of the Siegfried map
3.1 Digitization
All glacier areas of the 80 sheets from the Siegfried map were manually digitized using ArcMap 10.2.2 to create two shape files with the digitized glacier outlines of the first (around 1900) and second (around 1935) periods. Outcrops within the glaciers were removed. For the digitization, the study area was divided into two regions, the Rhine basin and the Rhone, Po, and Inn basins that were digitized by two different per-sons (Fig. 1) at a scale of 1 : 10 000. A third person finally controlled all digitized areas. Altogether, more than 500 000 nodes corresponding to an average of 28 nodes per kilome-tre of glacier outline and 250 working hours were needed to create the polygons and resulting shape files.
3.2 Data validation
3.2.1 Large-scale validation
To assess the quality and accuracy of the glacierized area from the Siegfried map at the large scale, the digitized glacier outlines of the first and second periods were compared with the glacier outlines of four available glacier inventories (Ta-ble 1, for the years ca. 1850, ca. 1973, 2003, and ca. 2010) in a two-step validation process. The accuracy of the Siegfried map is difficult to assess at the large scale (Hall et al., 2003; Rastner et al., 2016), as no contemporary data are available for comparison. The two-step validation process presented below, however, allowed us to assess whether the digitized
0 10 20 30 40 50 60
Nu
m
b
er
of
sh
ee
ts
Year First period
Second period
Figure 2.Frequency distribution of the publication years of the 80 sheets from the Siegfried map for the first and second periods.
glacier areas were consistent with the other available prod-ucts, meaning that the digitized glacier area of the first and second periods followed a logical evolution compared with the other products.
In a first step, the shapes of the digitized glacier areas from the first and second periods were visually compared to the glacier shapes of the four inventories in order to ensure that they were consistent. During this comparison, the digitized glacier outlines from the first and second digitized periods that appeared in none of the other products were removed as the existence of a glacier in this location could not be veri-fied. This was the case for ca. 0.03 % of the digitized area of
the first and second periods (61.6 and 49.8 km2respectively).
To allow comparison between the glacier areas of the dif-ferent data sources and available years, the digitized glacier outlines from the Siegfried maps and from the four invento-ries were divided into 957 glacier basins with a unique iden-tity number, based on the river basin delineations given by the Federal Office for the Environment (FOEN). This method follows the recommendation of the GLIMS Analysis Tuto-rial (Racoviteanu et al., 2009). The total glacierized area was calculated for each of the 957 glacier basins and is further
referred to as AS,first and AS,second for the two periods of
the digitized Siegfried maps and asA1850,A1973,A2003, and
A2010for the four glacier inventories. The basins were
cho-sen to cover as many individual glaciers as possible. How-ever, this delimitation was only used for the aim of compar-ison and does not represent the real delineation of a glacier area.
Table 1.Glacier inventories used for large-scale validation.
Year Description Format References
ca. 2010 Aerial ortho-imageries acquired between 2008 and 2011 shp Fischer et al. (2014)
2003 Landsat TM scenes acquired in autumn 2003 shp Paul et al. (2011)
ca. 1973 Aerial photographs from September 1973 gif/tif Müller et al. (1976), Maisch et al. (2000) ca. 1850 Glacier outlines morphologically reconstructed from moraine
ex-tents of retreated glaciers from aerial photographs of 1973, 1988, and 1989, historical topographic maps, and field observation.
gif/tif Müller et al. (1976), Maisch (1992),
Maisch et al. (2000, 2004)
In the second validation step,AS,firstandAS,secondwere
there-fore compared toA1850, a product derived from the extent of
the moraines identified from aerial photographs (Maisch et al., 2000; Müller et al., 1976). We then set the following
con-ditions to assess the accuracy ofAS,firstandAS,second.
– Highly consistent:AS< A1850
– Consistent: (AS–A1850)/ A1850<0.1
– Poorly consistent: 0.1>(AS–A1850)/ A1850<0.5
– Not consistent: (AS–A1850)/ A1850>0.5
As land cover classification in remotely sensed data is not un-equivocal (e.g. Racoviteanu et al., 2009) and definition and recognition of moraine partly rely on interpretation (Clark et al., 2004), the 1850 glacier inventory also shows
uncertain-ties and we therefore considered AS to be consistent with
A1850 if AS was up to 10 % larger thanA1850. In case of
“poor consistency” or “no consistency” between the datasets,
AS andA1850were further compared to the glacier areas of
the further available products (A1973,A2003, andA2010) to
decide which one of the two products was more plausible. For this comparison, the shape of each glacierized area from
AS,firstandAS,secondwith poor or no consistency (in total 314
glacier basins) was visually compared to the shape of the
cor-responding glacierized area fromA1973,A2003, andA2010. It
was assumed that glacier area decreased between 1850 and
2010 and thatASorA1850was more likely to be exact if its
shape was most corresponding and overlapping the shape of
the more recent years (A1973,A2003, andA2010). This
eval-uation process was done by one person and allowed us to further assess the accuracy of the digitized maps. Two new categories were introduced for this comparison:
– AS more consistent than A1850: when the shape and
area of the digitized maps were more in agreement with
A1973,A2003, andA2010thanA1850; and
– not consistent but plausible: when it could not be
de-cided from the glacier shape ofASorA1850which one
was more plausible. In this case, both datasets provided plausible glacier shapes, but their areas were not com-parable.
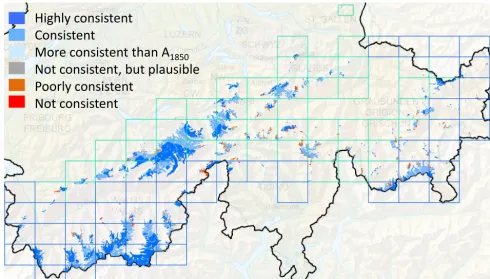
The results of the validation are presented in Table 2 and
Fig. 3. As the results were very similar for AS,first and
AS,second, only the results for AS,first are presented in
Ta-ble 2 and Fig. 3. Overall 71 % of the digitized glaciers of
AS,first, and even 88 % in terms of glacier area, were
con-sistent compared with the datasets. For 13 % of the glacier
basins it was not possible to assess whetherAS,firstorA1850
was more plausible (Table 2). The results forAS,secondwere
similar, with 70 % of the glaciers and 89 % of the total glacier area being consistent with the other products. The difference
between the percentage of digitized glacier basins (>70 %)
and glacier area (>88 %) indicates that small glaciers have
a higher probability of inaccuracies than larger glaciers. This can also be observed in the spatial representation of the
vali-dation (Fig. 3, as an example forAS,first).
3.2.2 Basin-based validation
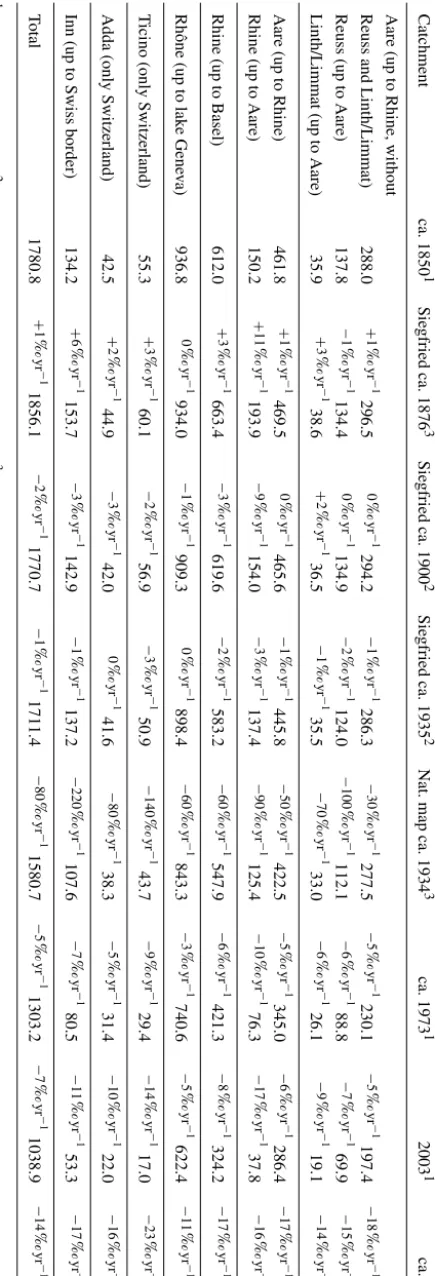
Mercanton (1958) calculated the total glacier area for the main Swiss river basins and for two time periods based on an early edition of the Siegfried map (published between 1869 and 1895 – ca. 1876) and the first National Map (surveyed between 1917 and 1945 – ca. 1934). We assessed the to-tal glacier area for the same river basins with the digitized glacier areas of the Siegfried maps for the first and second periods (published ca. 1900 and ca. 1935) and with the four glacier inventories (Table 3). Next, we calculated the mean
relative change in glacier area (1A) per year according to
Eq. (1) between each successive dataset.
1Ai=
1−Ai/Ai−1
yi−yi−1
·100, (1)
with1Athe relative yearly change in glacier area (% yr−1),
Aithe glacierized area (km2) of the dataseti, andythe given
year of the dataset. The results are presented in Table 3 and compared to the values estimated by Mercanton (1958).
Highly consistent
Consistent
More consistent than A
1850Not consistent, but plausible
Poorly consistent
Not consistent
Figure 3.Large-scale validation of the digitized glacier outlinesAS,first(around 1900).
Table 2.Large-scale validation of the digitized glacier outlines shown, as an example, forAS,first.
Number of Glacierized
glacier basins % area (km2) %
Highly consistent 478 49.95 887.07 50.09
Consistent 165 17.24 660.54 37.30
More consistent thanA1850 38 3.97 16.65 0.94
Total “consistent” 681 71.16 1564.26 88.34
Not consistent withA1850, but plausible 123 12.85 121.83 6.88
Poorly consistent 113 11.81 68.16 3.85
Not consistent 40 4.18 16.55 0.93
Total “not consistent” 153 15.99 84.71 4.78
Total 957 1770.80
area loss in the last decades (e.g. Huss et al., 2008). How-ever, some anomalies can be observed between the datasets. The total glacierized area of the Swiss Alps from the
recon-structed glacierized area of ca. 1850 was 1781 km2,
com-pared to 1856 km2using the oldest Siegfried map (ca. 1876).
The largest differences can be found in the Rhine (up to the Aare) and Inn River basins. These differences can be ex-plained by an underestimation of the glacier areas in 1850 due to the difficult interpretation of the moraine geometry from remotely sensed data (Clark et al., 2004). On the other
hand, an overestimation of the glacier outlined in the first edition of the Siegfried map is possible due to the surveying methods available at the time, the low number of surveying stations used for the first Siegfried maps, and also the ap-proach used for the calculation of the total glacier area by Mercanton (1958). Mercanton (1958) suggested two differ-ent methods to calculate the total glacier area and came to differences of 2.3 %. The total glacierized area for the first
period (around 1900) was 1771 and 1711 km2for the second
Oberaar glacier
1932
1880
1933 1894 Silvretta glacier
1959
1938 1892
1938 1895
Limmern glacier
1959
1947 1935 1900
Damma glacier
1959
19391933
1894
Clariden glacier
1956 1936 1875
1930 1900 Untergrindelwald glacier
1926
1864
1930/1935* 1899/1912*
*Ablation/accumulation areas Unteraar glacier
1947 1927 1880
1930–1932/1935* 1895–1900/1899–1912*
Unteraar glacier
Oberaar glacier Untergrindelwald glacier
Damma glacier
Limmern glacier Silvretta glacier Clariden glacier
Year of digitized Siegfried maps Year of comparison products Glacier flow direction
Figure 4.Comparison of the digitized outlines of the Siegfried map for seven glaciers with contemporary products from other sources.
later editions, corresponding better to the glacier area from the 1850 product.
The comparison between the glacier area of the National map (surveyed ca. 1934) and the Siegfried map (published
ca. 1935) shows the largest differences with 1A up to
22 % yr−1, although both datasets are only separated by 1
year. This discrepancy can be explained by the difference between the surveying year given with the National map and the publication year given with the Siegfried map, as the sheets could have been published several years after sur-veying. Furthermore, the two digitized Siegfried maps (pub-lished ca. 1900 and ca. 1935) are in many river basins similar,
with small1A. Even if the relative changes in glacier area
were expected to be small between 1900 and 1935 due to the positive mass balances observed in the Alps in the 1920s (e.g. Huss et al., 2008), these minimal changes between the first and second periods of the digitized Siegfried map are more likely due to the fact that some sheets were only re-edited without updating the glacier areas. The comparison of the datasets shows that this must have been the case for sev-eral glacier areas and the digitized glacier areas of the second period (1935) are often not representative for the year 1935. This is especially the case in the river basins Linth/Limmat, Rhône, and Adda. We found that the glacier outlines of 28 out of 80 sheets of the second period were identical to the corresponding sheet of the first period.
3.2.3 Local validation
In Fig. 4, the glacier outlines of the glacier areas from seven sheets of the digitized Siegfried map for the first and second periods are compared to glacier outlines digitized from the Dufour and Siegfried maps (earlier than 1930) and
Case A:
•Clear glacier outlines. •Only small differences in digitalization. •Outcrops digitized only by one student.
Case B:
•No clear glacier outlines. •Great differences in digitalization due to different interpretations.
Case C:
•Clear glacier outlines. Presence of text. •Great differences in digitalization due to: (1) different levels of diligence; and (2) assumption of what is behind the text.
Figure 5.Examples of conflicts encountered during digitization of historical maps. The map shows the glacier area digitized for the end product (blue area with black outlines) and in the background the sheet of the Siegfried map for the publication year 1934 for the Wyttenwasser glacier. In cases A to C the outlines of the same glacier area digitized by five students are shown (coloured lines).
from the National Map (later than 1930) for local validation. For the Limmern, Clariden, Untergrindelwald, and Silvretta glaciers, only little differences were observed between the first and second digitized periods, meaning that the Siegfried map of the second period was probably only re-edited (see Sect. 3.2.1). The comparison between the datasets shows for all glaciers (with the exception of the Limmern glacier) good consistency and logical evolution in shape, especially in the ablation area. For the accumulation zone, differences can be observed between the datasets, especially for the Unter-grindelwald and Unteraar glaciers. These differences are due to different delineations of the glacier area between the dif-ferent products. The additional glacierized area from the ac-cumulation zone in the digitized Siegfried map is also present in the four glacier inventories and therefore consistent. The shape of the Limmern glacier is in the ablation area differ-ent for the digitized Siegfried map and for the comparison products from the National map. The Siegfried map seems inaccurate for this glacier.
3.3 Accuracy of the digitization
To assess the accuracy of the digitization, five hydrology masters students (age 20–25 years) digitized all glaciers over
a 23 km2 area from a sheet of the Siegfried map for the
In Fig. 5 the digitized area of the Wyttenwasser glacier is shown for the publication year 1934 and several sources of conflict for the digitization are pointed out (cases A–C). In case A, the glacier outline in the map is clearly drawn and the differences in the digitized outlines are small and depend only on the diligence of the students. In case B, larger dif-ferences are observed, as the map drawing had to be inter-preted, e.g. where does the glacier area stop – at the blue topographic line or at the limit between the white area and the black dots? Are the black dots on the glacier area cov-ering ice or is this rock? Where does the glacier tongue end between blue and black topographic lines? In case C, one part of the glacier area is overprinted with text, which leads to different interpretations of the glacier outline behind the text. Cases B and C illustrate well the different assumptions that need to be made during digitization of historical topo-graphic maps, leading to uncertainties. The comparison of all digitized glacier areas for the years 1894 and 1934 resulted in differences of up to 5 % between the five students. These results are comparable to the differences in standard
devia-tion of 2 to 18 % for small glaciers (<1 km2) and smaller
than 5 % for larger glaciers (>1 km2) observed by Fischer et
al. (2014) and Paul et al. (2013) while deriving glacier out-lines from remotely sensed data.
3.4 Accuracy of the digitized glacier areas
We estimate the precision of digitization to be ca. 5 %. How-ever, it is more difficult to estimate the accuracy of the Siegfried map itself. As the uncertainty is different for each sheet (see Sects. 2.1 and 3.2.1), large regional differences can be found in the accuracy of the glacier outlines. On some sheets, the inaccuracy of the Siegfried map might be much higher than the interpretation bias of the digitization. How-ever, the large-scale and basin-scale validations allowed us to assess which ones of the digitized glacier areas followed a logical evolution in shape and area and were therefore plau-sible compared with the other available products of glacier outlines for different years; 71 % of the glaciers and 88 % of the glacier area were considered consistent through the analysis. The local validation furthermore showed that the shape of the seven analysed glaciers was well represented in the Siegfried map. This analysis however is only valid for the studied glaciers and not for the entire area. While the presented product of glacier outlines contains all digi-tized glacier areas from the Siegfried map for Switzerland (Sect. 4), we recommend only using the glacier areas that were stated as “consistent”, “highly consistent”, or “more
consistent thanA1850” by the validation process. If the other
glacier areas are used, their large uncertainty should be con-sidered in the interpretation of the results.
During the creation of the Siegfried map, the time span from measurements to publication extended up to several years, due to the material available at that time and to the complex topography. The Siegfried sheets are unfortunately
only given with the publication year and no further infor-mation can be found on the surveying year. Therefore, one should keep in mind that the year given with the digitized glacier outlines from the Siegfried map is only representa-tive for a period of time and cannot be taken as an exact date.
4 Data use and application
The digitized glacier areas of the Rhine River basins were used to develop the glacier routine of the HBV-light model in order to implement transient changes in glacier area and volume from 1900 to date (Seibert et al., 2018). This model was then used within the ASG-Rhine project with the aim of calculating the snowmelt, glacier melt, and rainfall contribu-tion to the Rhine discharge for the time period 1900–2006 (Stahl et al., 2017). The glacier areas and glacier mass bal-ances of several glaciers calculated within the ASG-Rhine project for the beginning of the 20th century showed compa-rable results to contemporary analyses or observations from other studies (Stahl et al., 2017). These different applications show that the digitized Siegfried map brings important infor-mation on glacier area for large-scale and long-term analysis and can be successfully used to better understand and model glacier area changes.
5 Data availability
6 Conclusions
We digitized glacier outlines from the Siegfried map for the Swiss Alps for two periods around 1900 and 1935. We dealt with the challenges of digitization of historic maps (e.g. uncertainties in georeferencing, time of measurement vs. time of publication) with two validation schemes at the large scale, basin scale, and locally. Comparison to four ex-isting glacier inventories covering different time periods re-vealed that at least 70 % of the digitized glaciers and 88 % of the total glacier area were comparable for both digitized periods to the glacier areas and shape of the glacier invento-ries and therefore plausible. Further comparison at the river basin and glacier scale showed reliable glacier representation for most of the areas. The uncertainty of the digitization it-self was assessed separately and was less than 5 %, which is comparable to the accuracy of deriving glacier outlines and areas from remotely sensed data. The presented datasets for a first period around 1900 and a second period around 1935 are valuable information for the glacier extent in the Swiss Alps at the beginning of the 20th century where no other data source is available covering the entire Swiss Alps. The dataset closes the gap between the reconstruction of the glacier areas at around 1850 from the moraine extent and the first complete dataset of glacier areas in the Swiss Alps from aerial photographs in 1973. Under consideration of the data uncertainty, the use of the digitized datasets in com-bination with other existing glacier inventories can provide important information about changes in glacier areas for the last 120 years, which is essential for long-term and accurate glacier mass balance or hydrological modelling in glacier-ized basins.
Author contributions. DF homogenized and validated the pre-sented datasets and prepared the manuscript with contributions from all co-authors.
Competing interests. The authors declare that they have no con-flict of interest.
Acknowledgements. The authors thank Swisstopo for providing the historical topographic Siegfried map and Matthias Huss for providing several glacier outlines for validation. We are grateful to Damaris De for the digitization of part of the glacier areas. We furthermore thank Mirko Mälicke and his students Ruben Beck, Daniela Boru, Helena Böddecker, Verena Lang, Lukas Maier, and Miranda Perrone for assessing the accuracy of the digitization. We also want to thank two anonymous referees and Rheinhard Drews for their valuable comments and suggestions that helped to improve our manuscript. The glacier areas of the Rhine basin were digitized within the ASG-Rhein project (snow and glacier melt components of the streamflow of the River Rhine and its tributaries considering the influence of climate change) funded
by the International Commission for the Hydrology of the Rhine Basin (CHR). The remaining glacier areas were digitized within the Hydro-CH2018 project funded by the Federal Office for the Environment (FOEV). The first author was funded by the German Federal Environmental Foundation (DBU).
Edited by: Reinhard Drews
Reviewed by: two anonymous referees
References
Bauder, A., Funk, M., and Huss, M.: Ice-volume changes of selected glaciers in the Swiss Alps since the end of the 19th century, Ann. Glaciol., 46, 145–149, 2007.
Bauder, A., Fischer, M., Funk, M., Gabbi, J., Hoelzle, M., Huss, M., Kappenberger, G., and Steinegger, U.: The Swiss Glaciers 2013/14 and 2014/15, Glaciological Report No. 135/136, Zurich, ISSN 1424-2222, 2017.
Caminada, P.: Pioniere der Alpentopographie: Die Geschichte der Schweizer Kartenkunst, VS-Verlag, Zurich, 2003.
Clark, C. D., Evans, D. J. A., Khatwa, A., Bradwell, T., Jor-dan, C. J., Marsh, S. H., Mitchell, W. A., and Bateman, M. D.: Map and GIS database of glacial landforms and features related to the last British Ice Sheet, Boreas, 33, 359–375, https://doi.org/10.1111/j.1502-3885.2004.tb01246.x, 2004. Collins, D. N.: Climatic warming, glacier recession and runoff from
Alpine basins after the Little Ice Age maximum, Ann. Glaciol., 48, 119–124, https://doi.org/10.3189/172756408784700761, 2008.
Fischer, M., Huss, M., Barboux, C., and Hoelzle, M.: The new Swiss Glacier Inventory SGI2010: Relevance of using high-resolution source data in areas dominated by very small glaciers, Arctic, Antarct. Alp. Res., 46, 933–945, 2014.
Fischer, M., Huss, M., and Hoelzle, M.: Surface elevation and mass changes of all Swiss glaciers 1980–2010, The Cryosphere, 9, 525–540, https://doi.org/10.5194/tc-9-525-2015, 2015.
Freudiger, D., Mennekes, D., Seibert, S., and Weiler, M.: His-torical glacier outlines from digitized topographic maps of the Swiss Alps for the years ca. 1900 and ca. 1935, Frei-Dok, available at: https://freidok.uni-freiburg.de/data/15008, https://doi.org/10.6094/UNIFR/15008, 2017.
GLAMOS: “The Swiss Glaciers”, Reports of the Glaciological Commission of the Swiss Academy of Science (SAS), published by the Laboratory of Hydraulics, Hydrology and Glaciology (VAW) of ETH Zurich, No. 1-132, 1881–2015, 2015.
Hall, D. K., Bayr, K. J., Schöner, W., Bindschadler, R. A., and Chien, J. Y. L.: Consideration of the errors inherent in map-ping historical glacier positions in Austria from the ground and space (1893–2001), Remote Sens. Environ., 86, 566–577, https://doi.org/10.1016/S0034-4257(03)00134-2, 2003. Huss, M.: Present and future contribution of glacier storage change
to runoff from macroscale drainage basins in Europe, Water Resour. Res., 47, 1–14, https://doi.org/10.1029/2010WR010299, 2011.
Huss, M. and Fischer, M.: Sensitivity of Very Small Glaciers in the Swiss Alps to Future Climate Change, Front. Earth Sci., 4, 1–17, https://doi.org/10.3389/feart.2016.00034, 2016.
Geo-phys. Res., 113, F01015, https://doi.org/10.1029/2007JF000803, 2008.
Huss, M., Usselmann, S., Farinotti, D., and Bauder, A.: Glacier mass balance in the south-eastern Swiss Alps since 1900 and perspectives for the future, Erdkunde, 2010, 119–140, https://doi.org/10.3112/erdkunde.2010.02.02, 2010.
Imhof, E.: Unsere Landeskarten und ihre weitere Entwicklung, Schweizerische Zeitschrift für Vermessungswesen und Kul-turtechnik, 4, 81–178, 1927
Ivy-Ochs, S., Kerschner, H., Maisch, M., Christl, M., Kubik, P. W., and Schlüchter, C.: Latest Pleistocene and Holocene glacier variations in the European Alps, Q. Sci. Rev., 28, 2137–2149, https://doi.org/10.1016/j.quascirev.2009.03.009, 2009.
Kääb, A., Paul, F., Maish, M., Hoelze, M., and Haeberli, W.: The new remote sensing derived Swiss glacier in-ventory: II. First results, Ann. Glaciol., 34, 362–366, https://doi.org/10.3189/172756402781817941, 2002.
Maisch, M.: Die Gletscher Graubündens. Rekonstruktion und Auswertung der Gletscher und deren Veränderungen seit dem Hochstand von 1850 in Gebiet der Östlichen Schweizer Alpen, Teile A und B, Phys. Geogr. Zurich, 33, 1992.
Maisch, M., Wipf, A., Denneler, B., Battaglia, J., and Benz, C.: Die Gletscher der Schweizer Alpen: Gletscherstand 1850. Aktuelle Vergletscherung, Gletscherschwundszenarien, End report NFP 31, Second Edition, Zurich, vdf Hochschulverlag, ETH Zurich, p. 373, 2000.
Maisch, M., Paul, F., and Kääb, A.: Kerngrössen, Flächen- und Vol-umenänderungen der Gletscher 1850–2000, Hydrologischer At-las der Schweiz (HADES), Bern, 2004.
Mercanton, P. L.: Aires englacée et cotes frontales des glaciers suisses – Leurs changements de 1876 à 1934 d’après l’Atlas Siegfried et la Carte Nationale et quelques indications sur les cariations de 1934 à 1957, Wasser und Energiewirtschaft, 12, 347–351, 1958.
Müller, F., Caflish, T., and Müller, G.: Firn und Eis der Schweizer Alpen, Gletscherinventar, Zurich vdf Hochschulverlag ETH Zurich, p. 373, 1976.
Paul, F., Frey, H., and Le Bris, R.: A new glacier inventory for the European Alps from Landsat TM scenes of 2003: Challenges and results, Ann. Glaciol., 59, 144–152, 2011.
Paul, F., Barrand, N. E., Baumann, S., Berthier, E., Bolch, T., Casey, K., Frey, H., Joshi, S. P., Konovalov, V., Le Bris, R., Mölg, N., Nosenko, G., Nuth, C., Pope, A., Racoviteanu, A., Rastner, P., Raup, B., Scharrer, K., Steffen, S., and Winsvold, S.: On the accuracy of glacier outlines de-rived from remote-sensing data, Ann. Glaciol., 54, 171–182, https://doi.org/10.3189/2013AoG63A296, 2013.
Racoviteanu, A. E., Paul, F., Raup, B., Khalsa, S. J. S., and Armstrong, R.: Challenges and recommendations in map-ping of glacier parameters from space: Results of the 2008 global land ice measurements from space (GLIMS) work-shop, Boulder, Colorado, USA, Ann. Glaciol., 50, 53–69, https://doi.org/10.3189/172756410790595804, 2009.
Rastner, P., Joerg, P. C., Huss, M., and Zemp, M.: Historical analysis and visualization of the retreat of Findelengletscher, Switzerland, 1859–2010, Global Planet. Change, 145, 67–77, https://doi.org/10.1016/j.gloplacha.2016.07.005, 2016.
Seibert, J., Vis, M. J. P., Kohn, I., Weiler, M., and Stahl, K.: Technical note: Representing glacier geometry changes in a semi-distributed hydrological model, Hydrol. Earth Syst. Sci., 22, 2211–2224, 2018 https://doi.org/10.5194/hess-22-2211-2018, 2018.
Stahl, K., Weiler, M., Kohn, I., Freudiger, D., Seibert, J., Vis, M., and Gerlinger, K.: The snow and glacier melt components of streamflow of the river Rhine and its tributaries considering the influence of climate change – Synthesis report, Lelystad, The Netherlands, available at: www.chr-khr.org/en/publications (last access: 4 July 2017), 2016.
Stahl, K., Weiler, M., Freudiger, D., Kohn, I., Seibert, J., Vis, M., Gerlinger, K., and Böhm, M.: The snow and glacier melt com-ponents of streamflow of the river Rhine and its tributaries con-sidering the influence of climate change, Final report to the In-ternational Commission for the Hydrology of the Rhine (CHR), available at: www.chr-khr.org/en/publications, last access: 4 July, 2017.
Swisstopo: Federal Office of Topography – Siegfried maps 1:50 000, available at: https://shop.swisstopo.admin.ch/en/ products/maps/historical/DIGIT_SIEGFRIED50, last access: 15 May, 2017.
Swisstopo: Federal Office of Topography – Back-ground information on the Dufour Map, available at: https://www.swisstopo.admin.ch/en/knowledge-facts/
maps-and-more/historical-maps/dufour-map.html, last ac-cess: 20 February, 2018.
Vincent, C., Le Meur, E., Six, D., and Funk, M.: Solving the para-dox of the end of the Little Ice Age in the Alps, Geophys. Res. Lett., 32, 1–4, https://doi.org/10.1029/2005GL022552, 2005. Viviroli, D., Archer, D. R., Buytaert, W., Fowler, H. J., Greenwood,
G. B., Hamlet, A. F., Huang, Y., Koboltschnig, G., Litaor, M. I., López-Moreno, J. I., Lorentz, S., Schädler, B., Schreier, H., Schwaiger, K., Vuille, M., and Woods, R.: Climate change and mountain water resources: overview and recommendations for research, management and policy, Hydrol. Earth Syst. Sci., 15, 471–504, https://doi.org/10.5194/hess-15-471-2011, 2011. WGMS: Global Glacier Change Bulletin No. 1 (2012–2013), edited