Quantifying water stress in canola (Brassica napus L.) using crop
water stress index
A. Heydari1, E. Bijanzadeh1,*, R. Naderi1, Y. Emam2
1Department of Agroecology, Agricultural College and Natural Resources of Darab, Shiraz University, Darab I. R.
Iran
2Department of Crop Production and Plant Breeding, College of Agriculture, Shiraz University, Shiraz, I.R. Iran
*Corresponding Author: bijanzd@shirazu.ac.ir DOI:10.22099/iar.2019.5299
ARTICLE INFO ABSTRACT- The relationship between canopy temperature and soil moisture is particularly important because of using canopy temperature as an indicator of crop water stress. A field experiment was conducted to calculate crop water stress index (CWSI) of two canola cultivars including RGS and Sarigol at College of Agriculture and Natural Resources of Darab, Shiraz University, Iran during 2013-2014 growing season. Irrigation regimes consisted of well watered [Irrigation equal to 100% field capacity (FC)], light drought (75% FC), moderate drought (50% FC), and severe drought (25% FC) stresses which were arranged in a randomized complete block design (RCBD) with three replications. In RGS and Sarigol, CWSI values showed an increasing trend from March (0.066 and 0.093 in well watered) to June (0.711 and 0.821 in severe drought) respectively, as a result of higher vapor pressure deficit (VPD) and increase in canopy-air temperature differences (Tc-Ta). In both cultivars, when the air temperature increased from March to June, Tc-Ta increased. The highest monthly average value of CWSI for all treatments was obtained in June. By increasing the drought stress, the color grading score decreased from 6 to 2 sharply in May and June. An acceptable color quality (6 -5) was sustained in May, under light drought condition. Also, a negative relationship was observed between CWSI with color quality (R2=0.94**) and grain yield (R2=0.97**). It could be concluded that in
semi-arid areas, light drought is the best option for canola production while mean seasonal CWSI being ranged about 0.198 to 0.294 without any loss in visual color quality of canola. Abbreviations: CWSI_crop water stress index; FC_field capacity; Tc-Ta_canopy-air temperature differences; VPD_ vapor pressure deficit.
Article history:
Received 23 October 2016 Accepted 29 January 2017 Available online 19 August 2019
Keywords:
Canopy temperature color quality drought stress irrigation scheduling
INTRODUCTION
Canola is a useful break crop from a continuous run of cereal production. It is becoming popular in Iran, including in Fars province, due to its high oil and protein content, market demand (Naderi and Ghadiri, 2011) and purchase guaranteed scheme by government in the province (Miri and Rahimi, 2009). In the world, almost 60% of freshwater usage belongs to irrigation and water stress is one of the most important stresses limiting canola growth (Sneha et al., 2013; Heydari et al., 2015). An actively transpiring leaf with no water stress is able to loose energy and lower the temperature than surrounding air due to evaporative cooling. As water becomes limiting, transpiration is reduced and the leaf temperature increases. If little water is transpired, leaves will warm above air temperature because of absorbed radiation. Therefore, the canopy-air temperature differences (Tc-Ta) give an ideal representation of crop water stress levels (Jackson et al., 1981). Canopy temperature measured with infrared thermometer is often promoted as a basis for irrigation scheduling in different plants (Wanjura et al., 2000; Bockhold et al., 2003; Clarke et al., 2003).
Jalali-Farahani et al. (1993) found that the theoretical crop water stress index (CWSI) was the most promising approach for irrigation scheduling compared with the empirical CWSI of Idso et al., (1981) and with an empirical model that included net radiation as an independent variable. Because of the difficulty of using the theoretical CWSI, however, most researchers have preferred to use the empirical approach of Idso et al., (1981), which has been shown to work relatively well for a given location as long as locally calibrated baselines are available (Irmak et al., 2000; Sneha et al., 2013).
To establish the lower and upper baselines, however, most researchers have only included air vapor pressure deficit (VPD) and Tc-Ta and have assumed that other factors affecting Tc- Ta, such as wind speed and available energy, are constant if measurements are made close to noon and under clear-sky conditions. It is also argued that changes in canopy temperature (Tc), under stress and non-stress conditions, provide clues for crop water status and yield performance during drought seasons. The crop water stress index (CWSI) derived Shiraz
from Tc- Ta versus VPD was found to be a promising tool for quantifying crop water stress (Idso and Reginato, 1982; Jackson, 1982; Alderfasi and Nielsen, 2001). Al-Faraj et al. (2001) reported that the Tc-Ta increased with a decrease in soil water content in tall fescue (Festuca arundinacea Schreb.).
Canola producers in the southern Iran are particularly interested in studies concerning the conservation and management of water due to decreasing the precipitation and drought stress conditions in the field. Little information has been published about quantifying water stress index in canola using crop water stress index under different irrigation regimes. The main aim of this study was to develop a baseline equation, which could be applied to determine CWSI for monitoring water status and irrigation scheduling of canola under water shortage conditions.
MATERIALS AND METHODS
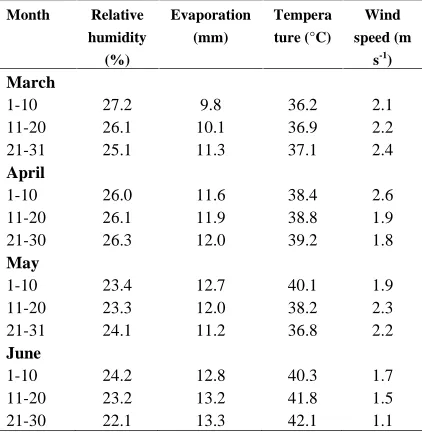
A field experiment was conducted to calculate crop water stress index (CWSI) of two canola cultivars including RGS and Sarigol at the Research Station of College of Agriculture and Natural Resources of Darab (28°29´ N, 54°55´ E), Shiraz University, Iran during 2013-2014 growing season. The soil was a loam (fine, loamy, carbonatic, hyperthermic, typic Torriorthents) with soil properties given in Table 1. The research area has semi-arid climate with hot and dry summers and cool and rainy winters. Ten-day average of some meteorological data shown in the study area during March to June 2014 are given in Table 2. Also, rainfall during March to June was negligible (about 1-3 mm).
Table 1. Soil physicochemical properties of the experimental site
Properties
Soil texture Loamy
Sand (%) 36.33
Silt (%) 40.27
Clay (%) 23.40
Soil pH 7.56
Irrigation regimes included well watered [Irrigation according to 100% field capacity (FC)], light drought stress (75% FC), moderate drought (50% FC), and severe drought (25% FC) stresses were arranged in a randomized completely block design with four replications. Likewise, there was an unirrigated plot to determine the upper baseline required for determination of CWSI. The size of each plot was 3 m×5 m and it was surrounded with a 20 cm high earth berm, with a 1 m wide buffer space between the plots. On November17th 2013, canola seeds were sown. Drought stress treatments started at flowering stage of canola to the end of growing season. The soil water content was monitored in each plot by using the gravimetric method at 30 cm intervals down to 120 cm. Time-volume technique was used. This technique is an irrigation
technique in which irrigation water is applied by polyethylene pipes set in each plot and the time of each plot irrigation is calibrated by a timer and a standard container (Grimes et al., 1987). Then, irrigation water amount of each plot (measured by gravimetric method) was converted to time (min) and the data was applied in analysis.
Table 2. Ten-day means of climatic data measured daily at the experimental site in 2014
Month Relative humidity (%)
Evaporation (mm)
Tempera ture (°C)
Wind speed (m
s-1 ) March
1-10 27.2 9.8 36.2 2.1
11-20 26.1 10.1 36.9 2.2
21-31 25.1 11.3 37.1 2.4
April
1-10 26.0 11.6 38.4 2.6
11-20 26.1 11.9 38.8 1.9
21-30 26.3 12.0 39.2 1.8
May
1-10 23.4 12.7 40.1 1.9
11-20 23.3 12.0 38.2 2.3
21-31 24.1 11.2 36.8 2.2
June
1-10 24.2 12.8 40.3 1.7
11-20 23.2 13.2 41.8 1.5
21-30 22.1 13.3 42.1 1.1
Infrared thermometer (LT Lutron, Model TM-958, Taiwan) was used to measure the canopy temperature (3, 6 and 9 days after each irrigation) from the 1stof March to the 30th of June 2014. To ensure the collection of accurate data, the infrared thermometer was held with a horizontal angle of 45° during measurements. Temperature measurement was done when there was no cloud. According to Idso et al. (1981), midday canopy temperature is the best indicator to detect the crop water stress. In each plot, the measurements were carried out from four directions (east, west, north and south).
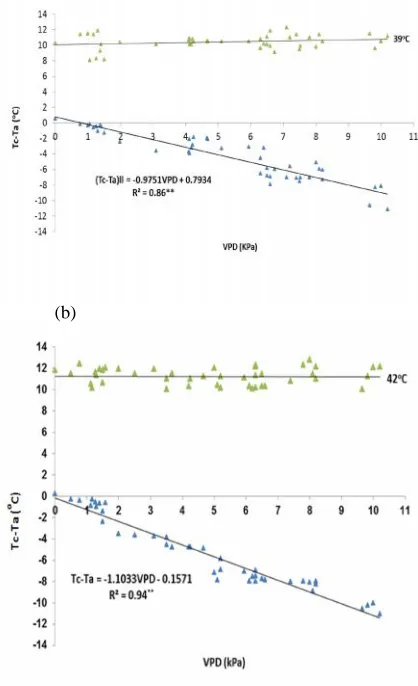
Air temperature and relative humidity were recorded using thermo hygrograph (Lambrecht, Model 252, Germany) and psychrometer, simultaneously (Lambrecht, Model 1030, Germany) as the basis for calculating vapor pressure deficit (VPD) (Monteith and Unsworth, 1990). VPD was calculated from standard psychrometer equation (Allen et al., 1998). Then, CWSI values were calculated using the empirical method of Idso et al. (1981). The relationship between canopy-air temperature differences (Tc-Ta) and VPD were plotted under stressed and non-stressed conditions (Fig. 1). In this graph, the non-non-stressed baseline was determined from the data collected three days after irrigation in well watered treatment between 08:00 and 17:00 with 30-min intervals.
(b)
Fig. 1. The upper and lower baselines used to calculate CWSI , of canola cultivars including RGS (a) and Sarigol (b) under stressed and non-stressed conditions, respectively. VPD = vapor pressure deficit, Tc-Ta= canopy-air temperature differences.
The Idso’s empirical non-water-stressed baseline can be expressed as Equation (1):
Tc–Ta = aVPD +b
where Tc–Ta is the measured canopy and air temperature differences for non- stressed treatment (°C) and VPD is vapor pressure deficit (kPa) and a (slope) and b (intercept) are the linear regression coefficients of Tc–Ta on VPD. The upper baseline was determined using the average Tc–Ta values measured at 13:00, 14:00 and 15:00 before each irrigation. Using the upper and lower limit estimates, a CWSI can be defined by the following Equation (2) (Idso et al., 1981):
(CWSI) =( −( − ) − ( −) − ( − ))
where (Tc–Ta)m, (Tc–Ta)ll and (Tc–Ta)ul are the measured canopy and air temperature differences at the moment and the lower and upper limit values (°C), respectively. Water productivity (WP) was calculated by the following equation (3) (Doorenbos and Kassam, 1979).
WP =I + PY
where Y, I and P were canola grain yield (kg), irrigation water applied (m3), and precipitation (m3), respectively.
The canola color during the experiment was compared with the one given in the scale at 10-day intervals. After comparing color grades, the color and page numbers were found out. The page numbers, color names, and color numbers as appeared in the Munsell Color Scale as well as grading score in the experiment are given in Table 3. The observed grass colors were scored in such a way that dark green color corresponded to 9 and yellow color to 1. As the scores change from 9 to 1, the corresponding colors turn from dark green to yellow color representing that the plant is dead or it is at dormancy. Finally, the collected data were analyzed using SAS software (2003) and the means were compared using LSD test (p≤ 0.05).
Table 3. Page numbers of Munsell Color Chart, color numbers and visual quality values (Wilde and Voigt, 1977). Page numbers
of the chart
Color numbers (value/chroma)
Visual quality value
Color changing
5GY 3/4 9 Dark green
5GY 4/4 8
5GY 4/6, 8 7
5GY 5/4, 6, 8, 10 6 Green
5GY 6/4, 6, 8, 10 5
5GY 7/4, 6, 8, 10 4
2.5GY 7/4, 6, 8 3
2.5GY 8/4, 6, 8 2 Light green
2.5Y and 5Y
All colors 1 Yellow
RESULTS AND DISCUSSION
Water Productivity
Determination of Lower Base Line
The upper (stressed) and lower (non-stressed) baselines to calculate CWSI are presented in Fig. 1a and Fig. 1b, respectively. In RGS and Sarigol, the upper limit [(Tc-Ta) ul], was 9.9 and 11.78 °C when the air temperature at solar noon was 39 and 42 °C, respectively. Emekli et al., (2007) determined that the upper limit for bermudagrass (Cynodon dactylon), was 11.22 when the air temperature was 40°C at solar noon. The equation of lower limit was found to be (Tc-Ta) ll = -0.9751VPD + 0.7934 in RGS (Fig. 1a) and (TcTa) ll = 1.1033VPD -0.1571 in Sarigol (Fig. 1b). Orta et al. (2002) reported that in sunflower the lower baseline equation for (Tc-Ta) ll was–0.25VPD–2.9. In a study on corn (Zea mays L.) in southern Iran, Edalat et al. (2009) declared that (Tc-Ta) ll was equal to -0.926 VPD + 1.272.
CWSI Changes
In RGS, CWSI values showed an increasing trend from March (0.066 in well water) to June (0.711 in severe drought) as a result of higher VPD values and negatively increase in Tc-Ta differential (Table 4). Similar trend was observed in Sarigol in June, so that CWSI decreased from 0.381 in well watered to 0.821 in moderate drought stress, significantly different at p≤0.05. In both of the canola cultivars, when air warmed from March to June, Tc-Ta differential increased and the highest monthly average value of CWSI for all treatments was obtained in June (Table 4). As VPD increased, the transpiration also increased and when soil water content was not a limiting factor, plant transpires without restriction, resulting in a smaller Tc-Ta differential (Emekli et al., 2007). Overall, a decrease in VPD values in June caused an increase in CWSI and the weather conditions could be the reason for lower values of CWSI in March (Tables 2 and 4).
In RGS and Sarigol, the highest mean seasonal CWSI for severe drought treatments were 0.531 and 0.650, respectively (Table 4). In both of the cultivars, significant differences were observed between mean CWSI values of well watered and drought stress treatments. It is appeared that the CWSI values can potentially be employed as a good indicator of crop water stress index in canola. Similar results have been reported in previous studies (e.g. Irmak et al., 2000). Likewise, Jalali-Farahani et al., (1993) also found that the seasonal average of CWSI values for bermudagrass, using empirical method, were 0.02, 0.16, and 0.5 in treatments including daily irrigation as well watered, light drought, and moderate drought, respectively. Sneha et al., (2013) declared that in mahogany (Swietenia macrophylla King) CWSI responded to irrigation events along the whole season and clearly detected mild water stress, suggesting extreme sensitivity to variations in plant water status. They revealed the potential of CWSI for early, non-destructive and less time-consuming estimation of drought stress. Orta et al., (2002) reported a mean CWSI of 0.59 before irrigation times produced maximum yield in sunflower (Helianthus annuus L.).
Canola Grain Yield
In all of the irrigation regimes, RGS had higher grain yield and mean seasonal CWSI ranged from 0.128 to 0.531 so that, in light drought stress condition, RGS had a higher grain yield (501.2 g m-2) compared to Sarigol (413.5 g m-2) (Table 4). Interestingly, in all of the irrigation regimes by applying lower water (from flowering to the end of growing season) and increasing mean CWSI, grain yield in Sarigol cultivar decreased sharper than RGS (Table 4). This might mean that Sarigol was a more drought sensitive cultivar. Garrot& Mancino (1994) found that in wheat the highest grain yield (606 g m-2) was achieved at CWSI levels between 0.3 and 0.37. These results illustrate the value of using CWSI as an indicator of crop water status and many researchers suggested that CWSI could be used to reach acceptable grain yield especially under water shortage conditions (Gardner et al., 1992; Alderfasi and Nielsen 2001; Emekli et al., 2007).
Color Quality of Canola
In both cultivars in May, by increasing the drought stress from well water to severe drought, the color grading score decreased from 6 to 2 sharply, and stayed constant at 2 in June under severe drought treatment (Table 5). Overall, in Sarigol the mean seasonal visual quality values were more affected negatively by increasing the drought stress compared to RGS. It might be due to higher air temperature and Tc-Ta differential in Sarigol compared to RGS (Table 2 and Fig. 1). Bonos and Murphy (1999) also found that drought stress caused by hot summer days would affect visual quality of Kentucky bluegrass (Poa pratensis L.) negatively.
In RGS and Sarigol, the color grading number in un-irrigated plot was sharply decreased (from 8 to 1) because the leaves were completely perished in this treatment by the end of April (Table 5). Bastug and Buyuktas (2003) reported that the best color quality for turfgrass (Cynodon dactylon) under the Mediterranean conditions could be attained when water was applied as much as 75% of Class A pan. In a similar study, Karcher and Richardson (2003) found that the color quality grading numbers ranged from 9 to 1 with an acceptable minimum visual quality number of 6. In the current study, an acceptable color quality (6 -5) was sustained in May, under well watered and light drought stress conditions, however, the mean color quality obtained in moderate and severe drought treatments was not desirable (4.25 to 2.5) for canola.
Relationship Between CWSI With Water Applied, Color Quality and Grain Yield
temperature and CWSI were increased, compared to well watered conditions. In the current study, canola consumed more water and had more CWSI when exposed to moderate drought and severe drought stress conditions, especially under hot weather in the study area. A negative relationship was observed between CWSI and color quality (R2=0.94**; Fig. 3). This relation could be used as a suitable tool by canola producers to maintain required seasonal color quality based on the crop water stress index under semi-arid condition [Bonos and Murphy, (1999); Al-Faraj et al., (2001); Emekli et al., (2007)]. Similarly, grain yield was correlated
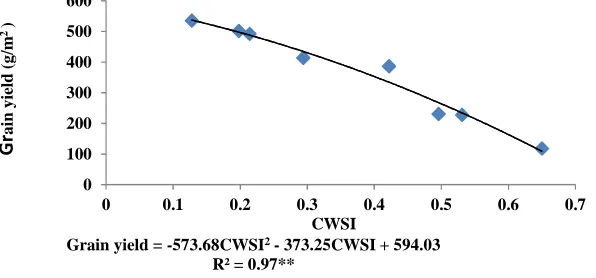
with mean seasonal CWSI values, nagatively (R2=0.97**) (Fig. 4) by the following polynomial Equation (3): Grain yield (g m-2)= -573.68 (CWSI)2-373.25 (CWSI)+594.03
This equation could be used for yield prediction under different CWSI value in canola. Predicting the grain yield to crop water stress had a key role in developing strategies and decision-making by researchers and farmers for irrigation scheduling under water shortage conditions (Yuan et al., 2004; Orta et al., 2004).
Table 4. Monthly and mean seasonal CWSI and grain yield of canola under different irrigation regimes in RGS and Sarigol cultivars.
Irrigation regimes
Mean CWSI Mean Seasonal
CWSI
Grain yield (g m-2)
March April May June
RGS Sarigol RGS Sarigol RGS Sarigol RGS Sarigol RGS Sarigol RGS Sarigol
Well
watered 0.066 0.093 0.118 0.217 0.133 0.166 0.196 0.381 0.128 0.214 535.4 491.3
Light
drought 0.011 0.130 0.289 0.343 0.208 0.297 0.283 0.407 0.198 0.294 501.2 413.5
Moderate
drought 0.291 0.309 0.473 0.503 0.303 0.378 0.621 0.792 0.422 0.496 386.2 230.2
Severe
drought 0.322 0.476 0.677 0.731 0.412 0.573 0.711 0.821 0.531 0.650 227.1 117.4
LSD
(0.05) 0.03 0.04 0.17 0.11 0.19 0.12 0.15 0.09 0.15 0.17 101.6 71.1
Table 5. Visual color quality values of canola during the experiment under different irrigation regimes in RGS and Sarigol cultivars.
Irrigation regimes
Visual quality values
At flowering (before stress)
March April May June Mean
Seasonal RGS Sarigol RGS Sarigol RGS Sarigol RGS Sarigol RGS Sarigol RGS Sarigol Well
watered 8 8 7 7 6 6 6 6 5 5 6.00 6.00
Mild
drought 8 8 7 6 6 5 6 5 4 4 5.75 5.00
Severe
drought 8 8 5 5 5 4 4 3 3 2 4.25 3.50
Most severe drought
8 8 3 3 3 3 2 2 2 2 2.50 2.50
Unirrigated 8 8 2 2 1 1 1 1 1 1 1.25 1.25
Fig. 3. Relationship between visual color quality values and CWSI of canola during 2013-2014 growing season
Fig. 4. Relationship between canola grain yield and CWSI during 2013-2014 growing season
CONCLUSIONS
In the current study, canola Sarigol cultivar consumed more water and had more CWSI when exposed to moderate drought and severe drought stress conditions, especially under hot months such as May and June in the study area. A negative relationship was observed between CWSI with color quality and grain yield. It concluded that light drought is the best option for canola
production especially in RGS while mean seasonal CWSI being ranged about 0.198 to 0.294 without any loss in visual color quality of canola under semi-arid areas, however, no acceptable quality was observed in severer drought and most moderate drought stress treatments. It revealed the potential of CWSI for early, non-destructive and less time-consuming estimation of drought stress in canola.
REFERENCES
Alderfasi, A. A., & Nielsen, D. C. (2001). Use of crop water stress index for monitoring water status and scheduling irrigation in wheat. Agricultural Water Management, 47, 69–75.
Al-Faraj, A., Meyer, G. E., & Horst, G. L. (2001). A crop water stress index for tall fescue (Fetusca arundinacea Schreb.) irrigation decision-making: a traditional method. Commercial Agriculture, 31, 107–124.
Allen, R. G., Pereira, L.S., Raes, D., & Smith, M. (1998). Crop evapotranspiration. FAO Irrigation and Drainage Paper 56.Rome, Italy: Food and Agriculture Organization of the United Nations.
Baladi, R., Bijanzadeh, E., & Naderi, R. (2015). Evaluation of water deficit and phosphorus application methods on phosphorus use efficiency and yield of two rapeseed cultivars. Crop Ecophysiology, 26, 114-121.
Grain yield = -573.68CWSI2- 373.25CWSI + 594.03 R² = 0.97**
0 100 200 300 400 500 600
0 0.1 0.2 0.3 0.4 0.5 0.6 0.7
G
r
a
in
y
ie
ld
(
g
/m
2)
Bastug, R., & Buyuktas, D. (2003). The effects of different irrigation levels applied in golf courses on some quality characteristics of turfgrass. Irrigation Science, 22, 87–93. Bockhold, D. L., Thompson, A. L., Sudduth, K. A., Henggeler,
J. C., Colaizzi, P. D., & Barnes, E. M. (2011). Irrigation scheduling based on crop canopy temperature for humid environments. American Society of Agriculture Biology and Engineering, 54, 2021-2028.
Bonos, S. A., & Murphy, J. A. (1999). Growth responses and performance of Kentucky bluegrass under summer stress. Crop Science, 39, 770–774.
Clarke, T. R., Choi, C. Y., & Waller, P. M. (2003). Estimating soil moisture under low-frequency surface irrigation using crop water stress index. Journal of Irrigation Drainage and Engineering, 129, 27-35
Doorenbos, J., & Kassam, A.H. (1979). Yield response to water. FAO Irrigation and Drainage Paper No. 33. Rome, Italy: Food and Agriculture Organization of the United Nations.
Edalat, M., Ghadiri, H., & Zand Parsa, S. (2009). Corn crop water stress index under different redroot pigweed (Amaranthus retroflexus L.) densities and irrigation regimes. Archives of Agronomy and Soil Science, 56, 285-293.
Emekli, Y., Bastug, R., Buyuktas, D., & Emekli, N. Y. (2007). Evaluation of a crop water stress index for irrigation scheduling of bermudagrass. Agricultural Water Management, 90, 205–212.
Gardner, B. R., Nielsen, D. C., & Shock, C. C. (1992). Infrared thermometry and the crop water stress index. II. Sampling procedures and interpretation. Journal of Production Agriculture, 5, 466–475.
Garrot, D. J., & Mancino, C. F. (1994). Consumptive water use of three intensively managed bermudagrasses growing under arid conditions. Crop Science, 34, 215–221. Grimes, D. W., Yamada, H., & Hughes, S.W. (1987).
Climate-normalized cotton leaf water potentials for irrigation scheduling. Agricultural Water Management, 12, 293-304. Grimes, D. W., Yamada, H., & Hughes, S. W. (1987). Climate
normalized cotton leaf water potentials for irrigation scheduling. Agricultural Water Management, 12, 293–304. Heydari, A., Bijanzadeh, E., Naderi, R., & Emam, Y. (2015).
Effect of late season drought stress and salicylic acid on canopy temperature, yield and yield components of two rapeseed cultivars. Crop Physiology Journal, 27, 37-53. Idso, S. B., Jackson, R. D., Pinter, J. R., Reginato, R. J., &
Hatfield, J. L. (1981). Normalizing the stress-degree-day parameter for environmental variability. Agriculture Meteorology, 24, 45–55.
Idso, S. B., & Reginato, R. J. (1982). Soil and atmosphere-induced plant water stress in cotton as inferred from foliage temperatures. Water Resource Research, 18, 1143-1148.
Jackson, R. D. (1982). Canopy temperature and crop water stress index. Advance Irrigation. Vol. 1. Academic Press, New York, pp. 43–85
Jackson, R. D., Idso, R. B., Reginato, R. J., & Pinter, P. J. (1981). Canopy temperature as a crop water stress indicator. Water Resource Research, 17, 1133–1138.
Jalali-Farahani, H. R., Slack, D. C., Kopec, D. M., & Matthias, A. D. (1993). Crop water-stress index models for bermudagrass turf. Agronomy Journal, 85, 1210–1217. Karcher, D. E. & Richardson, M. D. (2003). Quantifying
turfgrass color using digital image analysis. Crop Science, 43, 943–951.
Miri, H., & Rahimi,Y. (2009). Effects of combined and separate herbicide application on rapeseed and its weeds in southern Iran. International Journal of Agriculture Biology, 11, 257-260.
Monteith, J. L., & Unsworth, M. H. (1990). Principles of environmental physics. London: Edward Arnold.
Naderi, R., & Ghadiri, H. (2011). Competition of wild mustard (Sinapis arvense L.) densities with rapeseed (Brassica napus L.) under different levels of nitrogen fertilizer. Journal of Agriculture Science and Technology, 13, 45-51. Orta, A. H., Baser, I., Sehirali, S., Erdem, T., & Erdem, Y.
(2004). Use of infrared thermometry for developing baseline equations and scheduling irrigation in wheat. Cereal Research, 32, 363–370.
Orta, A. H., Erdem, T., & Erdem, Y. (2002). Determination of water stress index in sunflower. Helia, 25: 27-38.
Sneha, C., Santhoshkumar, A. V., & Sunil, K. M. (2013). Quantifying water stress using crop water stress index in mahogany (Swietenia macrophylla King) seedlings. Current Science, 104, 348- 51.
Stokcle, C. O., & Dugas, W. A. (1992). Evaluating canopy temperature-based indices for irrigation scheduling. Irrigation Science, 13, 31–37.
Wanjura, D. F., & Upchurch, D. R. (2000). Canopy temperature characterizations of corn and cotton water status. Transactions of the American Society of Agricultural Engineers, 43, 867-875.
Wilde, S. A., & Voigt, G. K. (1977). Munsell color chart for plant tissues. Munsel Color, Gretagmacbeth (1sted.). New
Windsor, New York.
هﺪﯿﮑﭼ -ﻪﯾﺎﺳ يﺎﻣد زا هدﺎﻔﺘﺳا ﻞﯿﺴﻧﺎﺘﭘ ﻪﮐ ﯽﻧﺎﻣز زا كﺎﺧ ﺖﺑﻮﻃر و زاﺪﻧا -ﻪﯾﺎﺳ يﺎﻣد ﻦﯿﺑ ﻪﻄﺑار زاﺪﻧا ﯽﮑﺸﺧ ﺶﻨﺗ زا ﯽﺼﺧﺎﺷ ﮏﯾ ناﻮﻨﻋ ﻪﺑ ﺪﺷ ﯽﯾﺎﺳﺎﻨﺷ ﻢﻬﻣ رﺎﯿﺴﺑ هﺪﺷ ﺖﺳا . ﮏﯾ ﻪﻋرﺰﻣ ﺶﯾﺎﻣزآ رد يا ﯽﻋارز لﺎﺳ 1392 -1393 رد ﯽﻋارز هﺎﯿﮔ ﯽﮑﺸﺧ ﺶﻨﺗ ﺺﺧﺎﺷ ﻪﺒﺳﺎﺤﻣ ياﺮﺑ ناﺮﯾا ،زاﺮﯿﺷ هﺎﮕﺸﻧاد رد رآ ﻞﻣﺎﺷ ﯽﻨﻏور ياﺰﻠﮐ ﻢﻗر ود ﯽﺟ يرﺎﺳ و سا ﻢﯾژر .ﺪﺷ اﺮﺟا ﻞﮔ بﻮﻠﻄﻣ يرﺎﯿﺑآ ﻞﻣﺎﺷ يرﺎﯿﺑآ يﺎﻫ ﺎﺑ ﺮﺑاﺮﺑ يرﺎﯿﺑآ ) 100 رﺰﻣ ﺖﯿﻓﺮﻇ % ) ﻢﯾﻼﻣ ﯽﮑﺸﺧ ﺶﻨﺗ ،(ﻪﻋ 75 ﺪﯾﺪﺷ ﯽﮑﺸﺧ ﺶﻨﺗ ،(ﻪﻋرﺰﻣ ﺖﯿﻓﺮﻇ % ) 50 ) ﺪﯾﺪﺷ ﯽﻠﯿﺧ ﯽﮑﺸﺧ ﺶﻨﺗ و (ﻪﻋرﺰﻣ ﺖﯿﻓﺮﻇ % 25 ﺐﻟﺎﻗ رد ﻪﮐ ﺪﻧدﻮﺑ (ﻪﻋرﺰﻣ ﺖﯿﻓﺮﻇ % ﮏﯾ حﺮﻃ رآ ﻢﻗر رد .ﺪﺷ اﺮﺟا ﯽﻓدﺎﺼﺗ ﻞﻣﺎﮐ كﻮﻠﺑ ﯽﺟ هﺎﻣ زا ﯽﻋارز هﺎﯿﮔ ﯽﮑﺸﺧ ﺶﻨﺗ ﺺﺧﺎﺷ راﺪﻘﻣ ،سا ) ﻦﯾدروﺮﻓ 066 / 0 ﻣ ﺮﯿﺗ ﺎﺗ (بﻮﻠﻄﻣ يرﺎﯿﺑآ رد ) هﺎ 711 / 0 ﺖﺷاد ﯽﺸﯾاﺰﻓا ﺪﻧور (ﺪﯾﺪﺷ ﯽﮑﺸﺧ ﺶﻨﺗ رد ﻪﯾﺎﺳ يﺎﻣد توﺎﻔﺗ ﺶﯾاﺰﻓا و بآ رﺎﺨﺑ رﺎﺸﻓ دﻮﺒﻤﮐ ندﻮﺑ ﺮﺗﻻﺎﺑ نآ ﻞﯿﻟد ﻪﮐ .دﻮﺑ ﺮﻔﺴﻤﺗا ياﻮﻫ و زاﺪﻧا يرﺎﺳ ﻢﻗر رد ﯽﻬﺑﺎﺸﻣ ﺪﻧور ﻦﯿﻨﭼ ﺎﺗ ﻦﯾدروﺮﻓ زا اﻮﻫ يﺎﻣد ﻪﮑﯿﻧﺎﻣز ﻢﻗر ود ﺮﻫ رد .ﺪﺷ هﺪﻫﺎﺸﻣ ﺰﯿﻧ ﻞﮔ يﺎﻣد توﺎﻔﺗ ﺖﻓﺎﯾ ﺶﯾاﺰﻓا ﺮﯿﺗ ﻪﯾﺎﺳ ﺶﻨﺗ ﺺﺧﺎﺷ ﻪﻧﺎﯿﻫﺎﻣ راﺪﻘﻣ ﻦﯾﺮﺗﻻﺎﺑ و ﺖﻓﺎﯾ ﺶﯾاﺰﻓا اﻮﻫ ﺎﺑ زاﺪﻧا رﺎﻤﯿﺗ ﻪﻤﻫ ياﺮﺑ ﯽﻋارز هﺎﯿﮔ ﯽﮑﺸﺧ ناﺰﯿﻣ ،ﯽﮑﺸﺧ ﺶﻨﺗ ﺶﯾاﺰﻓا ﺎﺑ .ﺪﻣآ ﺖﺳﺪﺑ هﺎﻣ ﺮﯿﺗ رد ﺎﻫ هﺮﻤﻧ ﻪﺟرد ﺪﻨﺑ ي ﮓﻧر هﺪﻨﻫد نﺎﺸﻧ ﻪﮐ هﺎﯿﮔ ﮓﻧر ﺖﯿﻔﯿﮐ ﺖﺳا زا ﺖﻋﺮﺳ ﻪﺑ 6 ﻪﺑ 3 دﺪﻋ رد و ﺖﻓﺎﯾ ﺶﻫﺎﮐ 2 هﺎﻣ رد ) لﻮﺒﻗ ﻞﺑﺎﻗ ﮓﻧر ﺖﯿﻔﯿﮐ ﮏﯾ ﻢﯾﻼﻣ ﯽﮑﺸﺧ ﺶﻨﺗ رﺎﻤﯿﺗ رد .ﺪﻧﺎﻣ ﯽﻗﺎﺑ ﺖﺑﺎﺛ ﺮﯿﺗ و دادﺮﺧ يﺎﻫ ﺎﺑ هﺮﻤﻧ ﻪﺟرد ﺪﻨﺑ ي ﮓﻧر 5 ﺎﺗ 6 ﺶﻨﺗ ﺺﺧﺎﺷ ﻦﯿﺑ ﯽﻔﻨﻣ ﻪﻄﺑار ﮏﯾ ﻦﯿﻨﭽﻤﻫ .ﺪﻣآ ﺖﺳﺪﺑ هﺎﻣ دادﺮﺧ رد ( هﺎﯿﮔ ﮓﻧر ﺖﯿﻔﯿﮐ ﺎﺑ ﯽﻋارز هﺎﯿﮔ ﯽﮑﺸﺧ
(R2=0.94**)
اﺰﻠﮐ دﺮﮑﻠﻤﻋ و
(R2= 0.97**)
.ﺪﻣآ ﺖﺳﺪﺑ ﯽﻣ ﯽﻣ ﻢﯾﻼﻣ ﯽﮑﺸﺧ ﺶﻨﺗ ،ﮏﺸﺧ ﻪﻤﯿﻧ ﯽﺣاﻮﻧ رد ﺖﻓﺮﮔ ﻪﺠﯿﺘﻧ ناﻮﺗ ﺪﻧاﻮﺗ ﺖﯿﻔﯿﮐ نداد ﺖﺳد زا نوﺪﺑ اﺰﻠﮐ رد ﮓﻧر اﺰﻠﮐ رد ﯽﮑﺸﺧ ﺶﻨﺗ ﺺﺧﺎﺷ ﯽﻠﺼﻓ ﻦﯿﮕﻧﺎﯿﻣ ﻪﮐ ﯽﺘﻗو ﺪﺷﺎﺑ اﺰﻠﮐ ﺪﯿﻟﻮﺗ ياﺮﺑ ﻪﻨﯾﺰﮔ ﻦﯾﺮﺘﻬﺑ ﻦﯿﺑ يا ﻪﻨﻣاد رد 198 / 0 ﺎﺗ 294 / 0 .ﺪﺷﺎﺑ ﻪﻟﺎﻘﻣ تﺎﻋﻼﻃا :ﻪﻟﺎﻘﻣ ﻪﭽﺨﯾرﺎﺗ :ﺖﻓﺎﯾرد ﺦﯾرﺎﺗ 2 / 8 / 1395 :شﺮﯾﺬﭘ ﺦﯾرﺎﺗ 10 / 11 / 1395 :ﯽﺳﺮﺘﺳد ﺦﯾرﺎﺗ 28 / 5 / 1398 هژاو :يﺪﯿﻠﮐ يﺎﻫ زاﺪﻧا ﻪﯾﺎﺳ يﺎﻣد ﮓﻧر ﺖﯿﻔﯿﮐ ﯽﮑﺸﺧ ﺶﻨﺗ يرﺎﯿﺑآ ﻪﻣﺎﻧﺮﺑ ) ناﺮﯾا يزروﺎﺸﮐ تﺎﻘﯿﻘﺤﺗ 1398 ( 38 ) 1 ( 1 -8