* Corresponding author: [email protected] ©2013 Progress in Biological Sciences
Normalization of qPCR array data: a novel method based on
procrustes superimposition
Ali Mohammadian1, *, Mohammad Reza Nourani2, Seyed Javad Mowla3,Mahmood Tavallaei4, Yu Liang5
1Department of Biotechnology, College of Science, University of Tehran, Tehran, Iran. 2Chemical Injury Research Center, Baqiatallah Medical Sciences University, Tehran, Iran. 3Molecular Genetics Department, Faculty of Biological Sciences, Tarbiat Modares University, Tehran, Iran.
4Human Genetic Research Center, Baqiatallah Medical Sciences University, Tehran, Iran. 5Division of Molecular Medicine, Life Technologies, Foster City, CA 94404, USA.
Received: October 30, 2012; Accepted: January 15, 2013
Abstract
MicroRNAs (miRNAs) are short, endogenous non-coding RNAs that function as guide molecules to regulate transcription of their target messenger RNAs. Several methods including low-density qPCR arrays are being increasingly used to profile the expression of these molecules in a variety of different biological conditions. Reliable analysis of expression profiles demands removal of technical variations in data, which is achieved via applying normalization techniques. Most normalization techniques have been developed for mRNA microarrays and new and modified methods should be used for miRNA studies in general and RT-qPCR miRNA arrays in particular, because of low number of miRNAs. Here, we introduce a new method based on Procrustes superimposition of arrays to be normalized on a reference array. To assess the performance of our normalization method, we compared this method to the common miRNA normalization methods. Removal of technical variation was assessed by robust modeling of mean square error (MSE) in different subsets of real miRNA datasets before and after applying normalization. We show that our method outperforms the other normalization methods in concurrent reduction of technical variation and retention of biological variability.
Keywords:miRNA, Low-density qPCR array, Normalization, Procrustes superimposition
Introduction
MicroRNAs (miRNAs) are small inhibitory endogenous RNAs. They regulate target mRNAs through repressing translation or promoting mRNA degradation(1, 2). These tiny molecules control a variety of cellular processes, and possess promising diagnostic and therapeutic potentials(3). Their small length and high inter-molecular similarities has not impeded the use of high-throughput profiling technologies to unravel their roles in a variety of biological milieus. Microarrays(4), low density qPCR arrays(5), bead based flow cytometry assay(6), and next generation sequencing techniques(7) have all been successfully applied to profile expression of these
molecules. Like other RNA species, qPCR based methods are superior to other methods in terms of accuracy and sensitivity for the quantification of miRNAs(8).
normalization techniques have also been applied to normalize qPCR array data(11). Due to the low number of miRNAs, the assumptions underlying mRNA normalization methods can be easily violated. This may lead to introduction of inaccuracy in high-throughput miRNA data. Each miRNA may target some hundreds of mRNAs, and misclassifying a single miRNA as (non-) differentially expressed is equivalent to wrong classification of all its targets. Therefore, the removal of experimental error and retention of true biological signal are essential requirements in miRNA profiling studies. Further, to achieve a more precise analysis of differential gene analysis, proper removal of experimental error and retention of biological variation is necessary. Novel normalization methods are needed to increase the precision and accuracy of high-throughput miRNA qPCR array data.
Herein we propose a novel normalization method based on Procrustes superimposition, and assess its power to remove experimental error in miRNA qPCR data. Procrustes superimposition uses translation, rotation, and scaling of data to find the closest match between two configurations. Generalized Procrustes analysis (GPA) has been recently used for single and double channel arrays(12, 13). Here we introduce a novel method based on Procrustes superimposition (PS). Our proposed method is applicable to both single- and double channel array data. We assess the performance of PS normalization method against common normalization methods for miRNA qPCR arrays. Our analysis is based on the reduction of experimental error by using mean squared error (MSE) criterion(4) and retention of signal-to-noise ratio(14) in different subsets of a real miRNA dataset.
Materials and methods
Datasets
The miRNA expression profile of 40 human tissues was used as dataset A. This dataset contained four replicates per tissue(5). The experiments had been performed on TaqMan®
microRNA platform to provide the miRNA signature of different tissues. To assess different normalization methods, three different subsets of this dataset were used in addition to dataset A, as
follows. Two tissues with the highest degree of differentially expressed miRNAs (peripheral blood mononuclear cells (PBMC) and placenta) were used as dataset B. More than 75% of miRNAs were differentially expressed between these tissues in raw data. The remaining 38 tissues from the original dataset were used as dataset C. Finally, four biologically-related tissues, left and right ventricles and left and right atria, which also have comparable miRNA expression patterns, were used as dataset D.
Common methods for mirna high-throughput data normalization
The method proposed by Metsdagh (Mts), subtracts mean Cq value of a sample from Cq values of miRNAs in the sample to find the normalized Cq values(9). In the method proposed by Pradervand (Prd), the differences in background levels are optionally removed. Then, the dependence of standard deviation on mean of expression values in all samples is removed, and a set of low standard deviation miRNAs that have high expressions (the invariant set) is determined by a mixture model across all samples. Normalization coefficients are computed by a robust regression method (an M estimator with Huber influence function) and are used to scale the data(15). This method has been developed for miRNA microarrays, and to apply this method to qPCR array data, we replaced Cq values with 40-Cq, performed the normalization and reverted normalized data back (40- normalized Cq) (Personal communication with S. Pradervand). Quantile normalization first sorts Cq values in each sample. Then a baseline array is then created by taking the mean of Cq values in each rank across samples. In the next step, original values in each sample are replaced by values of the baseline array. Then each sample Cq values are sorted back to their original order. This normalization makes all samples share a single distribution of Cq values.
Assessing removal of error
performance of different normalization methods. As true (theoretical) Cq values are unknown in our datasets, we robustly modeled MSE. Briefly, miRNAs were ranked according to their average Cq values in duplicate samples and sorted into groups of thirty miRNAs (17). Differences in duplicate Cq values in each group (diffi,b, 1<i<30, and 1<b<number of groups) were obtained. Subsequently, median (med(diffi,b)) and median absolute deviation of diffi,b (MAD(diffi,b), equation (a)) were calculated.
, , ,
( i b) i b ( i b)
MAD diff med diff med diff (a)
In the next step, med(diffi,b) andMAD(diffi,b) were modeled as smooth functions of Cq values. Weighted smoothing spline (function “smooth.spline” from stats package, R language, equation b), and smoothing splines with the smoothing parameter selected by generalized maximum likelihood (function “ssanova0”, package gss, R language, equation c) were used to model med (diffi,b) andMAD(diffi,b) respectively. Weights used for “smooth.spline” were equal to the reciprocal of the squared MAD of difference for each group.
, , 1,
med(diffi b)η (Cqmed b)
b(b), , 2,
MAD(diffi b)ξ (Cqmed b)
b(c)Here and represent the smoothed functions.bandb denote the errors of estimations (4)Now, MSE can be estimated as follows:
, 2 2
,
ˆξ ( )
ˆ
( ) η ( )
0.6745
med i
med i
Cq
MSE Cq (d)
Where the factor 0.6745 in the denumerator is used as the mathematical expectation of MAD in normal distribution is 0.6745 σ. Estimates in eqauation (d) were obtained for 100 different points. Fitted functions (equations (b) and (c)) were used to obtain estimated values for these points. These points were chosen to be between minimum and maximum Cq values of two replicates.
The R code for binning and calculating MSE may be requested from first author. The first term in equation (d) is the smoothed variance and the second one is the smoothed squared bias,
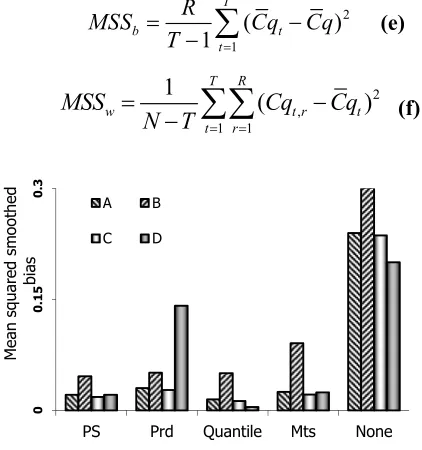
demonstrating precision and accuracy in differences of Cq values, respectively. Lower values of bias and variance and indicate a superior normalization method, and best normalization would be the one that leads to unbiased Cq values with the lowest MSE value. Bias and variance components were calculated for each bin in each tissue and average values of bias (Fig. 1), variance (not shown) and MSE (Fig. 2) in each dataset after applying different normalization methods was used to obtain a global view of the performance of normalization methods.
To assess whether normalization methods do not reduce biological variability along with reducing
MSE, we obtained mean sum of squares (MSS) of each miRNA between tissues (MSSb, equation e) and MSS of each miRNA within tissues (MSSw, equation f) for each normalization technique(14).
(e)
(f)
Where R is the number of replicates, T the number of groups (tissues),
Cq
the mean expression value for ith miRNA across all experiments, ̅the mean expression value of ith miRNA in tissue
t, Cqt r, the expression in rth replicate of tissue T.
For each miRNA, MSSb is a measure of variability between tissues, and MSSw a measure of variability within tissues, and a good normalization method should reduce MSSw.
0
0.15
0.3
PS Prd Quantile Mts None
Mean
squared sm
oot
hed
bias
A B
C D
2
1
( ) ( )
1
T
b t
t
R
MSS Cq Cq e
T
2 ,
1 1
1
(
)
( )
T R
w t r t
t r
MSS
Cq
Cq
f
N T
Density curves of MSSb and MSSw curves of dataset A after different normalizations are shown in Figure3.
Results and Discussion
We first describe our own developed normalization method. Then we turn to analysis of reduction of errors and
Novel normalizationmethod
Consider an m×s expression matrix containing m
miRNAs in s samples, so that the jth column, 0≤j≤s, in this matrix represents the Cq values of miRNAs present in the jth sample in the study. Cq values of each column are sorted to create a sorted expression matrix (S). An m-dimensional “baseline vector” is created from S as follows.
The ith value of this vector is equal to the mean (or
alternatively median) value of ith row of
S, with 0≤i≤m. In the next step, S is split to s column vectors. Then all sample vectors in addition to the baseline vector are merged with a new
m-dimensional vector to create s+1 matrices of m×2. The added column lists the ranks of Cq values in each sample. Now, a PS, a PS without rotation, or a partial PS can superimpose each of sample matrices on the reference matrix. The PS normalization method was implemented in R (v2.15.3, www.r-project.org), a statistical scripting language, and is available on request.
Reduction of bias, variance and MSE
For datasets A-D, mean squared smoothed bias values before and after normalization are shown in Figure 1. Smaller values of squared bias denote increased accuracy in data. Normalization methods tested here increased the accuracy in difference of Cq values of replicate samples, i.e. shifted the center of distribution of these values toward zero. Quantile normalization led to the largest decrease in bias, and PS followed quantile normalization, The performance of different normalization methods in reduction of variance component of MSE is depicted in Figure 2. Compared to squared bias term, the variance term of MSE is not much affected by applying normalization methods, and the general trend in reduction of MSE closely follows the trend for bias. Quantile normalization is an exception to this observation, as it increases variance. The increase in variance in data means broader distribution, and set of Cq values with lower precision. PS normalization, on the other hand,
0
0.5
1
1.5
PS Prd Quantile Mts None
Ave
rage smooth
ed
MAD
A B C D
Figure 2. Average smoothed MAD in different datasets and after different normalizations.
-2.5
-1.5
-0
.5
0.5
Ileum Duode
num
Distal Co
lon
Trac
hea
Pericardi
um
Left Ven
tricle
Right Ve
ntricle
Thyroid Lymph No
de
Breast Adipo
se
Brain Heart Spleen Ovary Skel
etal Muscl
e
Colon Bladder Adren
al
PBMC
Rel
ativ
e
mean
MSE
per tis
sue
Mts Quantiles Prd PS
decreased variance.
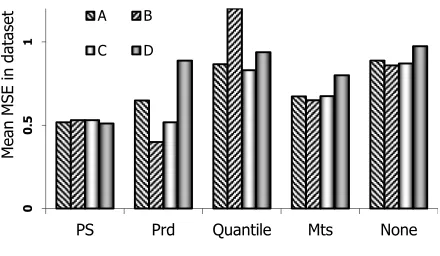
The efficacy of different methods in reducing MSE
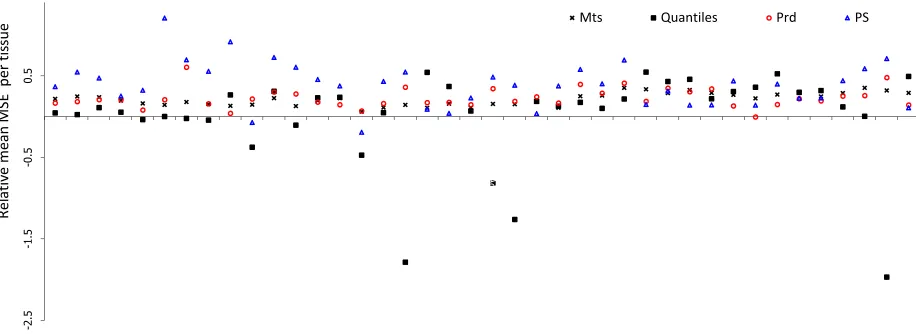
is shown in Figure4. The best method is PS, except for Prd in subset B. PS is often the most efficient method in reducing MSE in replicate experiments. Estimated MSE, estimates the difference between true and obtained values. Generally, when the bias is lower than original dataset, lower values of MSE indicate less error in data and better normalization. Although quantile normalization led to the least biased data, the lowering caused increased variance up to the point that MSE is increased. Disregarding quantile normalization because of increase in MSE, PS is the method with the least bias and lowest MSE, and is regarded the best method tested here. Mean MSE value for each of the original 40 tissue after normalizing dataset A is depicted in Figure 3. PS also performs acceptably in most tissues and frequently leads to the least MSE. It should be noted that expression data are used for differential gene expression identification and subsequent downstream analyses. Introduction of error in any Cq value of any one tissue, negatively affect the differential expression analysis for that specific miRNA between the tissue and all other tissues.
Retention of signal-to-noise ratio
Density curves of MSSb and MSSw for dataset A after different normalizations are shown in Figure3. MSSb, which indicates the variability of miRNAs between different tissues, is not reduced after PS normalization, while MSSw, the variability of miRNAs within replicate samples,is
lowered by PS normalization, as the peak can be seen to shift to lower values (Fig.3). The effect of normalization on the ratio of MSSb to MSSw should ideally leads to identification of only the true differentially regulated miRNAs, the knowledge of which is not accessible in this dataset. As we are testing whether biological variability is maintained after normalizations, we expect that MSSb does not decrease for miRNAs. It can be concluded that our method does not reduce MSE by simply removing the difference between all pairs of arrays, and can be applied to miRNA qPCR data.
An acceptable normalization method is expected to perform acceptably on data with different structures. It should lead to removal of technical variation, maintain the differences between different biological groups and reduce the differences within each biological group in different types of expression data. Subsets of data we chose to normalize were different in nature: dataset D contained highly similar tissues with similar expression profiles whereas dataset B tissues showed differential expression in majority of genes. Dataset B contained only two tissues in contrast to 40 tissues of dataset A, and dataset C contained more homogenous collection of tissues in comparison of dataset A.
Here we proposed a method that uses Procrustes superimposition to remove experimental error in high-throughput qPCR data. Our method successfully reduces technical variation and other non-biological sources of variation in datasets with either highly similar or highly different tissues. PS normalization led to highest decrease in MSE values in 3 of 4 datasets we tested, and retained the variability between tissues. PS can be considered as a novel method to normalize qPCR data.
References
1. Bartel,D.P. (2004) MicroRNAs: genomics, biogenesis, mechanism, and function. Cell, 116, 281–97.
2. Friedman,R.C., Farh,K.K.-H., Burge,C.B. and Bartel,D.P. (2009) Most mammalian mRNAs are conserved targets of microRNAs. Genome Res., 19, 92–105.
3. De Planell-Saguer,M. and Rodicio,M.C. (2011) Analytical aspects of microRNA in diagnostics: a review. Anal Chim Acta, 699, 134–52.
0
0.5
1
PS Prd Quantile Mts None
Mean
MSE in
dataset
A B
C D
4. Rao,Y., Lee,Y., Jarjoura,D., Ruppert,A.S., Liu,C.-G., Hsu,J.C. and Hagan,J.P. (2008) A comparison of normalization techniques for microRNA microarray data.
Stat Appl Genet Mol Biol., 7, Article22.
5. Liang,Y., Ridzon,D., Wong,L. and Chen,C. (2007) Characterization of microRNA expression profiles in normal human tissues. BMC Genomics, 8, 166.
6. Lu,J., Getz,G., Miska,E.A., Alvarez-Saavedra,E., Lamb,J., Peck,D., Sweet-Cordero,A., Ebert,B.L., Mak,R.H., Ferrando,A.A., et al. (2005) MicroRNA expression profiles classify human cancers. Nature, 435, 834–8.
7. Buermans,H.P.J., Ariyurek,Y., van Ommen,G., den Dunnen,J.T. and ’t Hoen,P.A.C. (2010) New methods for next generation sequencing based microRNA expression profiling. BMC Genomics, 11, 716.
8. Git,A., Dvinge,H., Salmon-Divon,M., Osborne,M., Kutter,C., Hadfield,J., Bertone,P. and Caldas,C. (2010) Systematic comparison of microarray profiling, real-time PCR, and next-generation sequencing technologies for measuring differential microRNA expression. RNA, 16, 991– 1006.
9. Mestdagh,P., Van Vlierberghe,P., De Weer,A., Muth,D., Westermann,F., Speleman,F. and Vandesompele,J. (2009) A novel and universal method for microRNA RT-qPCR data normalization. Genome Biol, 10, R64.
10. Meyer,S.U., Pfaffl,M.W. and Ulbrich,S.E. (2010) Normalization strategies for microRNA profiling experiments: a “normal” way to a hidden layer of complexity? Biotechnol Lett, 32, 1777–88.
11. Carlsson,J., Davidsson,S., Helenius,G., Karlsson,M., Lubovac,Z., Andrén,O., Olsson,B. and Klinga-Levan,K. (2011) A miRNA expression signature that separates between normal and malignant prostate tissues. Cancer Cell Int, 11, 14.
12. Meyer,S.U., Kaiser,S., Wagner,C., Thirion,C. and Pfaffl,M.W. (2012) Profound effect of profiling platform and normalization strategy on detection of differentially expressed microRNAs--a comparative study. PLoS One, 7, e38946.
13. Xiong,H., Zhang,D., Martyniuk,C.J., Trudeau,V.L. and Xia,X. (2008) Using generalized procrustes analysis (GPA) for normalization of cDNA microarray data. BMC Bioinformatics, 9, 25.
14. Schmid,R., Baum,P., Ittrich,C., Fundel-Clemens,K., Huber,W., Brors,B., Eils,R., Weith,A., Mennerich,D. and Quast,K. (2010) Comparison of normalization methods for Illumina BeadChip HumanHT-12 v3. BMC Genomics, 11, 349.