Prognostic Nutritional Index as an
independent prognostic factor in
locoregionally advanced squamous cell
head and neck cancer
Gema Bruixola,1 Javier Caballero,2 Federica Papaccio,1 Angelica Petrillo,1 Aina Iranzo,1 Miguel Civera,3 Miriam Moriana,3 Neus Bosch,3 Maria Maroñas,4 Ines González,1 Miguel Pastor,2 Andrés Cervantes1
To cite: Bruixola G, Caballero J, Papaccio F, et al. Prognostic Nutritional Index as an independent prognostic factor in locoregionally advanced squamous cell head and neck cancer. ESMO Open 2018;3:e000425. doi:10.1136/ esmoopen-2018-000425
Received 19 July 2018 Revised 20 August 2018 Accepted 22 August 2018
1CIBERONC- Medical Oncology Department Biomedical Research Institute-INCLIVA - Hospital Clínico Universitario, University of Valencia, Valencia, Spain
2Medical Oncology Department, Hospital Universitari i Politècnic La Fe, Valencia, Spain 3Endocrinology and Nutrition Department, Hospital Clínico Universitario de Valencia, Valencia, Spain 4Radiation Oncology Department, Hospital Clínico Universitario de Valencia, Valencia, Spain
Correspondence to Professor Andrés Cervantes; andres. cervantes@ uv. es ► https:// doi. org/ 10. 1136/
esmoopen- 2018- 000449 © Author (s) (or their employer(s)) 2018. Re-use permitted under CC BY-NC. No commercial re-use. Published by BMJ on behalf of the European Society for Medical Oncology.
Key questions
What is already known about this subject?
► The main prognostic factors in head and neck squa-mous cell carcinoma are stage, site of disease and comorbidities.
► In the last decade, human papillomavirus has been identified as a common cause of and important prognostic factor in oropharyngeal cancer, confer-ring a better prognosis.
► In addition, systemic inflammation and nutritional status also play an important role in this disease. In many cancer types
► However, improvement in prognostic and predictive factors in head and neck squamous cell carcinoma is still a need not met at present.
What does this study add?
► The Prognostic Nutritional Index is an independent prognostic factor for locally advanced head and neck squamous cell carcinoma.
How might this impact on clinical practice?
► The Prognostic Nutritional Index may aid clinical decision making in locally advanced head and neck squamous cell carcinoma.
► The following are the main advantages stemming from the incorporation of the Prognostic Nutritional Index into the prognostic assessment of patients with locally advanced head and neck squamous cell cancer: (1) it is a surrogate marker of both systemic inflammation and nutritional status, and is robust, reproducible, inexpensive and universally available; and (2) it is a stage-independent trait, so it could be complementary to traditional prognostic factors without competing with them.
AbstrAct
Background Locally advanced head and neck squamous cell carcinoma (LAHNSCC) is a heterogeneous disease in which better predictive and prognostic factors are needed. Apart from TNM stage, both systemic inflammation and poor nutritional status have a negative impact on survival. Methods We retrospectively analysed two independent cohorts of a total of 145 patients with LAHNSCC treated with induction chemotherapy followed by concurrent chemoradiotherapy at two different academic institutions. Full clinical data, including the Prognostic Nutritional Index (PNI), neutrophil to lymphocyte ratio and derived neutrophil to lymphocyte ratio, were analysed in a training cohort of 50 patients. Receiver operating characteristic curve analysis was used to establish optimal cut-off. Univariate and multivariate analyses of prognostic factors for overall survival (OS) were performed. Independent predictors of OS identified in multivariate analysis were confirmed in a validation cohort of 95 patients.
Results In the univariate analysis, low PNI (PNI<45) (p=0.001), large primary tumour (T4) (p=0.044) and advanced lymph node disease (N2b-N3) (p=0.025) were significantly associated with poorer OS in the validation cohort. The independent prognostic factors in the multivariate analysis for OS identified in the training cohort were dRNL (p=0.030) and PNI (p=0.042). In the validation cohort, only the PNI remained as independent prognostic factor (p=0.007).
Conclusions PNI is a readily available, independent prognostic biomarker for OS in LAHNSCC. Adding PNI to tumour staging could improve individual risk stratification of patients with LAHNSCC in future clinical trials.
IntRoduCtIon
Head and neck squamous cell carcinoma (HNSCC) includes a heterogeneous group of tumours that originate in different struc-tures of this region, such as as the oral cavity, oropharynx, hypopharynx and larynx. Inflam-mation plays an important role in the carcino-genesis of HNSCC, whether induced by the chronic action of chemical carcinogens, such as alcohol and tobacco,1–4 or by the chronic
infection of oncogenic viruses, especially the human papillomavirus (HPV).5–8
Furthermore, evaluation of the nutri-tional status of patients with locally advanced head and neck squamous cell carcinoma (LAHNSCC) before treatment is considered mandatory for their proper management.9 In
on September 12, 2020 by guest. Protected by copyright.
fact, between 42% and 77% of patients with LAHNSCC present a high risk of malnutrition at diagnosis. In these patients, malnutrition has a multifactorial origin, due to problems with chewing and swallowing secondary to the disease itself, treatment-related toxicity, and malnutri-tion in relamalnutri-tion to alcohol abuse.10 Therefore, a complete nutritional assessment is essential since it has been shown that nutritional impairment has a negative impact on clin-ical outcomes.11–13 It is worth noting that the presence of an inflammatory response may contribute to the develop-ment of cancer-associated malnutrition.14
The Prognostic Nutritional Index (PNI), calculated as previously described,15 may be especially useful due to its role as a surrogate marker of both inflammation and nutritional status. This index was originally studied to demonstrate the relation with postoperative compli-cations and prognosis for patients affected by oesopha-geal carcinoma.16 A low PNI level has been subsequently correlated with a worse outcome in patients with hepa-tocellular carcinoma,17 18 lung cancer,19 bladder cancer20 and other solid tumours. As regards HNSCC a low PNI has been shown to be a predictor of poor survival,21 and it has been associated with severe radiotherapy-induced adverse events in a small series of patients.22 In addition, there is increasing evidence supporting the role of neutro-phils in tumour promotion, inflammation and immuno-suppression associated with tumours.23 On these bases, haematological biomarkers linked with inflammation, like the neutrophil to lymphocyte ratio (NLR)24 and the derived neutrophil to lymphocyte ratio (dNLR),25 have been developed and have shown their prognostic value in several solid tumours. However, data on the application of the aforementioned models in LAHNSCC are scarce.
The aim of the present study was to investigate in a training cohort and to confirm in an independent valida-tion cohort the prognostic value of different haematolog-ical inflammation-based prognostic scoring systems such as the PNI and the NLR and their correlation with overall survival (OS) in patients with LAHNSCC.
PatIents and MetHods study design
We conducted a retrospective review of the electronic patient records (EPR) of all patients with HNSCC treated by the Medical Oncology Department at two institu-tions—Hospital Universitari I Politècnic La Fe (HLF) and Hospital Clínico Universitario (HCU)—between May 2010 and May 2016 in order to produce a training set and a validation set of data, respectively.
All patients received the same scheme of induction chemotherapy (ICT) with cisplatin-5 fluorouracil and docetaxel. All patients received three-dimensional external radiotherapy. The concurrent chemotherapy regimen was either cisplatin 100 mg/m2 every 21 days, cisplatin 40 mg/m2 weekly or cetuximab 400 mg as loading dose with subsequent weekly 250 mg/m2 following inves-tigator criteria.
Patients and variables
All patients included should have had histologically confirmed LAHNSCC and have started ICT followed by concurrent chemoradiotherapy with radical intention. Baseline patient clinical factors collected included age, sex, date of diagnosis, Eastern Cooperative Oncology Group Performance status (ECOG PS), complete blood count (including absolute neutrophil and lymphocyte counts) and biochemistry (including albumin), HPV (human papillomavirus)/p16 status, and staging of the tumour (according to the American Joint Committee on Cancer (AJCC) Cancer Staging Manual Seventh Edition).26
The NLR was calculated by dividing the baseline abso-lute peripheral neutrophil count (cells/mm3) by the absolute peripheral lymphocyte count (cells/mm3). The dNLR was defined as the quotient of the baseline absolute peripheral neutrophil count (cells/mm3) by the differ-ence between the absolute baseline peripheral leucocyte count (cells/mm3) less the absolute baseline peripheral neutrophil count (cells/mm3).
The PNI was calculated as follows: 10 × baseline serum albumin (g/dL) + 0.005 × baseline absolute lymphocyte count (cells/mm3).
Patients with a history of inflammatory disease, an active concomitant infection, distant metastases at diag-nosis, history of malignancy in the past 5 years or without baseline blood test results available were excluded.
data collection
The EPR was reviewed for each patient, and all inter-esting data were retrieved in a joint database, properly encrypted and anonymised. Confidentiality of patients’ data was kept throughout the study.
statistical analysis
OS was calculated from the time of cancer diagnosis to death. Receiver operating characteristic (ROC) curve was used to determine the sensitivity and specificity similar-ities between the NLR, dNLR and PNI and to establish optimal thresholds for OS. The NLR, dNLR and PNI cut-off for OS prediction by ROC analysis were 2.6 (area under the curve, AUC=0.723), 1.7 (AUC=0.721) and 45 (AUC=0.695), respectively. These markers were analysed as categorical variables. Dichotomisation of these varia-bles was based on the identified optimal cut-off as indi-cated above.
Continuous variables were presented as median and range and categorical variables were presented as frequencies. The presence of significant associations between clinical-pathological variables was determined using Mann-Whitney, Kruskal-Wallis, Student’s t-test, χ2 or Fisher’s exact test as appropriate. Kaplan-Meier statis-tics and log-rank test were used to assess the impact of the different clinical factors associated with OS on univariate analysis. Univariate Cox regression was also performed with significant variables (p<0.05), being further tested on a univariate multivariate stepwise backward Cox
on September 12, 2020 by guest. Protected by copyright.
Table 1 Baseline characteristics of the 145 patients (training and validation sets)
Characteristics, n (%)
Training set (n=50)
Validation set (n=95)
Age (years), mean (range) 55 (41–59) 60 (43–77) ECOG PS
0 2 (4) 3 (3.2)
1 48 (96) 92 (96.8)
Sex
Male 42 (84) 90 (94.7)
Female 8 (16) 5 (5.3)
Tobacco habit
Yes 5 (10) 3 (8.6)
No 45 (90) 83 (91.6)
Unknown 5 (5.3)
Enolic habit
Yes 18 (36) 13 (37.1)
No 12 (24) 22 (69.1)
Unknown 20 (40 6 (6.3)
Primary tumour site
Oral cavity 15 (30) 33 (34.8) Oropharynx 12 (24) 15 (15.8) Larynx 14 (28) 36 (37.9) Hypopharynx 5 (10) 8 (8.4)
Other 4 (8) 3 (3.2)
T (TNM stage)
T1-T3 20 (40) 5 (36.8)
T4 30 (60) 56 (58.9)
N (TNM stage)
N0-N2a 22 (44) 39 (41.1) N2b-N3 28 (56) 56 (58.9) AJCC Cancer Staging System Seventh Edition
Stage III 8 (16) 18 (18.9) Stage IVA 41 (82) 61 (62.2) Stage IVB 1 (2) 16 (16.8) HPV/p16 status
Positive 2 (4) 6 (6.3)
Negative 8 (16) 39 (41.1) Unknown 40 (80) 50 (52.7) NLR
<2.6 23 (46) 50 (52.6)
≥2.6 27 (54) 45 (47.4)
dNLR
<1.7 24 (48) 50 (52.6) ≥1.7 26 (52) 45 (47.4) PNI
PNI-high (>45) 40 (80) 57 (60) PNI-low (<45) 10 (20) 31 (32.6)
Unknown – 7 (7.4)
AJCC, American Joint Committee on Cancer; ECOG PS, Eastern Cooperative Oncology Group Performance Status; HPV, human papillomavirus; NLR, neutrophil to lymphocyte ratio; PNI, Prognostic Nutritional Index; dNLR, derived neutrophil to lymphocyte ratio.
regression model to validate their independent prog-nostic value in the training test cohort. Variables with a p value greater than 0.10 were removed from the model.
We used Harrel’s concordance index (c-index) method to rank the different prognostic traits according to their predictive ability of discriminating patients according to OS. A c-index (0.5≤Harrel's c-index≤1) of 0.5 suggests no predictive discrimination power, while a c-index of 1.0 indicates perfect discriminatory power. c-Index was calcu-lated as previously described by Uno et al.27 The Akaike information criteria (AIC, lower is better) was used to assess relative goodness of fit. The ROC curve analysis was used to test the discriminative ability of the models. The model with the highest c-index and AUC and with the smallest AIC value was selected as the final model.
Independent prognostic factors identified by multivar-iate analysis in the training set (HLF) were further tested on the independent retrospective validation set from a separate cohort of patients (HCU) with similar clinical features.
For all analyses, the levels of statistical significance accepted were p<0.05. Statistical analyses were performed using SPSS V.20.0 package and R Statistical Computing Environment (R Foundation, Vienna, Austria).
Results
Patient characteristics
A total of 145 patients with LAHNSCC were included in this analysis. The training set consisted of 50 patients treated at HLF, whereas the validation set consisted of 95 patients treated at HCU.
The baseline characteristics of the training and valida-tion sets were generally well comparable and are reported in table 1. Most of the patients had ECOG PS=1. In both cohorts the majority of patients were men, around the fifth decade of life, with a history of tobacco use. Likewise, both in the training set and in the validation set, most of the patients presented with large primary tumours (T4) and advanced lymph node disease (N2b-N3), and were subsequently classified as stage IVA according to the TNM staging system of AJCC 2010 (seventh edition).26 The main differences between the two cohorts are a higher proportion of unknown HPV in the training cohort (80% vs 52.7%) and a higher proportion of PNI-low (20% vs 32.6%) in the validation set.
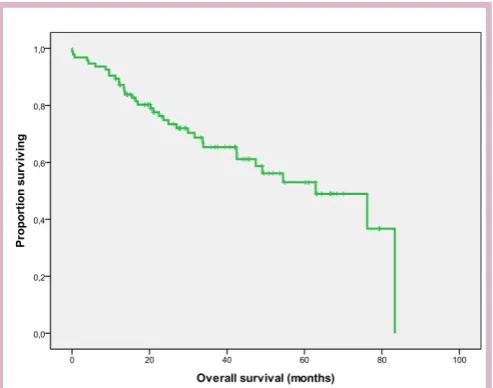
On analysis, 22 and 34 patients in the training and vali-dation sets, respectively, had died, with a median follow-up time of 21.5 months and 29.1 months, respectively. The median OS was 19 months in the training set, while it reached 62.9 months in the validation set. Kaplan-Meier plots of OS for both data sets are shown in (figures 1 and 2).
In the training set, the crude median PNI value was 42 (range: 28.1–62.1). Using ROC analysis, a value of 45 was selected as the optimal cut-off to dichotomise the PNI into two values, PNI-high versus PNI-low, reflecting an adequate versus impaired nutritional status, and
on September 12, 2020 by guest. Protected by copyright.
Figure 1 Kaplan-Meier overall survival (OS) curves in the training set (N=50).
Figure 2 Kaplan-Meier overall survival (OS) curve in the validation set (N=95).
consequently a low versus high risk of mortality (table 2). We also attempt to establish the optimal cut-off point for the analysis of a dichotomous NLR and a dichotomous dNLR and their link with OS by using ROC analysis. The highest sensitivity and specificity for predicting poor OS were met for NLR ≥2.6 and dNLR ≥1.7 and were there-fore selected as the optimal thresholds for these inflam-mation-based prognostic scores (IBP) in this scenario (table 2). We compared the accuracy of the PNI and other IBP (dNLR and NLR) in predicting OS using ROC curve analysis, c-index and AIC. The comparison of models concluded that all potentially presented an adequate discrimination ability to predict OS and a good calibra-tion, but PNI was the most balanced model, according to both AUC and c-index and AIC coefficients.
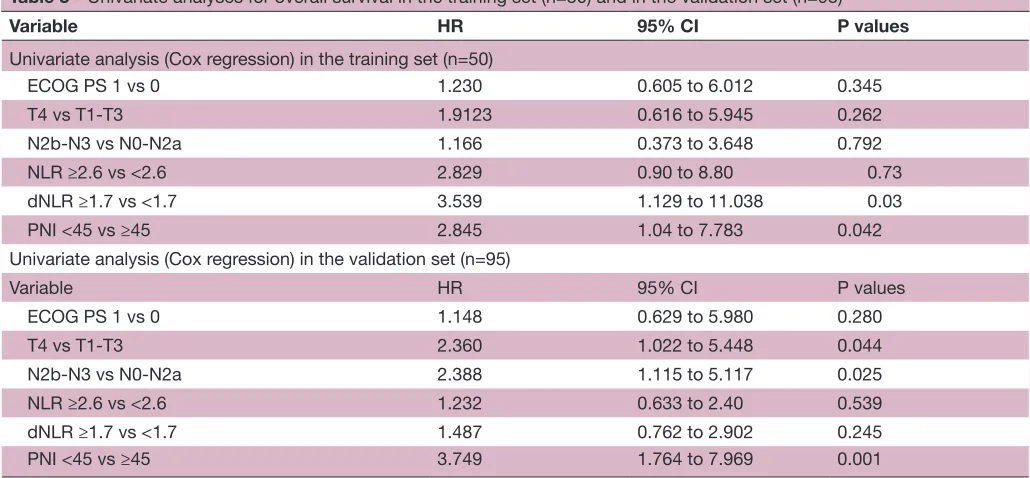
Qualification of the PnI as a predictor of os in laHnsCC Univariate analysis of OS in the training set identified a low PNI score as a significant predictor of mortality with a 12-month OS of 72% for patients with PNI-low (<45) vs 90% for patients with PNI-high (≥45) (p=0.042). Other significant predictors of shorter OS on univariate analysis included a high NLR (NLR≥2.6) (p=0.05) and a high dNLR (dRNL ≥1.7) (p=0.02). In contrast, some classic prognostic factors, such as tumour size (T4 vs T1-T3) (p=0.262), lymph node disease (N2b-3 vs N0-2a) (p=0.792) or ECOG PS (p=0.345) did not reach statistical significance (table 3).
Following multivariate analysis only PNI (HR 2.84, 95% CI 1.04 to 7.78, p=0.042) and dNLR (HR 3.53, 95% CI 1.13 to 11.03, p=0.03) retained independent prognostic power in the training patient cohort. However, NLR was not a significant predictor of OS on multivariate analysis in the training set (table 4).
Validation of the PnI as a predictor of os in laHnsCC
The prognostic ability of PNI was verified in an inde-pendent, retrospectively collected database of LAHNSCC. Patients with a low PNI score were more likely to have more advanced lymph node disease (p=0.038), more advanced TNM staging (p=0.012) and higher NLR and dNLR levels (p=0.007 and p=0.44, respectively). There was no significant association between PNI and primary tumour site (p=0.465), smoking (p=0.705), alcohol consumption (p=0.524), tumour size (p=0.458) and p16/ HPV status (p=0.634/p=0.534).
In the univariate analysis, low PNI (PNI <45) (p=0.001), large primary tumour (T4) (p=0.044) and advanced lymph node disease (N2b-N3) (p=0.025) were signifi-cantly associated with poorer OS. In contrast, a high NLR and a high dNLR did not impact on OS (all p values >0.05) (table 3).
In the multivariate analysis, only PNI-low (HR 3.3, 95% CI 1.4 to 7.4, p=0.0007) and T4 (HR 3.2, 95% CI 1.08 to 9.54, p=0.041) maintained their significance as indepen-dent factors linked to an inferior OS. The HRs and 95% CIs for these independent factors are shown in table 4.
We compared the accuracy of the PNI and other IBP (dNLR and NLR) in predicting OS using ROC curve analysis, c-index and AIC. The comparison of models concluded that all potentially presented an adequate discrimination ability to predict OS and a good calibra-tion, but PNI was the most balanced model, according to both AUC and c-index and AIC coefficients.
dIsCussIon
In this study, we identified and validated the prognostic value of PNI in patients with LAHNSCC treated with ICT followed by concurrent radiochemotherapy with curative intention. A low PNI was associated with a shorter survival, irrespective of other stage-related prognostic factors. Our study underlines the importance of baseline serum
on September 12, 2020 by guest. Protected by copyright.
Table 2 Comparison of optimal threshold, discrimination ability and internal calibration of haematological biomarkers inflammation-based
NLR dRNL PNI
AUC ROC curve 0.72 0.73 0.70
Threshold established according to the ROC curve in the training set 2.6 1.7 45
Harrel’s c index (c-index) 0.609 0.611 0.658
Akaike information criterion 142.61 125.93 121.88
AUC, area under the curve; NLR, neutrophil to lymphocyte ratio; PNI, Prognostic Nutritional Index; ROC, receiver operating characteristic; dRNL, derived neutrophil to lymphocyte ratio.
Table 3 Univariate analyses for overall survival in the training set (n=50) and in the validation set (n=95)
Variable HR 95% CI P values
Univariate analysis (Cox regression) in the training set (n=50)
ECOG PS 1 vs 0 1.230 0.605 to 6.012 0.345
T4 vs T1-T3 1.9123 0.616 to 5.945 0.262
N2b-N3 vs N0-N2a 1.166 0.373 to 3.648 0.792
NLR ≥2.6 vs <2.6 2.829 0.90 to 8.80 0.73
dNLR ≥1.7 vs <1.7 3.539 1.129 to 11.038 0.03
PNI <45 vs ≥45 2.845 1.04 to 7.783 0.042
Univariate analysis (Cox regression) in the validation set (n=95)
Variable HR 95% CI P values
ECOG PS 1 vs 0 1.148 0.629 to 5.980 0.280
T4 vs T1-T3 2.360 1.022 to 5.448 0.044
N2b-N3 vs N0-N2a 2.388 1.115 to 5.117 0.025
NLR ≥2.6 vs <2.6 1.232 0.633 to 2.40 0.539
dNLR ≥1.7 vs <1.7 1.487 0.762 to 2.902 0.245
PNI <45 vs ≥45 3.749 1.764 to 7.969 0.001
NLR, neutrophil to lymphocyte ratio; PNI, Prognostic Nutritional Index; PS, Eastern Cooperative Oncology Group Performance Status; dNLR, derived neutrophil to lymphocyte ratio.
inflammatory indices for prediction of OS in LAHNSCC in this setting.
To date, the major advance in developing prognostic models in HNSCC has been the new classification for oropharyngeal carcinoma according to p16 status, which was adopted in the eighth edition of the AJCC TNM clas-sification of malignant tumours, which was implemented in January 2018.28 It has been paradigm-changing since it recognises p16-immunopositive oropharyngeal squamous cell carcinoma as a completely different biological and molecular entity. However, this subgroup represents only between 25% and 30% of our whole HNSCC population.
With regard to the factors included in our study, only NLR was already studied in HNSCC. A recent meta-anal-ysis concluded that a high baseline NLR is associated with poor prognosis in patients with HNSCC.29 Our initial observation on the univariate analysis was consistent with these results in the training set.
The potential advantage of this inflammation-based biomarker is that it may reflect the underlying immune status and host inflammatory response. Moreover, it
can be easily calculated for any patient, using routine pretreatment blood tests. It could be a promising prog-nostic biomarker since it has already shown correlation with OS in other cancer subtypes, including a small series of HNSCC in early stages. However, although all studied inflammatory markers were associated in our series with OS in the univariate analysis, PNI was the only one inde-pendently associated with OS in the multivariate anal-ysis, in both training and validation cohorts. In contrast, there is still a lack of consensus on the optimal baseline NLR and dNLR threshold in this setting. Another weak-ness is that they can be very much influenced by external factors such as the use of corticosteroids or intercurrent infections.
On the other hand, PNI seems to be a more robust biomarker, with greater internal and external validity, and with less variability based on external factor. In addi-tion, as other inflammation-based biomarker mentioned above, it is reproducible, inexpensive and universally available, with the advantage of providing reliable infor-mation about host nutritional status as well.
on September 12, 2020 by guest. Protected by copyright.
Table 4 Multivariate analyses for overall survival in the training set (n=50) and in the validation set (n=95)
Variable HR 95% CI P values
Multivariate analysis (Cox regression) in the training set (n=50)
NLR ≥2.6 vs <2.6 2.829 0.91 to 8.80 0.073
dNLR ≥1.7 vs <1.7 3.530 1.13 to 11.03 0.030
PNI <45 vs ≥45 2.845 1.04 to 7.78 0.042
Multivariate analysis (Cox regression) in the validation set (n=95)
T4 vs T1-T3 3.111 1.048 to 9.234 0.041
N2b-3 vs N0-N2a 2.191 0.861 to 5.578 0.90
PNI <45 vs ≥45 3.019 1.347 to 6.768 0.007
NLR, neutrophil to lymphocyte ratio; PNI, Prognostic Nutritional Index; dNLR, derived neutrophil to lymphocyte ratio.
There are many advantages stemming from the incor-poration of the PNI into the prognostic assessment of patients with LAHNSCC, some of which warrant further investigation in prospective studies. First, systemic inflam-mation represents a previously not comprehensively explored prognostic domain in this scenario. Second, since it is a stage-independent trait, it does not compete but rather ideally integrates with traditionally prognostic factors. Third, subjects displaying an ongoing inflam-matory response may be at an additional risk of chemo-therapy-related toxicity because of inflammation-related alterations in drug pharmacokinetics such as modula-tion of cytochrome P450 metabolism as well as hypoal-buminaemia30; it could be helpful to clarify criteria for induction chemotherapy that remains controversial. Last, it could be interesting for future studies to determine if the dynamic changes in PNI after treatment may prove useful in evaluating therapeutic benefit in LAHNSCC.
One of the main strengths of this study is the external validation of our findings in an independent data set. However, it also has several limitations. First, it was a retrospective cohort study with exploratory intent. More-over, given its retrospective nature and period of time of inclusion, tumours were staged according to the seventh edition of the AJCC TNM,26 and p16 status, a well-es-tablished prognostic factor at present, was unknown in some patients. Furthermore, due to the retrospective nature of our study, we did not have accurate informa-tion available on treatment delays and dose reducinforma-tions in the chemotherapy schedule. This was done according to standard of care in a routine clinical practice setting. We certainly admit they might slightly contribute to only small differences in survival between the training and validation sets. Nevertheless, since our ultimate goal was to describe a new independent prognostic factor, a more detailed analysis of these data exceeds the purpose of our study. Finally, prospective studies are needed to confirm the utility of PNI in risk stratification of LAHNSCC and potentially tailoring therapies.
In conclusion, we suggest the prognostic value of PNI in patients with LAHNSCC be composed of two routinely available and readily assessable factors: albumin and lymphocyte count. PNI could be useful in our daily
clinical practice to improve on prognostic assessment and to guide clinical decision making. Nevertheless, a prospective validation in a larger population is required.
Contributors All authors made substantial contribution to the conception and design of the study, and/or acquisition of data, and/or analysis and interpretation of data. All authors have participated in drafting the article. All authors gave final approval of the version to be submitted and to the revised version.
Funding This work was supported by grant PI15/02180 to Andrés Cervantes from Fondo de Investigaciones Sanitarias (Instituto de Salud Carlos III) from the Spanish Government and CIBERONC.
Competing interests None declared. Patient consent Not required.
ethics approval This retrospective study was approved by the INCLIVA-Biomedical Research Institute Committee for Clinical Research and conducted in accordance with the principles of the Declaration of Helsinki.
Provenance and peer review Not commissioned; externally peer reviewed. open access This is an open access article distributed in accordance with the Creative Commons Attribution Non Commercial (CC BY-NC 4.0) license, which permits others to distribute, remix, adapt, build upon this work non-commercially, and license their derivative works on different terms, provided the original work is properly cited, any changes made are indicated, and the use is non-commercial. See: http:// creativecommons. org/ licenses/ by- nc/ 4. 0/
RefeRences
1. Blot WJ, McLaughlin JK, Winn DM, et al. Smoking and drinking in relation to oral and pharyngeal cancer. Cancer Res 1988;48:3282–7. 2. Kato I, Nomura AM. Alcohol in the aetiology of upper aerodigestive
tract cancer. Eur J Cancer B Oral Oncol 1994;30B:75–81.
3. Hashibe M, Brennan P, Benhamou S, et al. Alcohol drinking in never users of tobacco, cigarette smoking in never drinkers, and the risk of head and neck cancer: pooled analysis in the International Head and Neck Cancer Epidemiology Consortium. J Natl Cancer Inst
2007;99:777–89.
4. Wyss AB, Herring AH, Avery CL, et al. Single-nucleotide polymorphisms in nucleotide excision repair genes, cigarette smoking, and the risk of head and neck cancer. Cancer Epidemiol Biomarkers Prev 2013;22:1428–45.
5. Gillison ML, D'Souza G, Westra W, et al. Distinct risk factor profiles for human papillomavirus type 16-positive and human papillomavirus type 16-negative head and neck cancers. J Natl Cancer Inst
2008;100:407–20.
6. Kreimer AR, Johansson M, Waterboer T, et al. Evaluation of human papillomavirus antibodies and risk of subsequent head and neck cancer. J Clin Oncol 2013;31:2708–15.
7. Ndiaye C, Mena M, Alemany L, et al. HPV DNA, E6/E7 mRNA, and p16INK4a detection in head and neck cancers: a systematic review and meta-analysis. Lancet Oncol 2014;15:1319–31.
8. Castellsagué X, Alemany L, Quer M. ICO International HPV in head and neck cancer study group. HPV involvement in head and neck
on September 12, 2020 by guest. Protected by copyright.
cancers: comprehensive assessment of biomarkers in 3680 patients.
J Natl Cancer Inst 2016;108:403.
9. Licitra L, Keilholz U, Tahara M, et al. Evaluation of the benefit and use of multidisciplinary teams in the treatment of head and neck cancer.
Oral Oncol 2016;59:73–9.
10. Arribas L, Hurtós L, Sendrós MJ, et al. NUTRISCORE: A new nutritional screening tool for oncological outpatients. Nutrition
2017;33:297–303.
11. Moon H, Roh JL, Lee SW, et al. Prognostic value of nutritional and hematologic markers in head and neck squamous cell carcinoma treated by chemoradiotherapy. Radiother Oncol 2016;118:330–4. 12. Andreyev HJ, Norman AR, Oates J, et al. Why do patients
with weight loss have a worse outcome when undergoing chemotherapy for gastrointestinal malignancies? Eur J Cancer
1998;34:503–9.
13. Orell-Kotikangas H, Österlund P, Mäkitie O, et al. Cachexia at diagnosis is associated with poor survival in head and neck cancer patients. Acta Otolaryngol 2017;137:778–85.
14. Argilés JM, Moore-Carrasco R, Busquets S, et al. Catabolic mediators as targets for cancer cachexia. Drug Discov Today
2003;8:838–44.
15. Onodera T, Goseki N, Kosaki G. [Prognostic nutritional index in gastrointestinal surgery of malnourished cancer patients]. Nihon Geka Gakkai Zasshi 1984;85:1001–5.
16. Nozoe T, Kimura Y, Ishida M, et al. Correlation of pre-operative nutritional condition with post-operative complications in surgical treatment for oesophageal carcinoma. Eur J Surg Oncol
2002;28:396–400.
17. Pinato DJ, Stebbing J, Ishizuka M, et al. A novel and validated prognostic index in hepatocellular carcinoma: the inflammation based index (IBI). J Hepatol 2012;57:1013–20.
18. Chan AW, Chan SL, Wong GL, et al. Prognostic Nutritional Index (PNI) predicts tumor recurrence of very early/early stage hepatocellular carcinoma after surgical resection. Ann Surg Oncol
2015;22:4138–48.
19. Nakao M, Muramatsu H, Kagawa Y, et al. Immunological status may predict response to nivolumab in non-small cell lung cancer without driver mutations. Anticancer Res 2017;37:3781–6.
20. Peng D, Gong YQ, Hao H, et al. Preoperative prognostic nutritional index is a significant predictor of survival with bladder cancer after radical cystectomy: a retrospective study. BMC Cancer
2017;17:391.
21. Kawasaki T, Wasano K, Yamamoto S, et al. Utility of clinico-biological data for long-term prognosis of head and neck terminal cancer. Acta Otolaryngol 2017;137:895–8.
22. Kono T, Sakamoto K, Shinden S, et al. Pre-therapeutic nutritional assessment for predicting severe adverse events in patients with head and neck cancer treated by radiotherapy. Clin Nutr
2017;36:1681–5.
23. Coffelt SB, Wellenstein MD, de Visser KE. Neutrophils in cancer: neutral no more. Nat Rev Cancer 2016;16:431–46.
24. Kao SC, Pavlakis N, Harvie R, et al. High blood neutrophil-to-lymphocyte ratio is an indicator of poor prognosis in malignant mesothelioma patients undergoing systemic therapy. Clin Cancer Res 2010;16:5805–13.
25. Proctor MJ, McMillan DC, Morrison DS, et al. A derived neutrophil to lymphocyte ratio predicts survival in patients with cancer. Br J Cancer 2012;107:695–9.
26. Edge SB, Byrd DR, Compton CC, eds. AJCC cancer staging manual. 7th edn. New York: NY: Springer, 2010.
27. Uno H, Cai T, Pencina MJ, et al. On the C-statistics for evaluating overall adequacy of risk prediction procedures with censored survival data. Stat Med 2011;30:1105–17.
28. Amin MB, Edge S, Greene F, et al. AJCC cancer staging manual. 8th ed. New York: NY: Springer, 2017.
29. Yu Y, Wang H, Yan A, et al. Pretreatment neutrophil to lymphocyte ratio in determining the prognosis of head and neck cancer: a meta-analysis. BMC Cancer 2018;18:383.
30. Kacevska M, Downes MR, Sharma R, et al. Extrahepatic cancer suppresses nuclear receptor-regulated drug metabolism. Clin Cancer Res 2011;17:3170–80.
on September 12, 2020 by guest. Protected by copyright.