Geosci. Instrum. Method. Data Syst., 2, 165–176, 2013 www.geosci-instrum-method-data-syst.net/2/165/2013/ doi:10.5194/gi-2-165-2013
© Author(s) 2013. CC Attribution 3.0 License.
EGU Journal Logos (RGB)
Advances in
Geosciences
Open Access
Natural Hazards
and Earth System
Sciences
Open AccessAnnales
Geophysicae
Open AccessNonlinear Processes
in Geophysics
Open AccessAtmospheric
Chemistry
and Physics
Open AccessAtmospheric
Chemistry
and Physics
Open Access DiscussionsAtmospheric
Measurement
Techniques
Open AccessAtmospheric
Measurement
Techniques
Open Access DiscussionsBiogeosciences
Open Access Open Access
Biogeosciences
DiscussionsClimate
of the Past
Open Access Open Access
Climate
of the Past
Discussions
Earth System
Dynamics
Open Access Open Access
Earth System
Dynamics
DiscussionsGeoscientific
Instrumentation
Methods and
Data Systems
Open Access
Geoscientific
Instrumentation
Methods and
Data Systems
Open Access DiscussionsGeoscientific
Model Development
Open Access Open Access
Geoscientific
Model Development
DiscussionsHydrology and
Earth System
Sciences
Open AccessHydrology and
Earth System
Sciences
Open Access DiscussionsOcean Science
Open Access Open Access
Ocean Science
DiscussionsSolid Earth
Open Access Open Access
Solid Earth
DiscussionsThe Cryosphere
Open Access Open Access
The Cryosphere
DiscussionsNatural Hazards
and Earth System
Sciences
Open Access
Discussions
The AmeriFlux data activity and data system: an evolving collection
of data management techniques, tools, products and services
T. A. Boden, M. Krassovski, and B. Yang
Oak Ridge National Laboratory, Carbon Dioxide Information Analysis Center, Oak Ridge, TN 37831-6290, USA
Correspondence to: T. A. Boden (bodenta@ornl.gov)
Received: 30 January 2013 – Published in Geosci. Instrum. Method. Data Syst. Discuss.: 21 February 2013 Revised: 1 May 2013 – Accepted: 3 May 2013 – Published: 27 June 2013
Abstract. The Carbon Dioxide Information Analysis Center (CDIAC) at Oak Ridge National Laboratory (ORNL), USA has provided scientific data management support for the US Department of Energy and international climate change sci-ence since 1982. Among the many data archived and avail-able from CDIAC are collections from long-term measure-ment projects. One current example is the AmeriFlux mea-surement network. AmeriFlux provides continuous measure-ments from forests, grasslands, wetlands, and croplands in North, Central, and South America and offers important insight about carbon cycling in terrestrial ecosystems. To successfully manage AmeriFlux data and support climate change research, CDIAC has designed flexible data systems using proven technologies and standards blended with new, evolving technologies and standards. The AmeriFlux data system, comprised primarily of a relational database, a PHP-based data interface and a FTP server, offers a broad suite of AmeriFlux data. The data interface allows users to query the AmeriFlux collection in a variety of ways and then sub-set, visualize and download the data. From the perspective of data stewardship, on the other hand, this system is de-signed for CDIAC to easily control database content, auto-mate data movement, track data provenance, manage meta-data content, and handle frequent additions and corrections. CDIAC and researchers in the flux community developed data submission guidelines to enhance the AmeriFlux data collection, enable automated data processing, and promote standardization across regional networks. Both continuous flux and meteorological data and irregular biological data collected at AmeriFlux sites are carefully scrutinized by CDIAC using established quality-control algorithms before the data are ingested into the AmeriFlux data system. Other tasks at CDIAC include reformatting and standardizing the
diverse and heterogeneous datasets received from individual sites into a uniform and consistent network database, gen-erating high-level derived products to meet the current de-mands from a broad user group, and developing new products in anticipation of future needs. In this paper, we share our approaches to meet the challenges of standardizing, archiv-ing and deliverarchiv-ing quality, well-documented AmeriFlux data worldwide to benefit others with similar challenges of han-dling diverse climate change data, to further heighten aware-ness and use of an outstanding ecological data resource, and to highlight expanded software engineering applications be-ing used for climate change measurement data.
1 Introduction and background
1.1 Brief overview of the AmeriFlux network
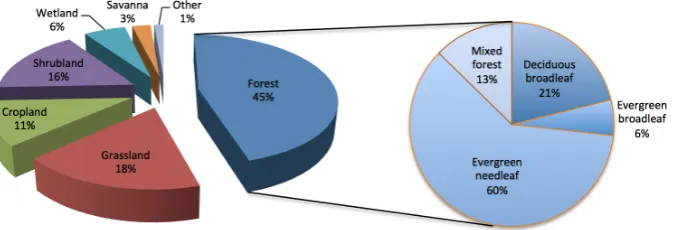
The AmeriFlux network is a collection of more than 150 past and present flux towers (Fig. 1) located mostly in the US, but with limited sites in Canada, Central America, and South America, making continuous measurements of wa-ter vapor, carbon dioxide (CO2), energy fluxes, and re-lated environmental variables using eddy covariance tech-niques (Baldocchi, 2003). The network covers a large vari-ety of ecosystem types including forests, grasslands, crop-lands, shrubcrop-lands, wetcrop-lands, savannas, and others (e.g., ur-ban) (Fig. 2). The Carbon Dioxide Information Analysis Center (CDIAC) at Oak Ridge National Laboratory (ORNL), USA serves as the AmeriFlux permanent data archive and fo-cal point for dissemination of AmeriFlux data (http://public. ornl.gov/ameriflux). As scientists and the public try to bet-ter understand climate change, AmeriFlux data have detailed
Fig. 1. Geographic distribution of registered flux sites in the AmeriFlux network as of January 2013 superimposed on a map depicting ecosystem representations from the International Geosphere-Biosphere Programme (IGBP).
Fig. 2. Ecosystem representation, according to IGBP ecosystem classifications, of the AmeriFlux network based on registered sites as of January 2013.
how diverse ecosystems respond to changes in their phys-ical environment and how ecosystems, in turn, affect their environments. AmeriFlux data have improved understanding of changes in net carbon uptake with interannual variation in climate and the influence of disturbance on carbon stor-age and fluxes. Models are fundamental to understanding and predicting biogeochemical cycles and future climates. Amer-iFlux data are proving invaluable in improving and calibrat-ing models used in climate science (Randerson et al., 2009; Schwalm et al., 2010; Williams et al., 2012 among many others).
1.2 Challenges, design criteria, and requirements
AmeriFlux sites are funded by multiple sources, typi-cally US federal agencies. Recommendations are made by an AmeriFlux Scientific Steering Committee (SSC) regarding standard operating procedures, but there are no mandatory measurement and instrumentation protocols. Science objec-tives and corresponding measurement strategies are often site-specific, resulting in great variance, and richness, in the measurements made across the collective AmeriFlux net-work. Other regional flux networks exist worldwide, and co-ordination with these networks is important to optimize the utility of the AmeriFlux data collection and to better serve the larger climate change scientific community.
The AmeriFlux SSC and CDIAC offer guidance on data submission requirements to site investigator teams for con-tinuous measurements and infrequent, complementary bio-logical measurements. Raw data captured by the site data loggers for continuous measurements are maintained by the site teams and are not submitted to CDIAC. Site investi-gators process high-frequency samples (usually at 10 Hz or higher) to produce half-hourly or hourly estimates of sured variables. Independent biological and ecological mea-surements (e.g., soil carbon content, foliage nitrogen con-centration, tree allometry) are important for interpreting and validating the continuous AmeriFlux eddy covariance mea-surements and for parameterizing models. These companion biological measurements pose a challenge in assembling a consistent, network-wide resource due to the range of mea-surement methodologies and frequencies, differences in spa-tial representativeness, and the detailed metadata needed to fully characterize the measurement.
The breadth and diversity of measurements and data pro-cessing at individual sites, along with site differences in re-sources and staff dedicated to data handling, makes uniform data submission difficult. Data quality and consistency vary across AmeriFlux sites and measurement groups. As a result, CDIAC is tasked with assembling a network-wide database based on varying submissions from individual sites.
Adequate description of AmeriFlux measurements is cru-cial to proper use and understanding of reported AmeriFlux data. Metadata must be coupled with the primary environ-mental measurements to understand the reported data and expand use. Many micrometeorological and ecological terms commonly reported by AmeriFlux investigators are not cov-ered by ongoing attempts to unify and standardize environ-mental data and metadata collections. For example, soil tem-perature and moisture measurements at various depths be-low the surface, which are commonly reported by Ameri-Flux sites and fundamental to the AmeriAmeri-Flux data collection, are not covered in the present NetCDF Climate and Forecast (CF) metadata convention.
AmeriFlux data records can be updated frequently as im-provements (e.g., new screening algorithm) and adjustments (e.g., apply a correction to a degrading photosynthetically ac-tive radiation sensor) are made to site data records. These
changes must be documented, making data provenance an essential ingredient of the AmeriFlux data system.
No single commercial software package or software en-gineering technique satisfies all the requirements for the AmeriFlux data system, although the prototype Microsoft (MS®) DataCube was considered. Below we provide an overview of a comprehensive, data management approach used by CDIAC to handle Earth system data from the Ameri-Flux network. We detail the software engineering techniques and tools used in the AmeriFlux data effort in the hopes other scientific data efforts will benefit from our experiences and these tools.
2 Data management methods and approaches
2.1 Data submission, quality control and standardization
As mentioned previously, CDIAC is charged with as-sembling a network-wide AmeriFlux database from data submissions by individual site teams. CDIAC developed data submission guidelines (http://public.ornl.gov/ameriflux/ data-guidelines.shtml) for the continuous half-hourly or hourly estimates of flux and meteorological variables to im-prove efforts in automating data processing and to invoke standardization of reported variables, units, and conventions (e.g., terrestrial carbon source and sink sign conventions).
To encourage data submissions, CDIAC accepts data in the manner most convenient for the submitting site team. Hourly or half-hourly summaries are received and obtained in nu-merous ways, including mirroring scripts (wget and cron jobs), commercial transfer packages (e.g., Dropbox), dedi-cated areas on secure File Transfer Protocol (FTP) servers, or as e-mail attachments.
Due to differences in measurement strategies, data pro-cessing rigor, and data quality, CDIAC invests considerable effort to first evaluate submissions by individual site teams and then reformat, convert, or derive variables according to the prescribed submission guidelines (Table 1). A key initial task is to fully understand the content and context of the sub-mitted data before producing a consistent network resource and this elementary step requires micrometeorological exper-tise. Fundamental groundwork is laid during this initial eval-uation towards standardizing variable names, units, and re-porting intervals and towards capturing and enhancing meta-data.
Given the importance and diversity of AmeriFlux data and recent scrutiny towards climate change data and model re-sults, it is imperative that scientific data archives address and document data quality. Permanent scientific data archives, like CDIAC, cannot accept data at face value without eval-uating data quality or trusting quality assessments by data providers or outside assessment groups. CDIAC scrutinizes the continuous meteorological and flux data submitted by
Table 1. Initial checks, evaluations, and clarifications performed by CDIAC on incoming AmeriFlux meteorological and flux data. These checks are necessary to determine the content and quality of the submitted data, as well as to identify corrections and derivations that must be made in subsequent processing.
Categories used to evaluate Considerations and examples incoming AmeriFlux data
Time representation Are the data time-stamped using local time or coordinated universal time (UTC)? Are values reported at the beginning or ending of a sampling period?
Variable nomenclature, What measured and derived variables are provided and how are definition, and symbolic they named or represented symbolically? For example, water convention vapor flux vs. evapotranspiration or different acronyms (PAR vs. PPFD) for the same measurement of photosynthetically active radiation. How is each variable defined? For example, is soil heat flux defined as heat flux through the soil heat plate or as the sum of the heat flux through the soil heat plate and the heat stored in the soil layer above the plate?
Unit What unit is used for each reported variable and is it consistent with the prescribed data submission guidelines? For example, reporting CO2concentration in µmol mol−1vs. mg m−3.
Sign convention What sign conventions are used by the reporting team? For example, carbon uptake is often reported as negative values for downward CO2fluxes but as positive values for upward releases to the atmosphere from photosynthetic production.
Multiple and redundant Are multiple and redundant measurements reported and, if so, measurements how are they represented? For example, are they reported as
independent measurements or an average from multiple sensors?
Measurement height/depth Is each measurement properly associated with a measurement height or depth? Are values reported at a single level or reflecting an integral measurement of multiple levels? For example, soil temperature measured at 10 cm vs. within a vertical column (0–30 cm).
Data handling and What adjustments have been applied to the reported variables? processing Were the data filtered, screened, or gap-filled? Were corrections
applied to the flux terms and, if so, which ones (e.g., planar vs. two-dimensional coordinate rotation)?
Metadata Are the submitted data accompanied by proper metadata? Different measurement teams report different levels of details in their metadata, from simple file headers (symbolic variable names and units only) to comprehensive documentation including measurement techniques, variable definitions, sign conventions, etc.
Basic data quality Are the data submitted of “publication” quality or just one step assessment after being retrieved from the data-logger?
AmeriFlux investigators for quality and completeness (Ta-ble 2). Resident micrometeorological expertise benefits our programming efforts to develop robust and credible quality checks. Issues identified during the data quality evaluations are documented and resolved interactively between CDIAC and the site investigator teams. The checks identified in Ta-ble 2 are currently implemented in C, FORTRAN, and SAS®
Table 2. Quality evaluations and checks performed by CDIAC on incoming meteorological and flux data submissions.
Quality evaluations/checks Detail and action
Missing or repeated entry Determine if the total number of yearly data records matches the expected total (e.g., 17 520 half-hourly records for a non-leap year), if the time increment between consecutive entries matches the sampling intervals (30 or 60 min); and if data entries are in chronological order.
Time-stamp Check for consistency between time-stamp entries, for example, between a set of month, day, hour, minute and Julian day entries.
Threshold Conservative thresholds are determined for each variable and site (e.g., the likely maximum air temperature at an Alaskan site), and out-of-bound values are reset to a prescribed missing value (e.g.,−9999).
Nighttime radiation Determine the daily nighttime period using a sunrise and sunset calculator and the percentage of nighttime radiation values beyond a tolerance level; these invalid values (for shortwave and photosynthetically active radiation) are reset to zero.
Biological and Some variables or redundant measurements should be meteorological inter- inherently correlated, for example, photosynthetically active relationship radiation and global radiation, air temperature and soil
temperature, etc. Poor correlations typically indicate problems and are investigated on a case-by-case basis.
Spike detection Generally speaking, a data value is considered a “spike” if the value deviates from the mean by±3 standard deviations. For variables with little expected variation (e.g., pressure), we check for spikes over the entire time series. For variables showing distinct seasonal and diurnal patterns (e.g., air temperature), we check for spikes against the diurnal means within a moving time window (e.g., 20 days).
Stationarity Check if time series lack reasonable variation during a day or over a short period (10–20 days).
Diurnal and seasonal Check the monthly mean diurnal cycles and seasonal cycles cycles where these cycles are known and expected; diurnal cycle for
a single day is checked by evaluating the correlation and consistency between this day and the mean diurnal cycles in the current and neighboring months.
Discontinuity and inter- Detect the discontinuities and trends in time series across annual variation multiple years. For example, a declining trend in radiation
measurement over years may indicate an instrument calibration drift.
Former AmeriFlux Science Chair, Dr. Beverly Law (Oregon State University), and others developed guide-lines for measurement teams to submit summaries of biological measurements collected at flux sites along with important site ancillary, disturbance, and manage-ment information (Law et al., 2008). These guidelines continue to evolve and have been sorely needed by ecological measurement networks attempting to amass
ecological data reportings. Templates, referred to as BADM (Biological-Ancillary-Disturbance-Management) templates, are available to potential submitters as multi-worksheet Microsoft Excel® spreadsheets (http://public.ornl.gov/ ameriflux/AmeriFlux BiologicalDataTemplates 2009.xls). The guidance serves an important first step in defining and standardizing highly variable, irregularly measured ecological data essential for model parameterization.
Due to the irregular and sometimes non-numeric nature of biological data, an automated system for quality eval-uation is not practical and requires considerable manual effort. CDIAC ecological experts evaluate the biological data based on their own field measurement experience, by cross-examining the submitted records over multiple years at the same site, or by making comparisons with published data from other sites of the same ecosystem type. Suspicious entries and other issues are usually reported back to data providers and resolved in an interactive and collaborative manner. CDIAC also invests effort to integrate the biologi-cal data from individual sites into a uniform network dataset. Specifically, CDIAC edits data entries and documents the changes if data providers fail to follow the submission guide-lines in their original submissions. Typical examples are unit conversions (from g dry biomass m−2 to g C m−2), adjust-ments to conform to prescribed definitions (from double-sided and all-double-sided leaf area indices to single-double-sided), and data code translations (replacing the scientific and common names of tree species by their standard codes defined by the US Department of Agriculture, Natural Resources Conserva-tion Service).
2.2 Data products
CDIAC offers four different product levels for the continuous AmeriFlux meteorological and flux measurements. These products differ in origin, content, and level of data process-ing. The four product levels are:
– Level 1: processed data provided by the site investi-gators. Level 1 data files originally provided by the site measurement teams are evaluated and corrected by CDIAC as described in Sect. 2.1 and further pro-cessed by CDIAC to produce Level 2 data products. The Level 1 data files are posted in their original form on the publically-available CDIAC anonymous FTP server (ftp://cdiac.ornl.gov/pub/ameriflux/data/) and in-clude regular and continuous half-hourly or hourly mea-surements of flux and meteorological variables and ir-regular measurements of biological variables in the BADM template or site specific format.
– Level 2: data checked and formatted by CDIAC. Data received from individual sites are reviewed, quality-controlled, reformatted, and incorporated into a network-wide AmeriFlux database. The review or evaluation process includes checks for consistent units, naming conventions, reporting intervals and others (see Sect. 2.1) and reformatting is often necessary to maintain consistency within the larger network-wide database. Level 2 data include both regular and contin-uous measurements of flux and meteorological variable and irregular measurements of biological variables. Considering the breadth and diversity of measure-ments at AmeriFlux sites, it is necessary for CDIAC
to generate Level 2 standardized files to accommodate network-wide synthesis studies. Presently, Level 2 stan-dardized files are generated for each year and individ-ual site for flux and meteorological measurements only, and contain a core suite of approximately 40 variables. Each standardized file contains headers providing vital site, citation, and file content information. There may be two sets of Level 2 standardized files for each site (i.e., a gap-filled set and a set with gaps in records) de-pending on the site submissions. The gap-filled Level 2 standardized files contain variables gap-filled by the site investigators or teams using site-specific methods.
– Level 3: processed data with quality flags assigned. Level 3 files are created in conjunction with ICOS (Inte-grated Carbon Observation System) in order to provide uniform flux tower records and data files across all re-gional flux networks, including the AmeriFlux network. These Level 3 files contain the same values as CDIAC’s Level 2 data files but with quality flags assigned. Quality flags are only applied to select flux and meteorological variables.
– Level 4: gap-filled and adjusted data files with estimates of gross primary production (GPP) and total ecosystem respiration (Re). Two sets of Level 4 data products ex-ist. The first set contains ICOS filtered and gap-filled flux records (CO2, sensible heat and latent heat fluxes), as well as derived GPP and Re terms. Data filtering, gap-filling and flux-partitioning are accomplished us-ing widely accepted techniques and algorithms in the flux community (Papale and Valentini, 2003; Reich-stein et al., 2005). Level 4 data differ from gap-filled Level 2 standardized files in that the selected variables are filled using the same techniques for all sites while Level 2 gap-filled records are generated by site-specific methods. After being gap-filled, hourly or half-hourly Level 4 data are aggregated into longer time intervals in-cluding daily, weekly, and monthly reporting intervals. The second set of Level 4 data products are produced by CDIAC and contain gap-filled meteorological records for AmeriFlux sites only. To satisfy the needs of driving ecosystem models with gap-free meteorological data, CDIAC recently developed a method (Table 3) to gap-fill commonly reported meteorological variables (e.g., relative humidity, air temperature, radiation) by adopt-ing and enhancadopt-ing the algorithms used in support of a model-data synthesis activity (Schwalm et al., 2010). This new Level 4 data product is now available for pub-lic use and evaluation, and CDIAC plans to further im-prove the methodology based on user feedback from this initial release.
Table 3. Flow diagram for the methodology used by CDIAC to gap-fill meteorological records for the AmeriFlux network.
1
Table 3. Flow diagram for the methodology used by CDIAC to gap-fill meteorological records for the AmeriFlux network.
Pre-treatment: flag potentially bad data, including spikes, out-of-bound values, non-zero shortwave radiation values at night, and zero shortwave radiation values during the day. Although these values are treated as original and valid records, they are excluded from the following steps.
Step 1: Determine whether redundant measurements are available (such as soil temperatures at multiple depths) or variables that correlate inherently well to others are available (for example, photosynthetically active radiation and global solar radiation).
Step 2: Determine whether a variable shows a clear diurnal cycle (for example, temperature, radiation terms, and vapor pressure deficit, etc.).
Step 3: Determine whether hourly data from a nearby weather station are available from the National Climate Data Center (NCDC). A weather station within 50 km of the selected flux site and with a similar elevation (difference < 100 m) is preferred. Currently, NCDC hourly data include air temperature, wind speed, atmospheric pressure, dew point temperature, and precipitation.
Step 4: Determine whether reanalysis data (NARR --- North American Regional Reanalysis) are available (resolution: 3-hour, 32 km 32 km). Normally, reanalysis data from the nearest grid point of a flux site will be used. However, if the grid point and the flux site have an elevation difference greater than 200 m or are separated by an elevated hill or mountain, the second nearest grid point will be selected and so on. Currently, NARR data used in this gap-filling technique include air temperature, specific humidity, precipitation, atmospheric pressure, wind speed, incoming and outgoing shortwave radiation, incoming and outgoing longwave radiation, net radiation, soil temperature, and soil moisture. The soil variables are averages at three soil layers, 0-10 cm, 10-40 cm and 40-100 cm.
(i) The best correlation coefficient is sought and determined by computing the lagged correlation between a variable and its redundant measurements or another inherently correlated variable within a 10-day window. Next, the linear regression at the best correlation coefficient is used to fill the gap within the same window. This window is always centered at the gap.
(ii) A gap in one variable is filled using derived values from other variables with original data. For example, vapor pressure deficit can be derived from air temperature and relative humidity.
(i) Gaps in a time series are filled by using a mean diurnal cycle within a 5- to 15-day window. A 5-day window will be used initially and a valid mean diurnal cycle is retained only if there are at least 50% valid data at each half-hour (or hour) period within the current window. If unsuccessful, the window will grow at an increment of 2 days up to a 15-day window. This window is always centered at the gap.
(ii) A sunrise/sunset calculator is employed to separate nighttime from daytime. Gaps in radiation terms (except net radiation, incoming and outgoing longwave radiation) at night are filled by assigning zero values.
(i) Hourly weather station data will be interpolated into half-hourly data if the sampling rate is half-hourly at a flux site. Secondly, a lagged correlation is computed between a variable measured at the flux site and the same variable recorded at the nearby weather station within a 30-day window and the best correlation coefficient is determined. This window is always centered at the gap. Thirdly, the linear regression at the best correlation coefficient is used to fill the data gap at the flux site based on the record validity at the weather station.
(ii) Precipitation is treated differently from other variables. First, precipitation from both the flux site and the selected weather station is transformed into a time series of rain events (0 for non-rain; 1 for rain event). Secondly, a lagged correlation is computed between the two time-series of rain events within a 30-day window until the best correlation coefficient is found. Finally, after taking the lag of rain events into account the rain total within the sampling period at the weather station is adjusted by the rain intensity ratio and then used to fill the gap in the precipitation record at the flux site.
(i) Through a spline function, NARR data (except precipitation) are down-scaled into hourly or half-hourly to match the data sampling rate at the flux site. NARR 3-hour rainfall totals are evenly distributed into all half-hourly or hourly intervals within that 3-hour period. The same methods as in step 3 are used to gap-fill data from the flux site. However, the window size at this step is extended to one year so that long gaps and those un-filled gaps from steps 1 to 3 can be filled using NARR data.
(ii) For soil temperature and moisture, measurement depth is considered in this gap-filling exercise. If the measurement depth is between 0 and 10 cm at a flux site, NARR data from 0-10 cm are used. If the measurement depth is between 10 and 40 cm at a flux site, NARR data from 10-40 cm are used. Otherwise, NARR data from 40-100 cm are used.
NO
YES
NO
YES
YES
NO
YES
Fig. 3. Number of AmeriFlux sites with data for each year from 1991 to 2011 based on the CDIAC AmeriFlux data collection in January 2013.
sites have submitted Level 1 flux and meteorological data in various lengths. Of these sites, 142 site submissions have been processed into Level 2 products by CDIAC while the rest either have lingering quality issues or are being pro-cessed and evaluated. Seventy-seven sites have contributed biological data. Level 3 and Level 4 gap-filled flux data are available for 78 sites, while Level 4 gap-filled meteorological records are available for 102 sites. Data availability for each year from 1991 to 2011 and the distribution of site record lengths are illustrated in Figs. 3 and 4. The average Level 2 data record length is 5.9 yr with 25 sites contributing records of 10 yr or longer. Among all registered sites, the Harvard Forest site has the longest data length and is the only Ameri-Flux site presently with a record exceeding twenty years.
2.3 Database, archive, and distribution
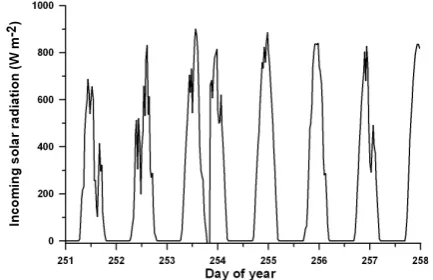
Most computer programs used by CDIAC to evaluate the in-tegrity of submitted AmeriFlux data are written in SAS®. SAS® is a proven, well-documented statistical analysis soft-ware package with powerful sort and merge capabilities and flexibilities in handling file formats. SAS/IntrNet® enables web browsers to run a SAS® report application and make the results available to the browser thus providing the ability to create a wide range of web-ready, dynamic data reports. CDIAC has used this product and feature to produce an in-teractive data interface to help in evaluating incoming Amer-iFlux data. One of the most powerful data evaluation tools is to review plots of individual measurement variables over time or plots of two correlated variables. The old adage, “A picture is worth a thousand words”, is very true when evaluat-ing scientific data. SAS® graphics capabilities complement the routine CDIAC quality checks summarized in Table 2 and often highlight obvious quality issues in the incoming data (Fig. 5). Another nice feature of the SAS/IntrNet® prod-uct is the ability to produce automated metadata reports in
Fig. 4. Distribution of data record lengths in years for the 142 Amer-iFlux sites with available Level 2 data products based on the CDIAC AmeriFlux data collection in January 2013.
Fig. 5. CDIAC uses graphics and visualization tools to review time series for all measured AmeriFlux variables, assess data quality, and identify possible errors. This plot shows an erroneous time shift be-ginning on day 254 for incoming solar radiation.
HTML format documenting data provenance including vari-able mappings, calculations, and unit conversions, etc.
CDIAC archives and distributes AmeriFlux data across two systems: (1) a PHP-based web interface that draws on a MySQL relational database; and (2) an anonymous FTP server. The two systems are independent but connected by links in the PHP web interface pointing to the FTP server.
Fig. 6. Diagram identifying the tables comprising the CDIAC AmeriFlux MySQL relational database. Tables connected by arrows share two identical variables, the site identifier and site investigator, to enable queries across multiple tables. Tables not connected by arrows are stand-alone tables within the database. Table names are shown at the top of each table box in bold letters. Column names within each table are listed below the table names.
partitioning since the data collection is built on data streams provided by individual site teams. Site investigators and identifiers serve as common threads linking MySQL tables comprising the AmeriFlux relational database (Fig. 6). An-other important decision was made early in the AmeriFlux data architecture design to handle all data additions and corrections via a PHP-developed, web-based editing inter-face. This strategy allows CDIAC to control the content of the production and archive databases, automate data move-ment, track data provenance (i.e., track changes, assign ver-sion numbers, etc.), and manage metadata content and stan-dardization. The strategy also removed the need for client-side software distributions. Presently, over 500 million ob-servations reside in the production-side AmeriFlux MySQL database available to the public.
The primary tool to deliver AmeriFlux data is a web-based interface referred to as the AmeriFlux Site and Data Explo-ration System (http://ameriflux.ornl.gov). The PHP interface allows users to query the AmeriFlux MySQL database in a variety of ways. Anticipated popular data and metadata search criteria were identified by CDIAC staff and incorpo-rated into the interface to assist users to navigate through the AmeriFlux database. Examples of search criterion are prod-uct levels (see Sect. 2.2), dates of available data, ecosystem types, site operating status (i.e., active or inactive), site coor-dinates, and instruments. New scientific-based search criteria are being added (e.g., distinction of measurements between nighttime and daytime, growing and dormant seasons) based on emerging needs from climate change researchers. Once users have identified data of interest, the interface permits users to further subset, download, or visualize their selec-tions. The same interface can be used to obtain fundamen-tal site information for all registered AmeriFlux sites. In-dependent web pages are dedicated to every single site and users can browse a broad set of metadata for the site of in-terest. These metadata include, for example, site identifica-tion, coordinates, names of principal investigator(s), site in-struments and publications, descriptions of site climate, veg-etation, soil, terrain and land use history, and many others. Interactive tables list all measurements reported by a site in-cluding variable names, definitions, units, and sign conven-tions. Visualization capabilities are also available at this web interface. Data can be downloaded directly from the Ameri-Flux MySQL database through this web interface or from the links pointing to the CDIAC FTP server.
As described in Sect. 2.2, CDIAC generates a set of Level 2 standardized ASCII data files for flux and me-teorological variables. These Level 2 files are posted on the CDIAC anonymous FTP server (ftp://cdiac.ornl.gov/ ameriflux/data/Level2) after being created using SAS® codes. These files are posted in separate site folders identified by the site name or a unique site ID (e.g., US-UMB) assigned to all flux sites worldwide. To satisfy users interested in data from multiple AmeriFlux sites rather than an individual site,
“Unix tar balls” are created and posted on the same CDIAC anonymous FTP server. New “tar balls” are created when-ever new AmeriFlux standardized files are posted to the FTP server using a Perl script, which executes based on new file names and creation dates. The “tar ball” file name conveys the creation date to promote easy mirroring and citation by users. These standardized files serve another critical func-tion. They enable the AmeriFlux regional network to par-ticipate in a virtual global flux network (FLUXNET) and its cross-continent synthesis studies. To further aid modeling and synthesis activities, identical NetCDF files are produced from the Level 2 standardized files using a Perl script to re-format the standardized files into the file re-format required by the NetCDF Compiler. All header information provided in the standardized ASCII files is written as global attributes into the corresponding NetCDF files. These NetCDF files are posted to the CDIAC server and included in the above-mentioned “tar balls”.
Also available at this FTP server are the higher level data products (i.e., Level 3 and 4 data) and biological data. Af-ter scrutinizing the biological data (see Sect. 2.1), individ-ual BADM files are integrated into a single MS Excel® file with multiple spreadsheets dedicated to different categories of biological measurements, including leaf area index (LAI), soil respiration, stand properties, biomass production, vege-tationCandN content, soil properties, and phenology. This integrated file, also referred to as Level 2 biological data, is entered into the AmeriFlux MySQL database by CDIAC staff through the PHP editing interface and also posted to the AmeriFlux FTP server. The complete AmeriFlux data life cy-cle, from site collection to distribution by CDIAC, is shown in Fig. 7.
Fig. 7. The AmeriFlux data life cycle. The life cycle moves from site collection (upper left) to processing by the site teams (top center) to CDIAC processing and data product generation (right side) to Integrated Carbon Observing System processing and product generation to dissemination by CDIAC.
results from the Intergovernmental Panel on Climate Change (IPCC) Fourth Assessment Report (AR4) and will serve in a similar capacity for the IPCC Fifth Assessment Report (AR5). ESGF has historically focused on model output, but is now including observational data important for model test-ing and validation, includtest-ing AmeriFlux data provided by CDIAC (http://esg2-gw.ccs.ornl.gov).
3 Conclusions
Like most scientific computing endeavors, there is no ready, commercial product that satisfies the full suite of data analy-sis, data management, metadata management, and data de-livery requirements for the AmeriFlux data activity. The breadth, complexity, and variability of data and metadata are too great to be handled by a single tool or product. In-stead, CDIAC has deployed a variety of data management tools, software, and software engineering techniques to sup-port the AmeriFlux data activity. Where needed, tools and
applications have been adapted and modified to specific re-quirements driven by the data needs of the international cli-mate change research community. Scientific data manage-ment approaches must be flexible, portable, and expandable in order to accommodate future users, increased data vol-umes, and new data products. It is virtually impossible to predict all future applications of scientific data making, it imperative that data system designs be flexible for unantic-ipated growth and, more importantly, that detailed metadata be captured to promote unexpected use and application.
Immediate needs for the AmeriFlux data system demon-strate the need for flexibility. There is a need for synchro-nization of regional flux databases, including common vari-able nomenclatures and units, common data products and metadata, uniform data processing, and node access to a “global” flux database. As publication tools for observational databases are developed within the ESGF, there will be a need to automate the ingest of AmeriFlux data to ESGF and, further, to launch new model simulations as revised and
updated AmeriFlux data become available. Demand from the scientific community and general public has grown for inclusion of uncertainty estimates or error bounds on flux and meteorological data. CDIAC is now undertaking an ef-fort to provide uncertainty estimates in the AmeriFlux data system and developing other products such as derivation of phenology stages from the existing measurements at Ameri-Flux sites.
Acknowledgements. This research and CDIAC were supported by the US Department of Energy, Office of Science, Biological and Environmental Research (BER), and conducted at Oak Ridge Na-tional Laboratory (ORNL), managed by UT-Battelle, LLC, for the US Department of Energy under contract DE-AC05-00OR22725.
Edited by: W. Schmidt
References
Baldocchi, D. D.: Assessing the eddy covariance technique for evaluating carbon dioxide exchange rates of ecosystems: past, present and future, Global Change Biol., 9, 479–492, 2003. Law, B. E., Arkebauer, T., Campbell, J. L., Chen, J., Sun, O.,
Schwartz, M., van Ingen, C., and Verma, S.: Terrestrial Carbon Observations: Protocols for Vegetation Sampling and Data Sub-mission, Global Terrestrial Observing System, 55, Rome, Italy, 2008.
Papale, D. and Valentini, R.: A new assessment of European forests carbon exchanges by eddy fluxes and artificial neural network spatialization, Global Change Biol., 9, 525–535, 2003.
Randerson, J. T., Hoffman, F. M., Thornton, P. E., Mahowald, N. M., Lindsay, K., Lee, Y. H., Nevison, C. D., Doney, S. C., Bo-nan, G., Stockli, R., Covey, C., Running, S. W., and Fung, I. Y.: Systematic assessment of terrestrial biogeochemistry in coupled climate-carbon models, Global Change Biol., 15, 2462–2484, 2009.
Reichstein, M., Falge, E., Baldocchi, D., Papale, D., Aubinet, M., Berbigier, P., Bernhofer, C., Buchmann, N., Gilmanov, T., Granier, A., Grunwald, T., Havrankova, K., Ilvesniemi, H., Janous, D., Knohl, A., Laurila, T., Lohila, A., Loustau, D., Mat-teucci, G., Meyers, T., Miglietta, F., Ourcival, J. M., Pumpanen, J., Rambal, S., Rotenberg, E., Sanz, M., Tenhunen, J., Seufert, G., Vaccari, F., Vesala, T., Yakir, D., and Valentini, R.: On the sep-aration of net ecosystem exchange into assimilation and ecosys-tem respiration: review and improved algorithm, Global Change Biol., 11, 1424–1439, 2005.
Schwalm, C. R., Williams, C. A., Schaefer, K., Anderson, R., Arain, M. A., Baker, I., Barr, A., Black, T. A., Chen, G. S., Chen, J. M., Ciais, P., Davis, K. J., Desai, A., Dietze, M., Dragoni, D., Fischer, M. L., Flanagan, L. B., Grant, R., Gu, L. H., Hollinger, D., Izaur-ralde, R. C., Kucharik, C., Lafleur, P., Law, B. E., Li, L. H., Li, Z. P., Liu, S. G., Lokupitiya, E., Luo, Y. Q., Ma, S. Y., Margolis, H., Matamala, R., McCaughey, H., Monson, R. K., Oechel, W. C., Peng, C. H., Poulter, B., Price, D. T., Riciutto, D. M., Riley, W., Sahoo, A. K., Sprintsin, M., Sun, J. F., Tian, H. Q., Tonitto, C., Verbeeck, H., and Verma, S. B.: A model-data intercomparison of CO2exchange across North America: Results from the North American Carbon Program site synthesis, J. Geophys. Res., 115, G00H05, doi:10.1029/2009JG001229, 2010.
Williams, C. A., Reichstein, M., Buchmann, N., Baldocchi, D., Beer, C., Schwalm, C., Wohlfahrt, G., Hasler, N., Bernhofer, C., Foken, T., Papale, D., Schymanski, S., and Schaefer, K.: Climate and vegetation controls on the surface water bal-ance: Synthesis of evapotranspiration measured across a global network of flux towers, Water Resour. Res., 48, W06523, doi:10.1029/2011WR011586, 2012.