Engineering and Technology Journal ISSN: 2456-3358 Impact Factor: 4.449
Strengthening of Subgrade Soil by Using Crushed Concrete
Hitesh1, Sumit Kumar2, Samik Sharma3
1
Post graduate student, Department of Civil Engineering ,GIET, Sonipat
2
Assistant Professor, Department of Civil Engineering, GIET, Sonipat
3
Assistant Professor, Department of Civil Engineering, MVSIT, Sonipat
ARTICLE INFO ABSTRACT
Corresponding Author:
Hitesh1
Post graduate student, Department of Civil Engineering ,GIET, Sonipat
Recycled aggregates consist of crushed, graded inorganic particles processed from the material that have been used in the constructions and demolition debris. The target of the present work is to determine the strength characteristic of recycled aggregates for the application in concrete pavement construction. The investigation was carried out by using workability test, compressive strength test, flexural strength test and sulphate resistance test. A total of five mixes with replacement of coarse aggregates with 0%, 10%, 20%, 30% and 40% recycled coarse aggregates were studied. The water cement ratio was kept constant at 0.38. It was observed that workability of concrete was decreased with the increase in recycled aggregates in concrete.
I. INTRODUCTION
In the era of construction, concrete has been the leading building material since it was discovered and found viable for future due to its durability, easy maintenance, wide range of properties and adaptability to any shape and size. Concrete is the composite mix of cement, aggregates, sand and water. Concrete have high compressive strength and low tensile strength. To overcome this shortcoming, steel reinforcements are used along with the concrete. This type of concrete is called reinforced cement concrete (RCC).
Concrete structures that are designed to have service lives of at least 50 years have to be demolished after 20 or 30 years because of deterioration caused by many agents. Old buildings require maintenance for better and higher economics gains. The rate of demolition has increased
and there is a shortage in dumping space and also
this demolished concrete, use of demolished as recycled concrete would not only reduce the cost but also will conserve the non renewable energy sources. The use of demolished concrete will further result in reduction in use of natural aggregates.
EXPERIMENTAL PROGRAMME General
and strength, workability and durability to be attained. Concrete mix design guidelines are given in IS: 10262-1982. In the study, 5 batches of mixes were prepared. These batches were designated as m0, m1, m2, m3 and m4. Batch m0
was taken as control mix. The natural coarse aggregate was replaced by recycled aggregate in proportion of 0%, 10%, 20 %, 30% and 40% in m0, m1, m2, m3, and m4 respectively as given in table 1.
Table 1 Proportions of Natural and Recycled Aggregates in Batches
Type of Mix Used Recycled Aggregate (%) Natural Aggregate (%)
m0 0 100
m1 10 90
m2 20 80
m3 30 70
m4 40 60
MATERIAL PROPERTIES
The physical and mechanical properties of all ingredients like sand, natural coarse aggregates, cement and demolished coarse aggregates are per IS: 2386-1963 were determined.
Cement
OPC (Ordinary Portland Cement) of grade 43 was used which conformed to IS: 8112-1989. Testing of cement was done as per IS: 4031-1968.
Natural Fine Aggregates
Natural coarse sand was used as fine aggregate. The sand conformed to zone II as per IS: 383-1970.
Natural Coarse Aggregates
Coarse aggregates of size 10mm and 20mm were used.
Water
Properties of water used were as per clause no. 5.4 of IS 456-2000. It was free from deleterious materials. Water was used for mixing and curing of concrete. Portable water is generally taken for mixing and curing of concrete.
Mix Proportion
As per design of concrete mix M40, the ratio of cement, fine aggregate and coarse aggregate was taken as 1:1.23:2.52 respectively.
Sizes of Moulds Table 2
S.No. Moulds Size(mm×mm) Specimen Casted
1. Cube 150×150×150 Compressive Strength 2. Beam 100×100×500 Flexural Strength 3. Cube 150×150×150 Sulfate Resistance
Number of Samples Casted Table 3
Type of Mix For Compressive Strength For Flexural Strength For Sulphate Resistance Total
m0 12 9 6 27
m1 12 9 6 27
m2 12 9 6 27
m3 12 9 6 27
m4 12 9 6 27
RESULTS AND DISCUSSION OF REULTS Testing of sample was done at 7, 28, 56 and 90 days for compressive strength. For flexural strength testing of samples was done at 7, 28 and 90 days. Testing for sulphate resistance was done at 7, 28 and 56 days. In this chapter, results of these tests are discussed along with the results of workability.
Workability
Workability varied with change in proportion of demolished aggregates. The slump values and compaction factor values did not show a uniform pattern as the percentage of demolished aggregates was uniformly varied. Figure 1 gives the variation of slump values versus type of mixes. Figure 2 gives the variation of compaction factor versus type of mixes.
Figure 1. Variations of Slump Values with Type of Mix Used
Figure 2. Variations of Compaction Factor Values with Type of Mix Used.
Variation of Compressive Strength with Age Table 4 gives the test results of compressive strength at 7, 28, 56 and 90 days. Water cement ratio was kept as 0.38 for all mixes. Super
plasticizer used was 0.6% of cement. Table 5 gives the percentage reduction in compressive strength for all mixes at different number of days.
42 43
40
38
40
34 36 38 40 42 44
m0 m1 m2 m3 m4
S
lu
m
p
valu
e (
m
m
)
Type of Mix
Slump Variation
0.842
0.865
0.843
0.828 0.826
0.8 0.81 0.82 0.83 0.84 0.85 0.86 0.87
m0 m1 m2 m3 m4
Com
p
ac
tion F
ac
tor
V
alu
es
Type Of Mix
Table 4. Test Results for Compressive Strength
S.No. Mix W/C Compressive strength (MPa)
7 Days 28Days 56 Days 90 Days
1. 2. 3. 4. 5.
m0 m1
m2 m3 m4
0.38 0.38 0.38 0.38 0.38
42.43 42.47 41.84 42.60 40.27
50.06 50.36 50.20 49.11 52.36
51.20 50.89 50.68 50.68 53.24
51.8 51.23 50.80 51.4 53.26
Table 5. Percentage Reduction in Compressive Strength at Different Ages.
S.No. Mix Age (in
days)
%age Reduction in Compressive Strength
m0 m1 m2 m3 m4
1. 2. 3. 4.
1:1.23:2.52 1:1.23:2.52 1:1.23:2.52 1:1.23:2.52
7 28 56 90
- - - -
100.1 100.5 99.4 98.8
98.6 100.3
98.8 98
100.4 98.1 98.9 99.2
95 104.5
106 104
Figure 3 shows the comparison of compressive strength of different mixes at 7, 28, 56 and 90 days.
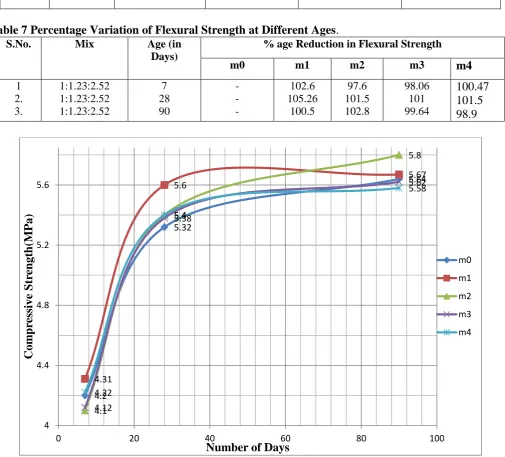
Figure 3. Comparison of Compressive Strength of all Five Mixes with Age of 7, 28, 56 and 90 Days. Variation of Flexural Strength with Age
Table 6 gives the test results of flexural strength at 7, 28, and 90 days. The results of flexural
strength are the average of 3 beams. Table 7 shows the percentage reduction in flexural 42.43
50.06
51.2
51.8
42.47
50.36 50.89
51.23
41.84
50.2
50.68 50.8
42.6
49.11
50.64
51.4
40.27
52.36
54.24 54.26
40 45 50 55
0 7 14 21 28 35 42 49 56 63 70 77 84
Com
p
re
ssi
ve
str
en
gt
h
(M
P
a)
Number of Days
m0
m1
m2
m3
strength for all mixes at different ages. Figure 4 shows the comparison of flexural strength at ages
of 7,28 and 90 days.
Table 6. Results of Flexural Strength
S.No. Mix W/C Flexural strength (MPa)
7 Days 28Days 90 days
1. 2. 3. 4. 5.
m0 m1
m2 m3 m4
0.38 0.38 0.38 0.38 0.38
4.20 4.31 4.10 4.12 4.22
5.32 5.60 5.40 5.38 5.40
5.64 5.67 5.8 5.62 5.58
Table 7 Percentage Variation of Flexural Strength at Different Ages.
S.No. Mix Age (in
Days)
% age Reduction in Flexural Strength
m0 m1 m2 m3 m4
1 2. 3.
1:1.23:2.52 1:1.23:2.52 1:1.23:2.52
7 28 90
- - -
102.6 105.26
100.5
97.6 101.5 102.8
98.06 101 99.64
100.47 101.5 98.9
Figure 4. Comparison of Flexural Strength of all Mixes at 7, 28 and 90 days.
Sulphate Resistance of RCA Concrete
In this section of study, effect of sulphate solution
investigated. Concrete cubes were kept in MgSO4
(magnesium sulfate) solution for 7, 28 and 56 4.2
5.32
5.64
4.31
5.6
5.67
4.1
5.4
5.8
4.12
5.38
5.62
4.22
5.4
5.58
4 4.4 4.8 5.2 5.6
0 20 40 60 80 100
Com
p
re
ssi
ve
S
tr
en
gt
h
(M
P
a)
Number of Days
m0
m1
m2
m3
days after normal curing for 28- days. Compressive strength of cubes was checked by using CTM. Table 8 gives the test results at age
of specified number of days. Table 9 gives the details of percentage reduction in compressive strength at the age of specified number of days.
Table 8 Test Results for Sulphate Resistance
S.No. Mix Type Of Solution Compressive Strength(MPa)
7 Days 28 Days 56 Days
1. 2. 3. 4. 5.
m0 m1 m2 m3 m4
5%of MgSO4
5%of MgSO4
5%of MgSO4
5%of MgSO4
5%of MgSO4
41.75 41.79 38.8 41.8 39.53
48.74 49.05 48.26 45.6 50.73
48.3 49.23 47.62 49.03 49.38
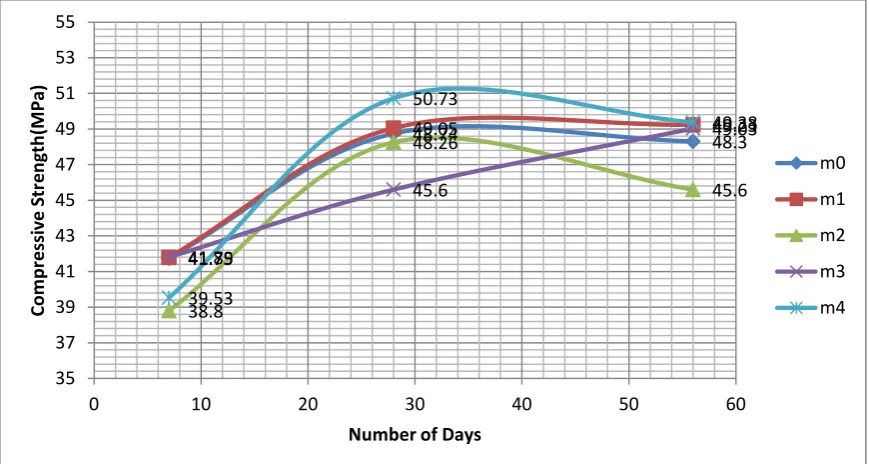
Table 9. Percentage Reduction of Compressive Strength Due To Sulphate Attack
S.No. Mix Type of solution
% age reduction in compressive strength 7 Days 28 Days 56 Days 1.
2. 3. 4. 5.
m0 m1 m2 m3 m4
5%of MgSO4
5%of MgSO4
5%of MgSO4
5%of MgSO4
5%of MgSO4
98.42 98.4 92.73
98.2 98.17
97.38 97.4 96.13 92.85 96.9
94.3 96.08 93.96 95.4 92.75
Figure 5 gives the comparison of compressive strength of all mixes kept in MgSO4 solution at the age of
7,28 and 56 days.
Figure 5. Comparison of Compressive Strength of all Mixes Kept in Mgso4 Solution at the Age of 7, 28 And
56 Days. CONCLUSIONS
Following conclusions can be drawn from results and discussion of results from the study:
1. The compressive strength of all mixes exceeded at the age of 28 days. Compressive strength of control mix i.e. of 41.75
48.74 48.3
41.79
49.05 49.23
38.8
48.26
45.6
41.8
45.6
49.03
39.53
50.73
49.38
35 37 39 41 43 45 47 49 51 53 55
0 10 20 30 40 50 60
Co
m
p
re
ssi
ve
S
tr
e
n
gth
(M
Pa)
Number of Days
m0
m1
m2
m3
m0 is 50.05 MPa which is greater than the target strength of 48.25 for M40 concrete. Compressive strength of m1 is slightly increased to 50.36. So the compressive strength increases by 0.5%. For m2, compressive strength is increased to 50.20 MPa, it also showed an increase in compressive strength by 0.3%. Compressive strength of m3 is decreased to 49.11 MPa that showed a decrease in compressive strength by 1.9%. But in case of m4, there is sudden increase in compressive strength that raises the compressive strength to 52.36 MPa. Compressive strength is increased by 4.5%. So the results of test show that compressive strength does not follow a regular trend from m0 to m4. But from the results it is also concluded that compressive strength never went below the target strength for 28 days. This indicates that RCA can be used as replacement aggregates for compressive strength. 2. Flexural strength also followed the same
pattern as of compressive strength. Flexural strength of control mix is 5.32MPa at age of 28 days. Flexural strength of mix m1 increased to 5.60 MPa. It shows that the increase in flexural strength is 5% for m1. For m2 flexural strength at age of 28 days is 5.40MPa, which shows an increase in flexural strength by 1.5%. Flexural strength of mix m3 is 5.38 and the flexural strength increased by 1 %. For the mix m4, flexural strength is 5.40 MPa. It shows that the flexural strength increased by 1.5 % at the age of 28 days. From the results and discussion of the results it is found that the flexural strength of RCA concrete is comparable to the natural aggregate concrete which is a positive point. So the
RCA concrete can be used for flexural strength by adjusting W/C ratio.
3. Use of 5% of MgSO4 solution caused the
reduction in compressive strength. The compressive strength of RCA mixed concrete reduced upto 7%. Effect of sulphate solution increased when quantity of demolished concrete aggregate increased. This study showed that the strength of m4 at 56 days was most affected. So with increase in sulphate caused reduction in compressive strength of concrete.
4. It was found that the RCA concrete have relatively lower bulk density, specific gravity and high water absorption as compared to natural concrete. This was due to the presence of mortar in present on recycled coarse aggregates.
5. In this study, trial castings were done to arrive at water content and desired workability. So it was advisable to carry out trial castings with demolished concrete aggregate proposed to be used in order to arrive at the water content and its proportion to match the workability levels and strengths requirements respectively. 6. From this study it was observed that the
demolished concrete was viable source for construction of concrete pavements. Economical and environmental pressures justify suitability of RCA concrete as alternative to the natural concrete. Where there is non-availability of natural aggregate from new rocks RCA can be a good or viable replacement option for natural coarse aggregate in pavement construction.
REFERNENCES
1. Abou-Zeid, M.N., Shenouda, M.N., McCabe, S.L., and El-Tawil, F.A. (2005). “Reincarnation of Concrete,” Concrete International, V. 27, No.2, February 2005, pp. 53-59.
2. Ajdukiewicz, A., and Kliszczewica, A. (2002). “Influence of Recycled Aggregates on Mechanical Properties of HS/HPS,” Cement and Concrete Composites, V. 24, No. 2, 2002, pp. 269-279.
3. Bairagi, N. K., Vidyadhara, H. S., and Ravande, K. (1990). “Mix Design Procedure for Recycled Aggregate Concrete,” Construction and Building Materials, V. 4, No. 4, December 1990, pp. 188-193.
4. Buyle-Bodin, F., “Influence of industrially produced recycled aggregates on flow of properties of concrete.” Materials and structures/ Mate’riauxet. Construction, Vol. no. 35, September-October 2002,pp 504-509.
5. Chen, H.J., Yen, T., and Chen, K.H. (2003). “Use of Building Rubbles as Recycled Aggregate,”Cement and Concrete Research, V.33, No.1, pp. 125-132.
6. FHWA. (2004). “Transportation Applications Of Recycled Concrete Aggregate: FHWA State of the Practice National Review September 2004,” U.S. Department of Transportation, Federal Highways Administration, Washington, DC. GTAA. (2007). “Reducing, Reusing
and Recycling Terminal 2,” Toronto Pearson Today: Terminal 2, Terminal 2 Commemorative Issue, Greater Toronto Airports Authority, Toronto, ON.
7. Hansen, T.C., and Hedegard, S.E. (1984). “Properties of Recycled Aggregate Concretes as Affected by Admixtures in Original Concretes,” ACI Journal, January-February 1984, pp. 21-26.
8. Harrington, J. (2004). “States Achieve Recycling Success,” Roads and Bridges, V.42, No.7.
9. Hendricks, Ch. F., “Use of Recycled materials in constructions”, Materials and structures/ Mate’riauxet. Construction, Vol. no. 36, November 2003,pp 604-608. 10.IS: 456-2000, “Indian Standard Code of
practice for plain and reinforced concrete”, (second revision), Bureau of Indian Standard, New Delhi.
11.IS: 383-1963, “Indian Standard Specifications for Coarse and Fine Aggregate from Natural Sources for Concrete”, Bureau of Indian Standard, New Delhi.
12.IS: 516-1959, “Methods of Tests for Strength of Concrete”, Bureau of Indian Standard, New Delhi.
13.IS: 10262-1982, “Recommended Guidelines for Concrete Mix design”, Bureau of Indian Standard, New Delhi. 14.IS: 2386(Part-1)-1963, “Methods of Test
for Aggregate for Concrete (Part-1 Particle Size and Shape)”, Bureau of Indian Standard, New Delhi.