www.ijaer.in Page 129
COMPARATIVE POST WEANING GROWTH PERFORMANCE AND
SEXUAL BEHAVIOR TRAIT EVALUATION OF CROSSBRED SHEEP
UNDER DIFFERENT NUTRITIONAL MANAGEMENT
Genet Berhe1, Yoseph Mekasha2, Mengistu Urge3
1,3 School of Animal and Range Sciences, Haramaya University, Ethiopia 2 International Livestock Research Institute Directorate, Hawassa Ethiopia
ABSTRACT
www.ijaer.in Page 130 nutrition. This may be due to the growth of sex hormones that stimulates sexual behavior of the experimental animals.
Keywords: body condition, body weight, , heart girth, performance, weight gain
INTRODUCTION
www.ijaer.in Page 131
Black Head Ogaden×Dorper and Hararghe Highland × Dorper crossbred ewe under different nutritional management.
MATERIALS AND METHODS The Study Area
The experiment was conducted at Haramaya University Sheep Farm. Haramaya University is located 515 km east of Addis Ababa, at latitude of 9o N and longitude of 42o E. The site is situated at 1950 meter above sea level and has a mean annual rainfall of 790 mm and a mean annual temperature of 16oC (Mishra et al., 2004).
Experimental animals and management
Before the beginning of the actual experiment, sheep house was cleaned and disinfected. The experimental pens, feeding and watering troughs were also carefully cleaned. Water was provided at all times. Supplementary feed was offered (every day at 04:30 p.m) after grazing throughout the experimental period. The experimental animals were randomly assigned to the two nutritional levels (0.9% and 1.5% of their body weight of concentrate supplementation). The experiment was started in October and lasted in May. All of the animals were routinely checked for any health problems and vaccinated against common diseases as well as dewormed and sprayed against internal and external parasites in the area every month.
Experimental Design, Treatments and Feeding Management
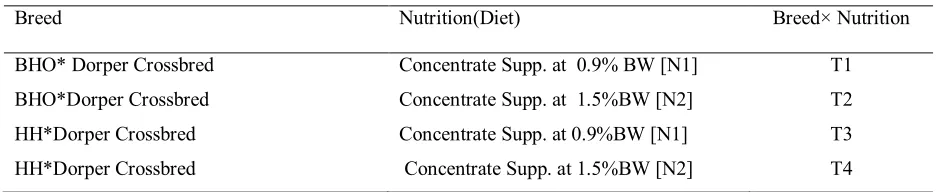
www.ijaer.in Page 132 Table .1 Treatment combinations
Breed Nutrition(Diet) Breed× Nutrition
BHO* Dorper Crossbred Concentrate Supp. at 0.9% BW [N1] T1 BHO*Dorper Crossbred Concentrate Supp. at 1.5%BW [N2] T2 HH*Dorper Crossbred Concentrate Supp. at 0.9%BW [N1] T3 HH*Dorper Crossbred Concentrate Supp. at 1.5%BW [N2] T4 BHO =Black Head Ogaden sheep; HH = Hararghe Highland sheep
Data Collection and Measurements
Post-weaning growth performance of ewes
Live weight of ewe was recorded at 10 days interval, at 8:00 hrs in the morning before feeding throughout the experimental period. Average daily body weight gain (ADG) was calculated as the difference between final live weight and initial live weight divided by the number of days of the feeding trial as described by Malau-Aduli et al. (2004).
ADG = (WF-WI) ×1000 D
Where: ADG g = Average daily body weight gain (gm); WI kg = Initial body weight; WF kg = Final body weight and D = number of days from starting to the end of the experiment (190), but if the number of days of the experimental period is long (above 90 days) a regression analysis was used by entering the data from initial until end of the experiment, if the data is available. So, this is done by using regression analysis. Body condition was evaluated subjectively using the five point scale (ranging from 1=very thin, 2=thin, 3=average, 4=fat, 5=very fat/obese) Hassamo
et al. (1986). Sets of measurements were taken for the body measurements; Body length (BL), Rump height (RH), Wither height (WH), Heart girth (HG), Chest depth (CD), Forecanone length (FL) and Fore canone circumference (FC).Most of these linear body measurements are measured using tailor measuring tape. Rump height, chest depth and wither height is measured by using a metal measuring tape.
Sexual behavior traits of ewe crossbreeds
www.ijaer.in Page 133 Ewes and rams were kept together in a paddock for forty minute twice a day during the experimental period (morning at 8:00 O’clock and evening at 11:30). After introduction of the ram, ewes were closely monitored for manifestation of behavioral estrus at least for 30 minute. All the activities of ewes were recorded immediately. Each ewe was considered to be in estrus when she was directly observed to accept a mount from a ram (Romano et al. 2000)
Chemical analysis of feeds
Chemical analysis of concentrates and natural pasture were carried out at Haramaya University animal nutrition laboratory. The grasses, mostly dominated by Hypernia rufa, were harvested by using 1m×1m quadrant at the ground level. From each quadrant fresh weight of harvested samples was taken immediately by using a sensitive balance. For further chemical analysis, a composite sample was taken from the bulk samples. Part of the sample was dried in a forced draft oven at 105 OC overnight for dry matter determination. The other part of the samples was dried at 60OC to a constant weight for chemical analysis. Oven dried feed samples were thoroughly mixed by feed type and ground to pass through 1 mm sieve size. The sample of feed offered was analyzed for DM, Ash and nitrogen according to the procedure AOAC (1990). Nitrogen (N) content of the feed was determined by Kjeldahl method and crude protein was estimated as N×6.25. The neutral detergent fiber (NDF), acid detergent fiber (ADF), acid detergent lignin (ADL) contents were analyzed according to the procedure of Van Soest et al.
(1991)
Statistical Analysis
The experiments on post weaning growth and sexual behavioral traits performance of crossbred sheep were laid out in a 2×2 factorial arrangement with two levels of breed group (BHO*Dorper and HH*Dorper) and two levels of nutrition (concentrate supplementation at 0.9% and 1.5% of the live body weight). These data were analyzed using the General Linear Model (GLM) procedure in Statistical Analysis System (SAS, 2003). The models used for analysis of the data sets are described here under. Model 1. Postweaning growth performance of females and sexual behavior of female sheep
yijkl = µ +bi + fj + (b x f)ij + eijk Where:
yijkl = Body weight and linear body measurements µ = Overall Mean
www.ijaer.in Page 134 fj = fixed effect of the jth level of nutrition (grazing + concentrate supp either at 0.9% or 1.5%)
(b×f)ij= the fixed effect of the interaction of ithbreed type and jth nutrition eijk = random error
RESULTS AND DISCUSSION
Chemical Composition of Experimental Feeds
Chemical composition of the experimental feeds is presented in Table 2. The CP content of noug seed cake to 30.9 and 30.4 reported by Belay (2008) and Temesgen (1995) respectively. The CP content of wheat bran was close to the value of 16.5% reported by Solomon et al (2004), 16.4% reported by Tekeba (2005) and 16.7% reported by Zemichael (2007). The CP content of the mixture of noug seed cake and wheat bran was in between the values recorded for noug seed cake and wheat bran. This is comparable to 23.6 % reported by Belay (2008) but higher than 21.95% reported by Tesfaye (2009). The ADF content of noug seed cake was with 29.7% reported by Zewdie (2010). The NDF content of noug seed cake was found to be 34%. This result is comparable with 33.1% reported by Zewdie (2010). The ADL content of the mixture of noug seed cake and wheat bran was 5.48%. This is comparable to 5.8% reported by Tesfaye (2009). The NDF and ADF content of wheat bran was agreement with Fentie (2007) who reported 44.15% and 12.4% of NDF and ADF, respectively. In this study attempt was also made to monitor chemical composition of the natural pasture used for grazing purpose. Thus, during spring (short rainy season) the fiber composition (NDF and ADF) of the pasture was low as compared to the dry season. On the other hand, the composition of crude protein (10%) was higher during the rainy season and lower during the dry spell (6.32%). This shows that the natural pasture used for grazing in the current study is sufficient to maintain body weight of the animals only during the short rainy season. However, to maximize production and exploit the genetic potential of improved genotypes, differential level of supplementation with better nutrients is necessary across the different seasons of the year.
Table.2. Chemical Composition of the experimental feeds
Item (DM%)
Agro-industrialbyproducts Pasture harvested at different seasons
WB NSC WB + NSC Earl dry season Dry season Short rainy season
DM 91 94 92.2 92 91.5 92
ASH 4.6 9 8.5 11.1 8.7 8.6
ADF 14 28 20.4 51.5 54 47.8
www.ijaer.in Page 135
ADL 4 10.4 5.8 9 9.6 8.5
CP 16.9 29.6 23.5 5.4 6.3 10
DM=dry matter, ADF= acid detergent fiber, NDF= neutral detergent lignin, ADL=acid detergent lignin, CP= crude protein, NSC= Nouge Seed Cake, WB=Wheat Bran
Post weaning growth performance of crossbred sheep Post- weaning average daily weight gain
www.ijaer.in Page 136 T1=BHO*Dorper + Concentrate Supp at 0.9% BW; T2= BHO*Dorper + Concentrate supplementation at 1.5% BW; T3=HH*Dorper + concentrate supplementation at 0.9% BW; T4=HH*Dorper+concentrate supplementation at 1.5% BW
Figure1. Body weight change of female BHO*Dorper and HH*Dorper supplemented with concentrate at either 0.9% or 1.5% of body weight.
Table.3.Effect of breed, nutrition and their interaction on body weight change of ewes
N1=low level of nutrition, N2=high level of nutritionT1=Black head ogaden *Dorper fed low level of nutrition,
T2=Hararghe highland fed low level of nutrition, T3=Black head ogaden*Dorper fed high level of nutrition
T4=Hararghe highland *Dorper fed high level of nutrition, N1=low level of nutrition, N2=high level of nutrition, B=Black Head Ogaden *Dorper, H=Hararghe highland *Dorper
Live body weight, body condition and linear Measurements
The body weight and linear body measurements of Hararghe Highland*Dorper and Black Head Ogaden*Dorper sheep at different nutritional level are presented in Table 4. Breed had also a significant effect (p<0.05) on body condition, body weight and heart girth. Black Head Ogaden*Dorper sheep had significantly higher value of body condition, heart girth and body weight than crossbred of Hararghe Highland*Dorper sheep. The two crossbreeds did not differ significantly (p>0.05) in other linear body measurements except the traits mentioned above.
Variables IWT
(Means ± se)
FWT (Means ±se)
ADG (Means ±se)
BREED Ns Ns Ns
BHO*Dorper 20.60 ±2.76 35.53 ± 0.86 79.36 ± 4.20
HH*Dorper 19.14 ± 0.62 32.65 ± 1.09 70.38 ±4.11
NUTRITION Ns Ns *
N1(low) 19.91±0.49 32.63 ±0.92 66.66b ±3.14
N2(high) 19.58 ±0.95 35.06±1.18 81.6a ±4.27
BREED*NUTRT(T) Ns Ns Ns
T1(BHO*Dorper on N1) 21.10 ± 0.60 34.60± 0.75 69.5 ±4.44
T2(HH*Dorper on N1) 19.07 ± 0.57 31.22±1.28 64.66 ±4.26
T3(BHO*Dorper on N2) 20.10 ±1.72 36.46 ± 1.53 89.27 ± 5.60
www.ijaer.in Page 137 Table.4. Effect of breed and nutrition on body weight and other linear body measurements of
crossbred ewes
T1=Black head ogaden *Dorper sheep fed low level of nutrition, T2=Hararghe highland fed low level of nutrition, T3= Black head ogaden *Dorper sheep fed high level of nutrition, T4=Hararghe highland *Dorper fed high level of nutrition, N1=low level of nutrition, N2=high level of nutrition, B=black head ogaden*Dorper,HH=Hararghehighland*Dorper,NUT=nutrition
Relationship between body weight and other body measurements
Correlation coefficients (r) obtained among live weight and other body measurements of Black Head Ogaden*Dorper and Hararghe Highland *Dorper sheep is presented in Table 5. Correlation coefficients between body weight and other body measurements estimated for crossbreds of Black Head Ogaden and Hararghe Highland sheep were positive and highly significant (p<0.001). This result is comparable with the result of Khan et al., 20006; Solomon, 2008; the high correlation coefficient among different body measurements and body weight would imply that these measurements can be used as indirect selection criteria to improve live weight. The high correlation coefficient recorded for body weight and other body measurements in the present study suggests that either of these variables or their combination could provide a good estimate for predicting live weight of Black Head Ogaden*Dorper and Hararghe
Variables PARAMETERS
BW BL BC HG HAT CD RH HIW FC FL
BREED * Ns * * Ns Ns Ns ** ns ns
B 29.3.7 a±0 62.78±0.54 3.5a ±0.1 71.73a±
0.7 55.98±0.20 24.4±0.3 59±0.5 11.27±0.2a 7.31±0.1 11.9±0.09
H 27.0±0.8 b 61.09±0.61 3.1b±0.1 69.04b±
0.8 55.29±0.14 23.8±0.3 58.7±0.4 10.54±0.1b 7.08±0.1 11.9±0.07
NUT Ns Ns Ns Ns Ns Ns Ns ns ns
N1 27.06±0.8 61.9±0.8 3.3±0.12 70.18 ±1.1 55.1±0.6 24±0.3 58.5±0.5 10.8±0.22 7.18±0.1
11.9±0. 09
N2 28.72±0.8 61.7±0.5 3.3±0.12 70.14 ±0.8 56.2±0.4 24±0.3 59.1±0.3 10.8±0.17 7.17±0.1 12.02±0.07
BRE*NU
T Ns Ns Ns Ns Ns Ns Ns Ns ns Ns
T 1 28.98±0 .5 63.5±0 .6 3.58 ±0.14 72.67±0
.7 56±1 24.8±0.3
59.18±0
.92 11.3±0.3
7.4±0. 11 11.9±0. 16 T 2 25.46±1 .1 60.5±1 .1 3.13±0.1 6 68.11±1 .5 54.3±
0.6 23.4±0.5
57.91±0
.71 10.3±0.2
7.19±0 .15 11.8± 0.1 T 3 29.61±1
.5 62±0.7
3.51±0.1 8
70.79±1 .2
55.9±
0.5 24.06±0.4 58.87±0.65 11.1±0.3
6.98±0 .09
11.9±0. 11 T
www.ijaer.in Page 138 Highland*Dorper sheep. The two Crossbreed sheep body weight can be estimated from heart girth (Black Head Ogaden*Dorper, r=0.93 and Hararghe*Dorper, r=0.91) but numerically correlation coefficient in Black Head Ogaden*Dorper is higher than Hararghe Highland*Dorper. Generally heart girth had consistently showed the highest correlation coefficient with body weight (r=0.93) crossbreds of Black Head Ogaden with Dorper sheep. The highest association between heart girth and body weight compared to other linear measurements was in agreement with earlier findings (Atta and EL Khidir, 2004; Thiruvenkanadan,2005; Afloyan, et al., 2006; Fassae et al., 2006; Solomon, 2008). This would imply that heart girth is the best variable for predicting live weight than other measurements.
Table.5. Correlation coefficients of body weight and linear body measurements for crossbreds of HH*Dorper (bellow diagonal) and BHO*Dorper (above diagonal)
B=BHO*Dorper, H=HH*Dorper, BC=body condition, HG=heart girth, BL=body length, HAT=wither height, CD= chest depth, RH=rump height, W=body weight, HIW= hip width, FC= fore canone circumference, FL=fore canone length
Prediction of body weight from other body measurements
In order to predict body weight from linear measurements, stepwise multiple regressions was carried out where other body measurements were added, one at time, to heart girth. In estimation of body weight from body measurements in female sheep nine body measurements were utilized. The independent parameters or regressors were body length, wither height, heart girth, rump height, chest depth, canone circumfrence, canone length, hip width, body condition. The coefficient of determination (R2) indicated that heart girth succeeded in describing more variation in body weight than other linear body measurements in both crossbreds of BHO and HH with Dorper sheep. It was more important than other linear body measurements to predict body weight. Therefore, in both of the two breeds, live body weight could be fairly estimated from heart girth measurements. In both breeds, second to heart girth, body length was more
B(F) BW BL BC HG HAT CD RH HIW FC FL
H(F) *** *** *** *** *** *** *** *** ***
W 0.88 0.6 0.93 0.75 0.86 0.76 0.74 0.84 0.64 BL 0.85 0.46 0.88 0.75 0.87 0.77 0.66 0.86 0.68
BC 0.49 0.36 0.6 0.43 0.52 0.39 0.46 0.47 0.34 HG 0.91 0.87 0.5 0.78 0.89 0.79 0.75 0.88 0.65
HAT 0.81 0.82 0.32 0.83 0.86 0.94 0.39 0.81 0.77 CD 0.87 0.8 0.39 0.92 0.86 0.85 0.56 0.87 0.73 RH 0.83 0.87 0.34 0.85 0.92 0.86 0.42 0.82 0.76
HIW 0.82 0.79 0.49 0.83 0.75 0.76 0.8 0.58 0.35 FC 0.76 0.7 0.46 0.72 0.66 0.69 0.68 0.65 0.72
www.ijaer.in Page 139 precisely predicted body weight. The better association of body weight with heart girth was possibly due to relatively larger contribution to body weight of heart girth which consists of bones, muscles and viscera (Thiruvenkadan, 2005). To predict body weight using heart girth, the following regression equations were suggested for each breed For female crossbred of Black Head Ogaden and Dorper sheep,
y= -47.67 + 1.07x
For female crossbreds of Hararghe Highland and Dorper sheep,
y= -38.25 + 0.95x
Where y and x are body weight and heart girth, respectively.
Table.6 .Prediction of body weight from other linear body measurements crossbred (HH* Dorper) sheep
Equation BHO*Dorper Inter Parameter
R2 MSE
a + βx A β1 β2 β3 β4 β5 β6 β7 β8 β9
HG -47.67 1.07 0.80 2.19
HG+BL -49.2 0.78 0.35 0.81 2.1
HG+ BL+HAT -52.38 0.71 0.3 0.19 0.82 2.08
HG +BL+HAT+CD -51.99 0.71 0.3 0.18 0.04 0.82 2.09 HG +BL+HAT+CD
+RH -51.95 0.71 0.3 0.19 0.04 -0.02 0.82 2.1 HG +BL+HAT+CD
+RH + HIW
-53.8 0.41 0.23 0.31 0.20 0.04 1.24 0.83 2.01
HG +BL+HAT+CD
+RH + HIW +FC -55.32 0.49 0.28 0.35 0.22 0.05 1.17 -1.42 0.84 1.99 HG +BL+HAT+CD
+RH + HIW +FC + FL -55.24 0.49 0.28 0.35 0.22 0.05 1.17 -1.41 -0.02 0.84 2 Female HH*Dorper
HG -38.25 0.95 0.84 1.91
HG+BL -40.59 0.76 0.24 0.85 1.85
HG+ BL+HAT -43.65 0.71 0.19 0.18 0.86 1.83
HG +BL+HAT+CD -43.64 0.61 0.17 0.07 0.127 0.86 1.83 HG +BL+HAT+CD
+RH
-44.91 0.7 0.16 0.08 -0.02 0.16 0.86 1.83
HG +BL+HAT+CD
+RH + HIW -43.19 0.6 0.13 0.08 0.10 0.08 0.84 0.86 1.80 HG +BL+HAT+CD
www.ijaer.in Page 140 HG +BL+HAT+CD
+RH + HIW +FC + FL -45.81 0.51 0.07 0.05 0.13 0.02 0.77 1.63 0.70 0.88 1.7
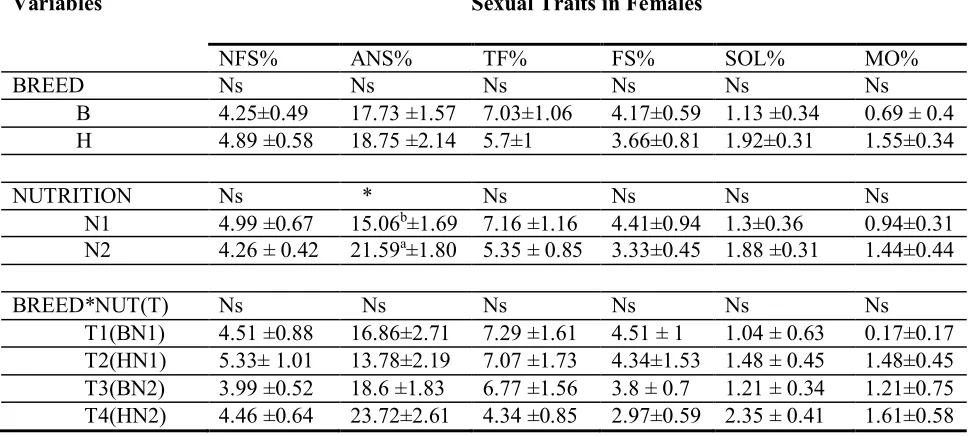
Animal production depends on superior females and males whose andrological normality will have a major impact on the fertility of the flock (Mekasha et al., 2007). The result of sexual behavior of female BHO and Haraghe highland*Dorper sheep is shown in Table7. Nutrition had a significant effect on one of the sexual behaviors; sniffing (p< 0.05).Crossbred sheep which had been fed high level of nutrition had high value of % sniffing than low level of nutrition. This may be due to the growth of sex hormones that stimulates sexual behavior of the experimental animals. But, sexual behavior between genotypes were not significantly different (p> 0.05).
Table. 7.Effect of breed and nutrition on sexual behavior of female crossbred (BHO*Dorper and HH*Dorper) sheep
NSF= nonfirm standing, ANS=anogenital sniffing, TF=tail flapping, FS=firm standing, SOL=soliciting, MO=mounting of other animals, N1=low level of nutrition, N2=high level of nutrition, B=BHO*Dorper ,H=HH *dorper , NUT=nutrition,T1=BHO *Dorper fed low level of nutrition, T2=Hararghe highland fed low level of nutrition, T3= BHO*Dorper fed high level of nutrition, T4=Hararghe highland *Dorper fed high level of nutrition
CONCLUSION
This study was evaluated the effect of breed and nutrition on post weaning growth performance and sexual behaviour trait evaluation of crossbreed (BHO*Dorper and HH*Dorper) sheep. The two nutritional levels included supplementation with concentrate either at 0.9% or 1.5% of their body weight. Concentrates were composed of wheat bran and noug seed cake at a ratio of 2:1.
Variables Sexual Traits in Females
NFS% ANS% TF% FS% SOL% MO%
BREED Ns Ns Ns Ns Ns Ns
B 4.25±0.49 17.73 ±1.57 7.03±1.06 4.17±0.59 1.13 ±0.34 0.69 ± 0.4 H 4.89 ±0.58 18.75 ±2.14 5.7±1 3.66±0.81 1.92±0.31 1.55±0.34
NUTRITION Ns * Ns Ns Ns Ns
N1 4.99 ±0.67 15.06b±1.69 7.16 ±1.16 4.41±0.94 1.3±0.36 0.94±0.31
N2 4.26 ± 0.42 21.59a±1.80 5.35 ± 0.85 3.33±0.45 1.88 ±0.31 1.44±0.44
BREED*NUT(T) Ns Ns Ns Ns Ns Ns
www.ijaer.in Page 141 The experiment were laid out in 2×2 factorial arrangement (two breeds of sheep and two levels of nutrition) using Completely Randomized Design (CRD). The number of animals included were twenty four (four treatment ×six replication). The mean initial body weight of the crossbred sheep was 20.60 ±2.76 kg (mean ± se) and 19.14±0.62 kg (mean±se) for Black Head Ogaden ×Dorper and Dorper×Hararghe highland sheep, respectively. The age of the animals ranges from 6-8 month. Evaluation of the post weaning growth performance of crossbred sheep showed that breed, nutrition and their interaction had no significant effect (p> 0.05) on initial and final body weight in both male and female crossbred sheep. Nutrition, however, had a significant effect (p<0.05) on ADg of crossbred sheep. Thus, crossbred sheep, which were supplemented with concentrate at 1.5% body weight had significantly higher ADg of 81.6±4.27 g/d, respectively, compared to their contemporaries supplemented with concentrate at 0.9% body weight (66.66±3.14). Breed had a significant effect on body weight, body condition and heart girth. Black head Ogaden*Dorper sheep had higher body condition (3.5 ±0.1) than Hararghe highland*Dorper sheep (3.1±0.1). The two breeds did not differ significantly (p> 0.05) in the other linear body measurements except measurements discussed above. Correlation coefficients between body weight and other measurements estimated for Black head Ogaden and Hararghe highland*Dorper sheep were positive and highly significant (P<0.001). Heart girth had consistently showed the highest correlation coefficient (r=0.93) for BHO*Dorper and for HH*Dorper ( r=0.91) crossbreds. Based on this study, body weight could be better predicted using heart girth than other linear measurements as follows: y= -47.67+1.07x for BHO*Dorper and y= -38.25 + 0.95x for HH*Dorper sheep, where y and x are body weight and heart girth, respectively. Breed had a significant effect (p<0.01) on semen volume. In conclusion, this study demonstrated that Hararghe Highland*Dorper sheep showed better reproductive performance (in response of sexual behavior) than crossbreds of Black Head Ogaden *Dorper sheep. However, Black head Ogaden*Dorper sheep performed better in body weight, heart girth and body condition. Thus, it can be recommended that crossbred animals should be supplemented with concentrate at higher level of nutrition (1.5% of body weight) to exploit the genetic potential of the genotype and thereby target export market. However, under small holder farming system supplementation with 0.9% of the body weight could be used for moderate gain provided that the quality and biomass yield of the grazing pasture would be optimum.
REFERENCES
Abule E., Amsalu S. and Tesfaye A., 1998. Effect of supplementation of lablab(Golichos lablab)
www.ijaer.in Page 142 Afloyan, R. A., 2006. The estimation of live weight from body measurements in Yankasa sheep Czech. J. Anim. Sci. 51 (8): 343-348.
Aden Tekle, 2003. Evaluation of local sheep under traditional management around rural area of Dire Dawa. M.Sc. Thesis, Alemaya University, Dire Dawa, Ethiopia p. 128.
A.O.A.C (Association of Official Analytical chemists), 1990.Official methods of Analysis, 15th (ed.).A.O.A.C. INC., Arlington, virgina, USA. 1298p.
Atta, M. and O.A. El Khidir, 2004.Use of heart girth, wither height and scapuloishchial length fot prediction of live weight of Nilotic sheep. Small Rumin.Res.55:233-237.
Ayalew,W., 2000. Do smallholder farmers benefit more from crossbred (Somali_Anglo-Nubian) than from indigenous goats? PhD Thesis. Georg-August University of Gottingen, Gottingen, Germany.
Baker, R. L. and G. D. Gray, 2003. Appropriate breeds and breeding schemes for sheep and goats in the tropics; the importance of characterizing and utilizing diseases resistance and adaptation to the tropical stresses. In: Sani, R., Gray, G.D.and R.L. Baker, (Eds.), Better worm control for small ruminant in tropical Asia, Australian center for International Agricultural Research (ACIAR). Monograph No. xx.
Baker, R. L. and J. E. O. Rege, 1994. Genetic resistance to diseases and other stresses in improvement of ruminant livestock in the tropics. In: Proceedings of the fifth world congress on Genetic Applied to livestock production, vol. 20, University of Guelph, Ontairo, Canada, 7-12 Augest, 1994, pp405-412.
Balls. A., 2003. Why tropical countries are under developed. (http)://www. nber. org/digest/jun 01/w8119. html).
Basson, W. D., Van Niekerk, B. D. H., Mulder, A. M., Cloete, J. G., 1969. The productive and reproductive potential of three sheep breeds mated at 8-monthly intervals under intensive feeding conditions. Proc. S. Afr. Soc. Anim. Prod. 8: 149-154
Degen, A. A. and M. Kam, 1992. Body mass loss and body fluid shifts during dehydration in Dorper sheep. J. Agric. Sci. (Camb.) 119, 419-422.
Demeke, S., C. J. Thwaites,. and S. Lemma, 1995. Effects of ewe genotype and supplementary feeding on lambing performance of Ethiopian highland sheep. Small Rumin. Res. 15, 149- 153.
www.ijaer.in Page 143 Fentie Bishaw, 2007. Feed Utilization and Live Weight Change of Farta Sheep Supplemented With Noug Seed (Guizotia abyssinica) Cake, Wheat bran and Their Mixtures. MSc Thesis School of Graduate Studies of Haramaya University, Ethiopia. 44p.
Malau-Aduli B. S., L. O. Eduvie, C. A. M Lakpini and A.E.O. Malau-Aduli, 2004. Influence of crop residue ration supplementation on the attainment of puberty and postpartum reproductive activities of Red Sokoto does. J. Anim. Physio. Nutr.; 88:1-10.
Mishra, B. B., H. G. Kidan, K. Kibret, M. Assen and B. Eshetu, 2004. Soil and land resources inventory at Alemaya University Research farm with reference to land evaluation for sustainable agricultural management and production. Synthesis of working papers, soil sciences Bulletein No.1, pp. 123. Alemaya University, Ethiopia.
Peters, K. J., 1989. Trends in On-Farm Performance Testing of Small Ruminants in sub-Saharan Africa. In: Wilson, R. T. and M. Azeb, (eds). African Small Ruminant Research and Development. I. L. C. A., Addis Ababa, Ethiopia. pp. 439-469.
Romano JE, CJ. Christians, and BG. Crabo, 2000. Continuous presence of rams hastens the onset of estrus in ewes synchronized during the breeding season. Appl. Anim. Beh. Sci., 66: 65–70.
SAS (Statistical Analysis Systems), 2003. SAS for windows, release 9.1. SAs Institute Inc., Cary, NC, USA.
Schoeman, S.J., R. Burger, 1992. Performance of Dorper sheep under an accelerated lambing system. Small Rumin Res. 9, 265-281.
Sisay, L., Kassaun A., Getachew W., Adugna K., and I. Fletcher, 1989. Comparative evaluation of Menz and Awassi x Menz crossbred sheep. Reproductive and mature body weight. In:
Proceedings of the 3rd National Livestock Improvement Conference, 24-26 May 1989, Addis Ababa, Ethiopia. IAR, Addis Ababa.
Solomon Gizaw, 2008. Sheep resources of Ethiopia: Genetic diversity and breeding strategy. PhD thesis, Wageningen University, The Netherlands.
www.ijaer.in Page 144 Tekeba Eshetie, 2005. Compatiblity of quality protein maize and sesame seed meal as a substitute for synthetic amino acids in Broiler Rations. MSc Thesis the School of Graduate Studies of Alemaya University of Agriculture, Ethiopia. 46p
Thiruvenkadan, A.K., 2005.Determination of best- fitted regression model for estimation of body weight in Kanni Adu kids under farmer’s management system. Livestock Research for Rural Development. Vol.3 No.1.
Temesgen Walelign, 1995. The effects of Stover of sorghum verities and protein sources on intake, digestibility and weight gain in cattle. MSc Thesis School of Graduate Studies of Alemaya University of Agriculture. 104p.
Tesfaye Tsegaye, 2009. Characterization of Goat Production Systems and On-Farm Evaluation of the Growth Performance of Grazing Goats Supplemented with Different Protein Sources. MSc Thesis Presented to the School of Graduate Studies of Haramaya University. 108p.
Van Soest, P. J., J. B. Robertson and B. A. Lewis, 1991. Methods for dietary neutral detergent fiber and non-starch polysaccharides in relation to animal nutrition. Journal of Dairy Science. 74: 3583-3597.
Winrock International , 1992. Assessment of animal agriculture in sub-Saharan Africa. Winrock International, Morrilton. Ark., USA. Pp.125.
Zemichael Gereslassie, 2007. Supplementation of sesame seed (Sesame indicum) cake, wheat bran and their mixtures on feed intake, digestibility, live weight changes and carcass characteristics of Arado sheep fed a basal diet of teff straw. MSc Thesis Presented to the School of Graduate Studies of Alemaya University of Agriculture, Ethiopia. 57p.