R E S E A R C H
Open Access
Fecal source identification using random
forest
Adélaïde Roguet
1, A. Murat Eren
2, Ryan J Newton
1and Sandra L McLellan
1*Abstract
Background:ClostridialesandBacteroidalesare uniquely adapted to the gut environment and have co-evolved with their hosts resulting in convergent microbiome patterns within mammalian species. As a result, members of
ClostridialesandBacteroidalesare particularly suitable for identifying sources of fecal contamination in environmental samples. However, a comprehensive evaluation of their predictive power and development of computational approaches is lacking. Given the global public health concern for waterborne disease, accurate identification of fecal pollution sources is essential for effective risk assessment and management. Here, we use random forest algorithm and 16S rRNA gene amplicon sequences assigned toClostridialesandBacteroidalesto identify common fecal pollution sources. We benchmarked the accuracy, consistency, and sensitivity of our classification approach using fecal,
environmental, and artificial in silico generated samples.
Results:ClostridialesandBacteroidalesclassifiers were composed mainly of sequences that displayed differential distributions (host-preferred) among sewage, cow, deer, pig, cat, and dog sources. Each classifier correctly identified human and individual animal sources in approximately 90% of the fecal and environmental samples tested.
Misclassifications resulted mostly from false-positive identification of cat and dog fecal signatures in host animals not used to build the classifiers, suggesting characterization of additional animals would improve accuracy. Random forest predictions were highly reproducible, reflecting the consistency of the bacterial signatures within each of the animal and sewage sources. Using in silico generated samples, we could detect fecal bacterial signatures when the source dataset accounted for as little as ~ 0.5% of the assemblage, with ~ 0.04% of the sequences matching the classifiers. Finally, we developed a proxy to estimate proportions among sources, which allowed us to determine which sources contribute the most to observed fecal pollution.
Conclusion:Random forest classification with 16S rRNA gene amplicons offers a rapid, sensitive, and accurate solution for identifying host microbial signatures to detect human and animal fecal contamination in environmental samples.
Keywords:Microbial source tracking, 16S rRNA gene, High-throughput sequencing,Clostridiales,Bacteroidales, Random forest classification
Background
In urban areas downstream from mixed-land use water-sheds, fecal contamination originates from multiple sources including sewage released from pipe-infrastruc-ture, upstream agricultural animals, domestic pets, and/or wildlife. Identifying the contamination source is critical for managing public health risk, but sorting out pollutant con-tributors is difficult. The specific architecture of the gut microbiome in humans and animals could be useful for
this purpose. As a result of the co-evolution between hosts and their gut microbiota driven by shared dietary regimes or host physiology [1–4], hosts have non-random and dis-tinct gut microbial community structures [5–7]. These differences can serve as signatures for fecal sources in environmental samples with complex microbial commu-nity mixtures [8].
Monitoring for traditional fecal indicator bacteria such
as Escherichia coli and enterococci does not provide
information about contamination sources as these indi-cators are found indiscriminately in warm-blooded ani-mals [9]. Yet, source information is essential for risk mitigation since gastrointestinal illnesses associated with * Correspondence:[email protected]
1School of Freshwater Sciences, University of Wisconsin-Milwaukee, Milwaukee, WI, USA
Full list of author information is available at the end of the article
exposure to contaminated waters can vary according to the host source and the pathogens they harbor. For example, the risks associated with human or cattle feces appear to be higher than with pig or avian feces [10,11].
Multiple studies have used high-throughput sequen-cing of microbial community composition and advanced computational approaches to identify contamination sources in different environments, including indoor hab-itats [12–15] and surface waters [6, 7, 16–20]. Source-Tracker [12], a state-of-the-art Bayesian classifier, is the primary platform that has been used to determine mi-crobial source contamination in mixed-assemblage or
“sink” environmental samples [6, 7, 16–20]. Although
SourceTracker could be used for fecal source identifica-tion, each new investigation requires all source and sink samples of interest to be re-analyzed de novo. This setup requires investigators to either generate microbial source (e.g., human and animal fecal samples) sequence data or mine databases for appropriate information to pair with their environmental samples, decreasing its feasibility to be used widely. We propose an alternative approach to classify fecal sources using random forest. Random for-est is one of the most accurate learning algorithms for handling large and noisy datasets [21]. Unlike Source-Tracker, the classifiers generated by random forest can be used later to rapidly classify new data rather than re-analyzing the entire dataset. Random forest is also a model that can handle unbalanced sample distributions and is less prone to overfitting, which produces unbiased classifiers [22]. This machine learning approach has been used to classify body site, subject, and diagnoses using human microbiome datasets [23], but performance has not been evaluated for fecal source identification purposes.
The majority of source identification studies examine the entire bacterial community structure [6, 7, 16–20]. However, focusing on specific taxa may be sufficient for predictions [24,25]. The two bacterial groupsClostridiales and Bacteroidales are ideal targets since they are highly abundant in the gastrointestinal tract of animals and humans [4], and contain members that show distinct host distribution patterns [8]. In this study, we developed a random forest-based classification approach to perform fecal source identification using microbial community data. We first built reference sequence databases for eight source categories using amplicon sequences generated from the V6 and V4V5 regions of the 16S rRNA gene: human (sewage), cat, cow, dog, deer, pig, pet (cat and dog), and ruminant (cow and deer). Using these fecal source samples, environmental water samples, and in silico artificial assemblages, we then evaluated the performance ofBacteroidalesandClostridialesclassifiers to identify fecal contamination sources. Our benchmarks included assess-ment of prediction accuracy, repeatability, and sensitivity of each classifier for each animal group.
Methods
Random forest application to source tracking
Theory
Random forest, developed by Breiman [26], is an ensem-ble learning method, i.e., a strategy that aggregates many predictions to reduce the variance and improve robust-ness and precision of outputs [27]. Particularly well adapted to perform classification analysis [28], this powerful statistical approach has been used successfully in a wide range of applications, including source identifi-cation using PCR markers for fecal pollution and anti-biotic resistance profiles [29, 30]. This approach appears to be suitable for source identification using sequence data because it can (i) relatively quickly analyze large datasets, e.g., sequencing datasets, (ii) provide very high classification accuracy of source, and (iii) estimate the importance for each predictor, i.e., representative sequence.
Random forest classification algorithm is based on the construction of multiple decision trees according to the bagging approach: each tree is constructed independ-ently from a bootstrap sample of the entire dataset. In addition, to avoid overfitting of the model, each decision point, so-called node, is split using the best abundance threshold among a subset of predictors randomly se-lected rather than using the best among all representa-tive sequences. The best split is based on the Gini criterion, which for each node decreases impurity as much as trees grow. To classify an unknown sample, new data are mapped along the trees built to train the model. Each tree gives a classification, so-called the vot-ing tree. The majority votes among all the tree outcomes are taken to assess the prediction.
To evaluate the accuracy of classifications, an error rate of the global prediction, so-called “out-of-bag error rate”, is estimated. For that, during tree growth, the bootstrap sample repetition omits about one-third of the training samples, constituting the out-of-bag samples. Considered as new unknown samples, out-of-bag samples are classi-fied among the different sources using the majority vote. For each model, a misclassification rate, i.e., out-of-bag error rate, is assessed by aggregating the cross-validation results between the predictions and the true sources.
The mean decrease in Gini value identifies the most reliable and relevant predictors to perform classifications. One value is associated with each individual representative sequence, reflecting the reliability to split the nodes. It is calculated by summarizing all the decreases in impurity scores associated with a given representative sequence, which is then normalized by the number of trees.
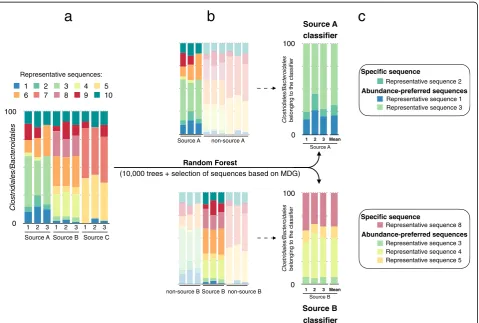
Source identification application
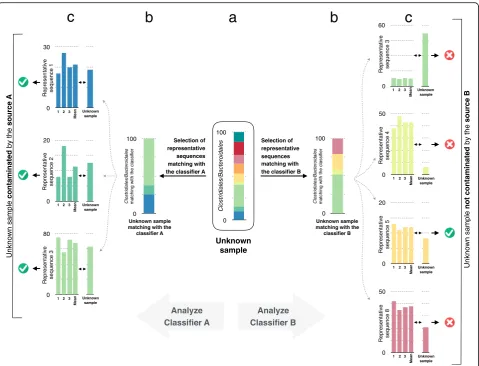
was built for each fecal source (Fig. 1). A classifier is composed of the representative sequences that are the most reliable to discriminate one source from another. These representative sequences are selected by running random forest classifications to compare samples from a given source to samples from all the other sources, i.e., the samples are divided into two classes: samples that -belong to source X and samples that do not -belong to source X. Second, for each source, the random forest algorithm is trained with the respective representative sequences selected in the first step. To classify an unknown sample, only the sequences matching the representative sequences used in a classifier are selected and their relative abundance is calculated. For each classifier, two outputs are possible. An unknown sample can be classified as “contaminated by source X” or “not contaminated by source X”. The prediction is assessed using the majority vote described previously. Roughly, it corresponds to the comparison of the sequence relative abundances between the classifier and the new samples (Fig.2).
Data collection
A total of 82 animal fecal samples, including 10 cats, 17 cows, 19 dogs, 11 deer, 16 pigs, 2 geese, 3 rabbits, and 4 raccoons, were collected between 2008 and 2016 in the USA, which included 2 cats from Australia. Samples were transported in sterile tubes and stored at−80 °C until DNA extraction. To characterize human fecal contamination, we used 17 sewage influent samples from seven cities in differ-ent states in the USA collected in a former survey between 2012 and 2013 [31], and three sewage influent samples from Reus in Spain [32] and Salvador in Brazil [33]. Finally, DNA extracted from 25 freshwater samples collected in stormwater discharges, rivers, and Lake Michigan were used in classifier analyses [34,35]. More details of sampling collection methods are reported in Additional file1.
Fecal indicator bacteria enumeration
Densities of fecal indicator bacteria were evaluated in freshwater samples using the USEPA standard methods 1603 and 1600 for Escherichia coli (E. coli) and
Representative sequence 3 Representative sequence 4 Representative sequence 5 Representative sequence 8
0 100
1 2 3
Clostridiales/Bacteroidales
Source A non-source A
non-source B Source B non-source B
0 100
1 2 3
Clostridiales/Bacteroidales
Source A
Random Forest
(10,000 trees + selection of sequences based on MDG)
Source B
Mean
Mean
Abundance-preferred sequences Representative sequence 2
Source A
Source B
0 100
1 2 3 4 5
6 7 8 9 10
Clostridiales/Bacteroidales
1 2 3 1 2 3 1 2 3
Source A Source B Source C
a
b
c
Representative sequence 3 Representative sequence 1
Abundance-preferred sequences
Representative sequences:
enterococci, respectively [36, 37]. For each sample, between 1 and 100 mL of water were filtered through a 0.45-μm pore size nitrocellulose filter (Millipore, Billerica, MA). Filters were incubated for 24 h on modified membrane-thermotolerant E. coli or mem-brane Enterococcus indoxyl-D-glucoside agar plates (Becton Dickson, USA).
Sample processing and DNA extraction
For fecal samples, bacterial DNA was extracted from ap-proximately 0.2 g of material using QIAmp DNA stool mini kit according to the manufacturer’s instructions (Qiagen, USA). A total of 25 mL for sewage influent and 200 or 400 mL for freshwater samples were filtered onto 0.22-μm mixed cellulose ester filters with a 47 mm diam-eter (Millipore, USA). DNA from filters was then extracted using the FastDNA spin kit for soil (MP Biomedicals, USA) according to the manufacturer’s instructions. One
modification of this protocol was applied: Cells were mech-anically lysed using a MiniBeadBeater-8 cell disruptor (BioSpec Products, USA) for 1 min and 2 min at room temperature for sewage and freshwater samples, respect-ively. DNA was stored at −20 °C until it was analyzed. DNA concentration was determined using a NanoDrop spectrophotometer (Thermo Fisher Scientific, USA).
Real-time quantitative PCR analysis
Three human-associated bacterial qPCR assays were per-formed on freshwater samples: sewage Lachnospiraceae, i.e., Lachno2 [38] and Lachno3 [39] and human
Bacter-oides combining the HF183F forward primer [40] with
the reverse primer and probe from Kildare et al. [41]. Freshwater samples were quantified using a StepOne Plus™ Real-Time PCR System Thermal Cycling Block using Taqman hydrolysis probe chemistry with 2X Taq-man® Gene Expression Master Mix (Applied Biosystems; 0
100
Clostridiales/Bacteroidales
Selection of representative
sequences matching with
0 100
Clostridiales/Bacteroidales
Unknown sample matching with the
0 100
Clostridiales/Bacteroidales
Unknown sample matching with the
0 30
1 Unknown
sample
23
Mean
0 20
1 Unknown
sample
23
Mean
0 80
1 Unknown
sample
23
Mean
0 60
1
Representative sequence 3
Unknown sample
2 3
Mean
0 50
1 Unknown
sample 2 3
Mean
0 20
1 Unknown
sample 2 3
Mean
0 50
1 Unknown
sample 2 3
Mean
Unknown sample
Unknown sample
contaminated
by the
source A
Unknown sample
not contaminated
b
y
the
source B
Analyze Analyze
a
b
b
c
c
Selection of representative sequences
matching with Representative sequence 4
Representative sequence 5
Representative sequence 8 Representative sequence 1
Representative sequence 2
Representative sequence 3
Foster City, CA). For each run, triplicate standard curves were generated using a linearized plasmid containing the target sequence. The slope of the standard curves varied between−3.312 and−3.404 for Lachno2,−3.394 and− 3.457 for Lachno3, and −3.195 and −3.369 for human Bacteroides. A correlation coefficient higher than 0.995 was observed for each assay standard curve. Amplifica-tion efficiencies ranged from 94.66 to 105.59%. Each method had limit of quantification of 15 gene copies per reaction.
16S rRNA gene sequencing and library construction Amplicon libraries were constructed at the Josephine Bay Paul Center at the Marine Biological Laboratory (Woods Hole, MA, USA) using the MiSeq Illumina® platform for the V4 to V5 hypervariable region and HiSeq or NextSeq Illumina® platforms for the V6 hyper-variable region. Details for amplicon library construction and sequencing procedures for the V4 to V5 regions are described in Morrison et al. [42], and for the V6 region in Eren et al. [43]. Reads were trimmed using cutadapt v1.14 [44], allowing for four mismatches in the primer sequence. Forward and reverse reads were merged using PEAR v0.9.10 [45] using the default parameters. Using Mothur 1.39.5 [46], assembled reads were discarded if they contained ambiguous bases, had more than eight successive homopolymers, or had a length smaller/ higher than 5% of the V4V5 median (372 bp) and 10% of the V6 median (60 bp). Sequences were taxonomically assigned based on the best match in a Global Alignment for Sequence Taxonomy (GAST) process [47] and the 2013 release Greengenes database [48, 49]. Only se-quences assigned toClostridialesandBacteroidaleswere selected for further analysis.
A minimum entropy decomposition (MED) analysis was performed for each bacterial group assemblage using the oligotyping pipeline version 2.1 [50]. MED uses nucleotide entropy (nucleotide variant variability) to distinguish along DNA sequence differences in nucle-otides originated from true genetic variation among or-ganisms from noise due to sequencing errors. MED partitions DNA sequences into amplicon sequence vari-ants (ASVs) according to the position in the DNA se-quence with the highest entropy. This step iteratively lasts until each final ASV satisfies the maximum entropy criterion. ASVs that do not meet the minimum substan-tive abundance (M) criterion were discarded. M was set to N/10,000 for V4V5 andN/50,000 for V6, where Nis the total number of sequences in the dataset.
Random forest classifications
To create the classifiers, 100 random forests constituted of 10,000 trees were computed using the default settings of the “randomForest” function implemented in the
randomForest R package [51]. Mean decrease Gini values were averaged for each ASV among the 100 ran-dom forest replicates. The ASVs with the first 200 high-est mean decrease Gini values were plotted in a scree plot. ASVs with mean decrease Gini values above the breakpoint curve were chosen to be part of the classifier. Breakpoints were estimated using the “breakpoints” function included in the strucchange R package [52]. Then, the relative abundance of the selected ASVs was re-calculated. To classify unknown samples, random for-est algorithm was first trained using the re-calculated relative abundance. For that, 100 random forest repli-cates of 1000 trees each were performed using the de-fault settings of the "randomForest" function. Replicates were then pooled using the“combine”function. Classifi-cation of unknown samples was assessed by extracting the probability of the voting trees using the “predict” function on trimmed and merged sequences matching the classifiers’ASVs. For the ASVs not detected in the unknown sample, a relative abundance of zero was settled.
For each unknown sample, a proxy estimating the con-tribution of contamination of the different sources was assessed by calculating the proportion of sequences that belong to a given classifier among the total number of sequences from all classifiers.
Classification of animal fecal and sewage samples
Seventy-six animal fecal and sewage samples were used to build the V6 classifiers. The predictions were tested on 23 test samples from varied animal fecal material and sewage influent.
Classification of contamination in freshwater samples
Freshwater samples were classified using random forest algorithm as described above. A total of 25 samples were used for V6 classifier assessment.
Classification of artificial bacterial assemblages
from freshwater samples. Fecal source sequences in these in silico generated mixes ranged from 0.01 to 20% of the total sequence count.
V4V5–V6 classification comparison
Performance of the classifiers was also tested on V4V5 region of the 16S rRNA gene amplicons and compared with the V6 classifier outputs. To make a direct com-parison, classifiers for V4V5 and V6 were built inde-pendently using 33 animal fecal and sewage samples sequenced in both regions. Prediction accuracy was eval-uated using an additional 12 test samples sequenced in both regions (see Additional file1for more details).
All analyses were conducted using the statistical envir-onment R version 3.3.2 [54].
Robustness of the predictions
Accuracy and robustness of the random forest classifica-tions were estimated by repeating the training and the prediction of the “unknown samples” steps 100 times and computing the mean and the standard deviation of voting tree probabilities.
Results
Development and attributes of the V6 classifiers
Six fecal sources were used to create the classifiers, in-cluding samples from 9 cats, 15 cows, 9 deer, 15 dogs, 14 pigs, and 14 sewage samples to represent humans. Overall, 48% of the V6 sequences were assigned to Clos-tridiales and 35% to Bacteroidales in the animal fecal samples. In sewage samples, Clostridiales and Bacteroi-dalesrepresented on average of 12% and 13% of the total sequences, respectively. For both orders, the MED ana-lysis retained 90% of the total sequences, i.e.,
21,965,364 Clostridiales sequences and 15,900,401
Bacteroidales sequences. These sequences were
clus-tered into 2724 amplicon sequence variants (ASVs)
for Clostridiales and 1479 ASVs for Bacteroidales.
The bacterial assemblage for both bacterial groups was more consistent in the sewage samples than in the animal fecal samples (Bray–Curtis (BC) dissimilar-ity index, Clostridiales: BCanimal(intra sources)= 69 ± 19%,
BCsewage= 29 ± 7%; Bacteroidales: BCanimal(intra sources)
= 74 ± 23%, BCsewage= 37 ± 15%, Additional file 3). One classifier was built for each source by selecting the sequences with the highest mean decrease in Gini values. In addition to the six sources investigated, a“Pet” and a “Ruminant” classifier were built by merging the Cat/Dog, and Cow/Deer samples, respectively. These two extra sources were created after preliminary investi-gations, which revealed high out-of-bag error rate within Cat, Dog, Cow and Deer samples, resulting from shared ASVs between sources. About the same number of ASVs were selected within the classifiers for both bacterial groups, with an average of 69 and 55 ASVs for Clostri-dialesand Bacteroidales, respectively (Additional file 4). Overall, ~ 17% of the total sequences within each bacter-ial group comprised the classifiers (Fig.3). However, for the animal sources, the proportion of sequences belong-ing to the different classifiers was higher for Bacteroi-dalescompared withClostridiales (Fig.3). In addition, a relatively low proportion (30%) of the unique ASVs comprising the classifiers were found exclusively in a single fecal source, and these were at low abundance, except for the Cat–Clostridiales/Bacteroidales and Dog–Clostridiales classifiers, which had no exclusive ASVs (Additional file 4). This result indicates that a large proportion of ASVs selected in the classifiers
0.00 0.25 0.50 0.75 1.00
Cat Dog Pet Cow DeerRuminant Pig Sewage
Relativ
e
ab
undance
0.00 0.25 0.50 0.75 1.00
Cat Dog Pet Cow DeerRuminant Pig Sewage
Relativ
e
ab
undance
Seq. belonging to:
none of the classifiers another classifier classifier
Clostridiales Bacteroidales
a
b
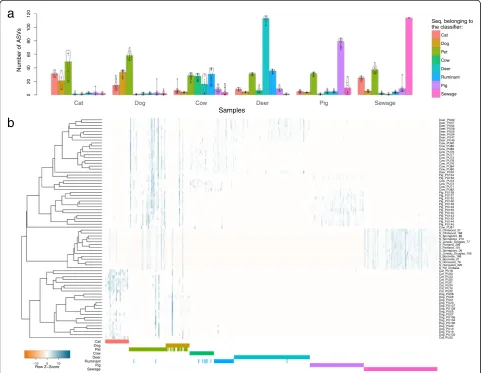
were source-preferred (Fig. 4a), i.e., ASVs were common to multiple sources, but with distinct abun-dance patterns for specific sources. Differences be-tween sources in the assemblage of the ASVs selected in the classifiers are visualized on Fig. 4b and Additional file 5. Despite the intra-source variability, distinctive inter-source patterns allowed for discrimin-ation of sample sources.
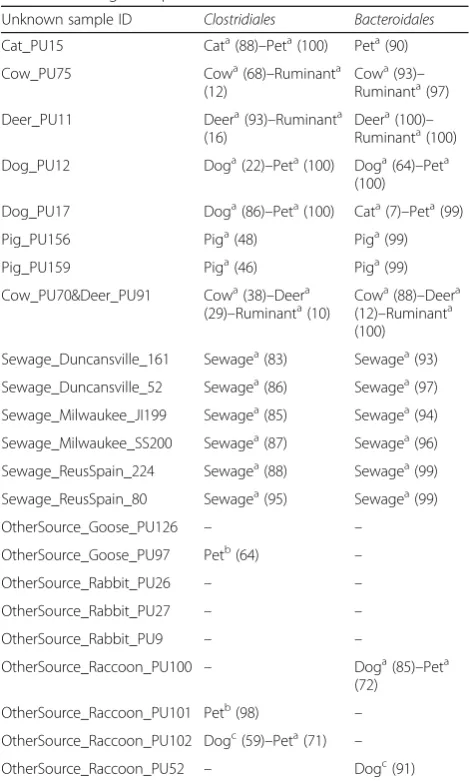
Classifications of animal fecal and sewage samples The specificity of predictions was evaluated on 14 ani-mal and sewage samples collected from different loca-tions, and not used to create the V6 classifiers (Additional file 1). Overall, predictions obtained from Clostridiales and Bacteroidales classifiers were compar-able (Tcompar-able 1). Both bacterial order classifiers correctly identified the fecal signature in cow, deer, pet, pig,
ruminant, and sewage. Misclassifications occurred for
the Bacteroidales classifiers on samples Cat_PU15 and
Dog_PU17, but when considered as the pet group, they were correctly classified. The proportion of ASVs match-ing with each source classifier within the test samples was significantly higher for the Bacteroidales classifiers than the Clostridiales classifiers (Mann–Whitney, W= 228.5, nClo.= 18, nBac= 16, P= 0.004), suggesting more shared signature sequences inBacteroidales.
The specificity of predictions was also tested on nine animal fecal samples from hosts not used as classifier sources, i.e., goose, rabbit, and raccoon. In general, samples were not classified to the eight fecal sources studied (Table 1). Five samples were misclassified as a
“Dog” and/or “Pet” by eitherClostridiales and
Bacteroi-dales classifiers, but not by both bacterial group classi-fiers at the same time.
Cat Dog Pet Cow Deer Ruminant Pig Sewage
Seq. belonging to the classifier:
Cat Dog Cow Deer Pig Sewage
Samples
Number of ASVs
0
20
40
60
80
100
120
a
b
Classification of environmental samples
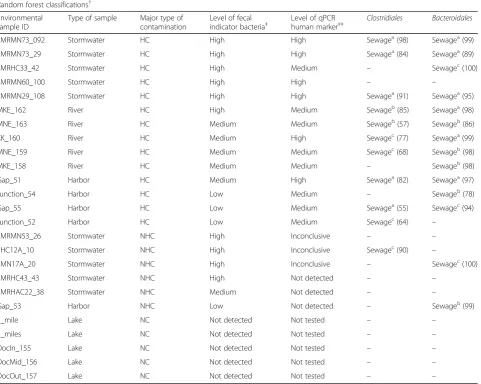
The accuracy of predictions of human fecal contamin-ation using random forest classificcontamin-ation was assessed using 25 freshwater samples, 14 of which had evidence of sewage contamination based on qPCR detection of human-associated fecal indicators (Table 2). Among these 14 contaminated freshwater samples, Clostridiales andBacteroidalesclassifiers identified a human bacterial signature in 10 and 12 samples, respectively. Nine sam-ples (64%) were classified correctly by both bacterial group classifiers. No sample was classified with fecal pol-lution from a non-human source.
The samples classified as human-contaminated shared at least 39 and 45% of their unique sequences withClostridiales and Bacteroidales sewage classifiers, respectively, while for example, the unclassified sample FMRMN60_100, with evi-dence of human contamination by qPCR, shared only 31 and 40% of its unique sequences with the respective bacterial groups. Other stormwater samples with high levels ofE.coli and enterococci, but low or inconclusive qPCR human markers, likely contained primarily non-human fecal con-tamination but were potentially mixed with low levels of sewage. In these cases, classification using random forest was also inconclusive. The majority of river and harbor samples with medium and high levels of human qPCR markers were correctly classified as having sewage contamination, with ex-ceptions being cases where only one of the classifiers ( Clos-tridialesorBacteroidales) indicated the presence of sewage. Although Gap_53 had a low level of fecal contamination, with no evidence of human contamination using qPCR markers, the Bacteroidalesclassifier identified a sewage sig-nature. All freshwater samples with no evidence of fecal pol-lution were correctly determined to have none of the examined fecal sources.
Classification of the artificial bacterial assemblage
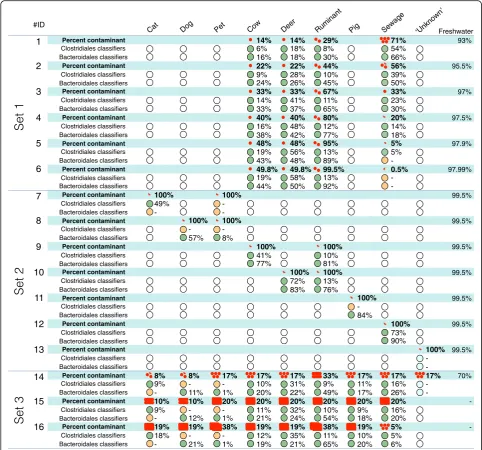
To evaluate the sensitivity and accuracy of random forest classifications, 37 in silico artificial bacterial assemblages were generated (Fig.5 and Additional file2). These tests indicate (set 1, Fig.5) that both bacterial group classifiers could detect the sewage signature in complex samples with animal sources when at least 0.5% of the total bacter-ial assemblage was composed of sewage sequences; in this case, 0.05% of the total sequences match the sewage clas-sifiers (Additional file2). Further testing of contamination levels, i.e., 1, 0.5, 0.1, and 0.01% of sequences, from each of the animal fecal sources, revealed similar sensitivity thresh-olds, that is, sources were correctly classified when se-quences from the fecal source comprised 0.5% of total assemblage (set 2, Fig.5) and approximately 0.001 to 0.06% of sequences in the total assemblage matched the classifiers (set 2 Additional file 2). The Cat_PU15, Dog_PU12, and Pig_159 samples did not follow this trend. In set 3 of the in silico samples, we found the classifiers could identify many contamination sources simultaneously when the sequences from these sources were pooled (Fig.5). Across all tests, the “Cat”,“Dog”, and“Pet”signatures were the most difficult to predict (lowest accuracy) and generally required higher levels of contamination (i.e. > 10% of source sequences present in the artificial assemblages) for accurate contamin-ation prediction.
For sets 1 to 4 (Fig. 5 and Additional file 2), the expected proportion of source contaminations were cor-related significantly with the relative proportion of sequences matching the classifiers among sequences be-longing to all classifiers. Therefore, these proportions could
Table 1Prediction of the fecal source contamination for animal fecal and sewage samples
Unknown sample ID Clostridiales Bacteroidales
Cat_PU15 Cata(88)–Peta(100) Peta(90)
Cow_PU75 Cowa(68)–Ruminanta
(12)
Cowa(93)– Ruminanta(97)
Deer_PU11 Deera(93)–Ruminanta
(16)
Deera(100)– Ruminanta(100)
Dog_PU12 Doga(22)–Peta(100) Doga(64)–Peta (100)
Dog_PU17 Doga(86)–Peta(100) Cata(7)–Peta(99)
Pig_PU156 Piga(48) Piga(99)
Pig_PU159 Piga(46) Piga(99)
Cow_PU70&Deer_PU91 Cowa(38)–Deera
(29)–Ruminanta(10) Cow a
(88)–Deera (12)–Ruminanta (100)
Sewage_Duncansville_161 Sewagea(83) Sewagea(93)
Sewage_Duncansville_52 Sewagea(86) Sewagea(97)
Sewage_Milwaukee_JI199 Sewagea(85) Sewagea(94)
Sewage_Milwaukee_SS200 Sewagea(87) Sewagea(96)
Sewage_ReusSpain_224 Sewagea(88) Sewagea(99)
Sewage_ReusSpain_80 Sewagea(95) Sewagea(99)
OtherSource_Goose_PU126 – –
OtherSource_Goose_PU97 Petb(64) –
OtherSource_Rabbit_PU26 – –
OtherSource_Rabbit_PU27 – –
OtherSource_Rabbit_PU9 – –
OtherSource_Raccoon_PU100 – Doga(85)–Peta
(72)
OtherSource_Raccoon_PU101 Petb(98) –
OtherSource_Raccoon_PU102 Dogc(59)–Peta(71) –
OtherSource_Raccoon_PU52 – Dogc(91)
Values representing the proportion of sequences that belong to a given classifier among the total number of sequences from all classifiers
a
Index representing the percentage of the vote by the trees higher than the majority (50%)
b
Index representing the percentage of the vote by the trees between 45 and 50%
c
be used as a proxy for the relative magnitude of contamin-ation from individual sources. This correlcontamin-ation was stronger for Bacteroidales (Spearman’s rank correlation coefficient Rs = 0. 790, n= 59, P< 0.001) than Clostridiales (Rs = 0. 546, n= 54,P< 0.001). The proxy we developed could not estimate the proportion of fecal contamination from sources that were not used to build the classifier (e.g., see Fig.5tests 13 and 14).
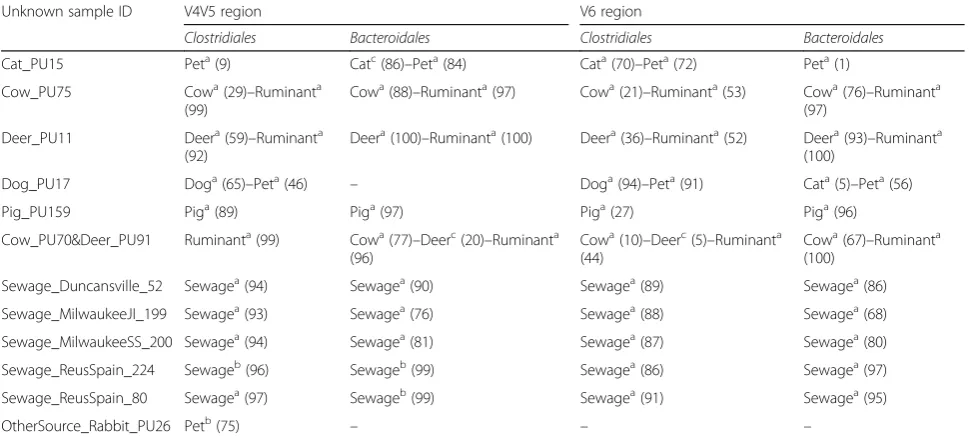
Comparison of the V4V5–V6 classifications
Random forest classifiers were also built and tested using the V4V5 hypervariable region of the 16S rRNA
gene. Predictions were compared with new V6 classi-fiers created from a subset of the original sample set and with the same samples used to generate the V4V5 classifiers. Characteristics of the classifiers are detailed in Additional file 4. Both V4V5 and V6 classifiers accurately identified most of the fecal sig-natures (Table 3). However, as observed with the V6 classifier built with a more extensive sample set, some misclassifications were detected for the “Cat”
and “Dog” sources. Rabbit_PU26, a source that was
not present in any classifier, was correctly not asso-ciated with a fecal source except for the V4V5
Table 2Random forest classification of 25 freshwater samples with different level of fecal contamination
Random forest classifications†
Environmental sample ID
Type of sample Major type of contamination
Level of fecal indicator bacteria‡
Level of qPCR
human marker‡‡ Clostridiales Bacteroidales
FMRMN73_092 Stormwater HC High High Sewagea(98) Sewagea(99)
FMRMN73_29 Stormwater HC High High Sewagea(84) Sewagea(89)
FMRHC33_42 Stormwater HC High Medium – Sewagec(100)
FMRMN60_100 Stormwater HC High High – –
FMRMN29_108 Stormwater HC High High Sewagea(91) Sewagea(95)
MKE_162 River HC High Medium Sewageb(85) Sewagea(98)
MNE_163 River HC Medium Medium Sewageb(57) Sewageb(86)
KK_160 River HC Medium High Sewagec(77) Sewagea(99)
MNE_159 River HC Medium Medium Sewagec(68) Sewageb(98)
MKE_158 River HC Medium Medium – Sewageb(98)
Gap_51 Harbor HC Medium High Sewagea(82) Sewagea(97)
Junction_54 Harbor HC Low Medium – Sewageb(78)
Gap_55 Harbor HC Low Medium Sewagea(55) Sewagec(94)
Junction_52 Harbor HC Low Medium Sewagec(64) –
FMRMN53_26 Stormwater NHC High Inconclusive – –
SHC12A_10 Stormwater NHC High Inconclusive Sewagec(90) –
SMN17A_20 Stormwater NHC High Inconclusive – Sewagec(100)
FMRHC43_43 Stormwater NHC High Not detected – –
FMRHAC22_38 Stormwater NHC Medium Not detected – –
Gap_53 Harbor NHC Low Not detected – Sewageb(99)
1_mile Lake NC Not detected Not tested – –
2_miles Lake NC Not detected Not tested – –
DocIn_155 Lake NC Not detected Not tested – –
DocMid_156 Lake NC Not detected Not tested – –
DocOut_157 Lake NC Not detected Not tested – –
HChuman contamination (fecal indicator bacteria and human marker detected),NHCnon-human contamination (fecal indicator detected and human markers not detected or inconclusive reflecting potential for low levels of human contamination),NCnot fecal contaminated (fecal indicator not detected)
†Values in parentheses represent the proportion of sequences that belong to a given classifier among the total number of sequences from all classifiers ‡Density levels of the fecal indicatorE.coliand enterococci: not detected, 0; low, > 0–250; medium, 250–1000; high, > 1000 CFU/100 mL
‡‡Quantification levels of the markers humanBacteroides, Lachno2, and Lachno3 when tested: Not detected, 0; not quantifiable, > 0–15; low, > 15–100; medium,
100–10,000; high, > 10,000 gene copies/100 mL. In case of divergence between the humanBacteroides, Lachno2, and/or Lachno3 human markers, results were considered to be inconclusive. See Additional file1for details
a
Index representing the percentage of the vote by the trees higher than the majority (50%)
b
Index representing the percentage of the vote by the trees between 45 and 50%
c
Clostridiales classifier, in which it was classified as a Pet source. Both bacterial group classifiers estimated comparable proportions of source contamination be-tween the V4V5 and V6 regions (Mann–Whitney,
Clostridiales: W= 120, n= 27, P= 0.159;
Bacteroi-dales: W= 96, n= 24, P= 0.173).
Robustness of predictions
The robustness of the predictions, i.e., the probability generated by random forest voting trees, was assessed by repeating 100 times the random forest training and clas-sifications of all animal, sewage, and freshwater samples described above. For the V6 analysis, the results
1 Percent contaminant 14% 14% 29% 71% 93%
6% 18% 8% 54%
16% 18% 30% 66%
2 Percent contaminant 22% 22% 44% 56% 95.5%
9% 28% 10% 39%
24% 26% 45% 50%
3 Percent contaminant 33% 33% 67% 33% 97%
14% 41% 11% 23%
33% 37% 65% 30%
4 Percent contaminant 40% 40% 80% 20% 97.5%
16% 48% 12% 14%
38% 42% 77% 18%
5 Percent contaminant 48% 48% 95% 5% 97.9%
19% 56% 13% 5%
43% 48% 89%
-6 Percent contaminant 49.8% 49.8% 99.5% 0.5% 97.99%
19% 58% 13%
-44% 50% 92%
-7 Percent contaminant 100% 100% 99.5%
49%
--
-8 Percent contaminant 100% 100% 99.5%
-
-57% 8%
9 Percent contaminant 100% 100% 99.5%
41% 10%
77% 81%
10 Percent contaminant 100% 100% 99.5%
72% 13%
83% 76%
11 Percent contaminant 100% 99.5%
-84%
12 Percent contaminant 100% 99.5%
73% 90%
13 Percent contaminant 100% 99.5%
-14 Percent contaminant 8% 8% 17% 17% 17% 33% 17% 17% 17% 70%
9% - - 10% 31% 9% 11% 16%
-- 11% 1% 20% 22% 49% 17% 26%
-15 Percent contaminant 10% 10% 20% 20% 20% 20% 20% 20%
-9% - - 11% 32% 10% 9% 16%
- 12% 1% 21% 24% 54% 18% 20%
16 Percent contaminant 19% 19% 38% 19% 19% 38% 19% 5%
-18% - - 12% 35% 11% 10% 5%
- 21% 1% 19% 21% 65% 20% 6%
Cat Dog Pet Cow Deer Ruminant Pig Sewage
#ID
Freshwater
Set 1
Set 2
Set 3
indicated good reproducibility of the predictions, with an average standard deviation across the trials of 0.05% and 0.04% for Clostridiales and Bacteroidales, respect-ively, and a maximum of 0.18%. No significant difference in prediction robustness was observed between the two bacterial groups (Mann–Whitney, W= 74,420, n= 768, P= 0.821). Similar standard deviation values were obtained for the V4V5–V6 comparison classifiers, with an average of 0.06% for both V4V5 and V6 classifiers (maximumV4V5= 0.17%, maximumV6= 0.16%). No sig-nificant difference was observed between the two re-gions (Mann–Whitney,W= 18,384,n= 385,P= 0.965).
Discussion
ClostridialesandBacteroidalescommunity assemblages provide a signature of sewage and animal fecal contamination
Despite the incredible diversity within the microbial world, evolutionary forces predominantly favored mem-bers of the Clostridiales and Bacteroidalesorders in the gut of animals and humans (see reviews [2,55]). Within each of these fecal bacterial group assemblages, we observed reliable patterns that discriminated host sources. This signal was preserved despite variation among individual animals. Further, host patterns were observed across multiple taxonomic levels: While our re-spective classifiers included sequences from either Clos-tridiales or Bacteroidales, preliminary investigations targeting Bacteroidaceae, Lachnospiraceae,
Prevotella-ceae, or Ruminococcaceae individual family level
classifiers showed relevant bacterial patterns between hosts (Additional file 6). Similar observations were also found when focusing solely on the genus Blautia [5]. Taken together, these results highlight the fractal nature of gut microbial communities, i.e., similar patterns at in-creasingly smaller scales of the gut microbiome. The community differentiation among hosts stems from (i) traits conserved across broad taxonomic groups and (ii) selection within closely related microbial genera/ species for members that are specialized for a particu-lar host niche [4, 56, 57].
In this work, we focused onClostridialesand
Bacteroi-dales and ignored the remaining community data. This
taxonomically narrow focus on the two most common gut-associated groups removes the influence of large cross-phylum shifts in the bacterial community while providing fecal source identification redundancy. Host diet and/or transient bacteria can cause changes in gut microbiota composition that are not typical of the host species in general [58,59]. For example, the ingestion of
Lactobacillus strains can increase temporarily their
recovery in fecal samples or lead to phylum-level domin-ance shifts in the community (see review and references therein [58]). The concept that population shifts in re-sponse to environmental gradients are standardly assessed within species has been reported previously, in-cluding in macro ecology [60,61].
Major shifts in bacterial assemblages may also occur during sample processing or sequencing, where freezing, duration of storage, choice of DNA extraction method,
Table 3V4V5 and V6 classifier predictions for animal fecal, sewage, and freshwater samples
Unknown sample ID V4V5 region V6 region
Clostridiales Bacteroidales Clostridiales Bacteroidales
Cat_PU15 Peta(9) Catc(86)–Peta(84) Cata(70)–Peta(72) Peta(1)
Cow_PU75 Cowa(29)–Ruminanta
(99)
Cowa(88)–Ruminanta(97) Cowa(21)–Ruminanta(53) Cowa(76)–Ruminanta (97)
Deer_PU11 Deera(59)–Ruminanta (92)
Deera(100)–Ruminanta(100) Deera(36)–Ruminanta(52) Deera(93)–Ruminanta (100)
Dog_PU17 Doga(65)–Peta(46) – Doga(94)–Peta(91) Cata(5)–Peta(56)
Pig_PU159 Piga(89) Piga(97) Piga(27) Piga(96)
Cow_PU70&Deer_PU91 Ruminanta(99) Cowa(77)–Deerc(20)–Ruminanta (96)
Cowa(10)–Deerc(5)–Ruminanta (44)
Cowa(67)–Ruminanta (100)
Sewage_Duncansville_52 Sewagea(94) Sewagea(90) Sewagea(89) Sewagea(86)
Sewage_MilwaukeeJI_199 Sewagea(93) Sewagea(76) Sewagea(88) Sewagea(68)
Sewage_MilwaukeeSS_200 Sewagea(94) Sewagea(81) Sewagea(87) Sewagea(80)
Sewage_ReusSpain_224 Sewageb(96) Sewageb(99) Sewagea(86) Sewagea(97)
Sewage_ReusSpain_80 Sewagea(97) Sewageb(99) Sewagea(91) Sewagea(95)
OtherSource_Rabbit_PU26 Petb(75) – – –
Values in parentheses represent the proportion of sequences that belong to a given classifier among the total number of sequences from all classifiers
a
Index representing the percentage of the vote by the trees higher than the majority (50%)
b
Index representing the percentage of the vote by the trees between 45 and 50%
c
or choice of primers inflated the recovery of certain mi-crobial phyla leading to an important shift in bacterial phylum-level ratios, such as Firmicutes-to-Bacteroidetes abundance [62–66]. In general, it is believed that there is more consistency in sample processing recovery among more closely related bacterial groups due to their similar cell membrane properties. Overall, classifiers with a narrow taxonomic focus may be less influenced by extra-neous factors.
Random forest classifiers are representative of host groups
A relatively small number of unique ASVs, representing a moderate proportion of theClostridialesand
Bacteroi-dales assemblages, were selected by random forest as
the bacterial signature of the different fecal sources. The classifiers contained a few unique ASVs that were exclu-sive to a source; most ASVs were host-preferred (70%), i.e., shared with other sources but with differential abundance patterns. This result supports our previous findings, highlighting that bacterial lineage abundances were more important than presence/absence patterns for discriminating sources [5,35].
Random forest was effective in retrieving differential bacterial host signatures between the sources investi-gated, suggesting (i) an adequate number of samples were analyzed to provide a good coverage of the host group in the classifiers, and (ii) there is consistency in the bacterial signatures within each of the sources inves-tigated. The effectiveness of random forest was reflected in the low out-of-bag error rates, which indicated the degree of coverage of the host groups. These low values were observed even by training the classifiers using on average as few as ten animal fecal/sewage samples. This result suggests that random forest is sensitive enough to identify, with a small number of samples, relevant host bacterial group patterns. However, it would be pertinent to assess the out-of-bag error rates and the accuracy of the predictions using samples collected outside the USA, since geographically related environmental factors have been observed to affect host animal fecal microbiomes, and thus source identifications [67]. Additionally, the creation of classifiers with samples collected from dis-tinct locations could also expand and provide more geo-graphic and host group coverage. We also note in the V4V5 and V6 classifier comparison, where less samples were used to train the classifiers, the out-of-bag error rates were higher and the number of accurate classifica-tions was lower.
The sewage pattern was highly consistent among cities used to build the classifiers. We previously showed that sewage is an aggregate signal from human populations, and this signal does not vary much across the USA [31]. This observation appears to extend to regions outside
the USA as the sewage signature was found in geograph-ically distant samples collected in Spain. Moreover, the classifiers properly detected the human signature in a large number of environmental samples with evidence of human fecal contamination as detected by PCR-based markers. However, the sewage signal for some samples, notably stormwater samples, was not detected when sewage contamination was thought to be present based on human fecal marker assays. In these samples, the contamination may originate from a few individual humans, which presents a highly variable fecal bacterial signature compared to the integrative signature in sew-age. This observation supports previous findings in which human fecal indicators detected by qPCR in stormwater samples were inconsistent [20]. The storm-water samples may be mainly contaminated by urban wildlife or other uncharacterized fecal sources. Inconclu-sive qPCR and random forest classifications suggest either the sources responsible for the fecal contamin-ation share bacterial community members with humans or very low levels of human fecal pollution are present, but could not be verified. In either case, the sequence data did not resolve the inconclusive qPCR results. No other fecal animal sources were detected in the environ-mental samples studied. New classifiers of urban animals that contribute to runoff may be necessary to further de-lineate sources of fecal pollution in stormwater.
Random forest classification: a powerful source identification tool
This study highlighted the suitability of random forest classification approach to perform fecal source identifi-cation using 16S rRNA gene amplicons. Targeting the V6 hypervariable region provided enough variability in bacterial community composition between hosts to properly classify the source of fecal contamination, with only a few false-positive pet signatures detected. Besides the high accuracy classification, random forest presents the advantage that the addition of new samples in a clas-sifier or the creation of new source clasclas-sifiers is relatively simple. Hence, random forest can be considered as a scalable and extensible model. As highlighted by Statni-kov et al. [23], the creation and training of classifiers are not impacted by the presence of a few poorly sequenced samples (data not shown). Moreover, once the classifiers are created, the training of the classifiers with a subset of the data and the classification of unknown samples takes a few seconds and does not need important com-puting resources.
the sources investigated. Since these proportions are not quantitative, we suggest that they be used for hierarch-ical classification to identify which source(s) contributed the most to observed fecal pollution.
Our classifier approach will be applicable to sequence data from other regions of the 16S rRNA gene or other genes, as seen in the V4V5 and V6 comparison. Al-though the V6 region is one of the shortest commonly sequenced hypervariable regions, i.e., the least amount of sequence information, this region is associated with the highest degree of polymorphism [68]. Short read lengths make the V6 target region suitable for deep sequencing platforms such as the NextSeq Illumina platform that can generate 400 million of reads per run compared to 25 million for the MiSeq Illumina platform [69]. This difference of sequencing depth may be key for detecting low level of fecal contamination in environ-mental samples.
Conclusion
We demonstrate the relevance of using random forest classification as an efficient and effective tool for source identification. The method is scalable and extensible for systematically assessing complex sequence data to identify fecal sources and provide the associated proportion of contamination. Both Clostridialesand Bacteroidales bac-terial groups appear to be relevant markers of animal and sewage fecal contamination in the environment. Using both classifiers offers independent verification of contam-ination to increase confidence in results. Further, by allow-ing a fast-screenallow-ing of large sequence datasets, this approach could also be useful in identifying new molecu-lar markers for source microbiomes. High-throughput se-quencing is emerging as a promising approach for water quality assessments due to the falling costs of sequencing, the exponential increase in information gained from these methods, and the development of field adaptable plat-forms such as MinION based on Nanopore technology [70]. The limitation in implementing such approaches may not be sequencing technology, but the need for rapid computational methods with low-resource demands. Since random forest classification does not necessitate signifi-cant computing resources, this approach represents a valuable tool for assessment of contaminated water for pathogen risk and for stakeholders to identify the main sources of fecal pollution and implement appropriate management actions.
Additional files
Additional file 1:Sample metadata. Sample metadata includes Sample ID of the samples used to create or test the classifiers in the paper, sample origin and collection date. The volume or the weight, as well as the name of the DNA kits used to extract total bacterial DNA are also
mentioned. The densities of fecal indicator bacteria and human markers in the freshwater samples are indicated. Short Read Archive and the individual SRR accession number are listed to be used to reference the raw sequence file from NCBI. (XLSX 138 kb)
Additional file 2:Random forest classifications performed on 37 artificial bacterial assemblages. This file contains (a) the classifications of 37 artificial bacterial assemblages, and (b) the number of sequences associated with the different classifiers. The file lists the sample IDs, the proportions used to generate the in silico artificial bacterial assemblages, the expected and observed fecal source contamination proportions, and the total number of sequences per sample. (XLSX 52 kb)
Additional file 3:Bray–Curtis dissimilarity matrix. Bray–Curtis dissimilarity matrix forClostridialesandBacteroidalesbacterial composition among samples used to build the classifiers. (XLSX 133 kb)
Additional file 4:Classifiers properties. This file indicates the number of ASVs selected to compose the classifiers, the number of specific ASVs and the out-of-bag error rate per source for the V6 study and the V4V5 to V6 comparison analysis. (XLSX 25 kb)
Additional file 5:Distribution of the ASVs selected among the
Bacteroidalesclassifiers. This file presents (a) the mean and distribution of the number of ASVs belonging to the different classifiers for each source of fecal samples, and (b) a heatmap representing the relative abundance of the ASVs selected within the eight classifiers for the samples used to build the classifiers. (DOCX 4000 kb)
Additional file 6:Random forest predictions for the fecal-animal, sewage and freshwater samples using V6 classifiers built at the family level. This file contains the classifications of 48 samples usingBacteroidaceae,Lachnospiraceae,
PrevotellaceaeandRuminococcaceaeclassifiers. (XLSX 29 kb)
Abbreviations
ASV:Amplicon sequence variant; BC: Bray–Curtis; DNA: Deoxyribonucleic acid; HC: Human contaminated; MDG: Mean decrease Gini; MED: Minimum entropy decomposition; NC: Not contaminated; NHC: Not human contaminated; PCR: Polymerase chain reaction; qPCR: Real-time quantitative PCR; rRNA: Ribosomal ribonucleic acid
Acknowledgements
The authors thank the Great Lake Genomic Center, especially Angela Schmoldt for community sequencing production, and Aurash Mohaimani for his advice and help with data processing. The authors are particularly grateful to Hilary Morrison, who provided sequencing support through the Josephine Bay Paul Center at the Marine Biological Laboratory.
Funding
This project was funded under National Institutes of Health (NIH) grant R01AI091829 to SLM.
Availability of data and materials
The National Center for Biotechnology Information Sequence Read Archive has archived the raw data under the accession numbers SRP132403, SRP047513, SRP049107, and SRP146269 for V4V5 and SRP132402, SRP041262, SRP056973, and SRP146244 for V6 dataset. The relevant data are available through the following Figshare DOIs: 10.6084/m9.figshare.6344888. This submission contains the script and the databases (R object) used to perform the random forest analysis targeting the V6 region of the 16S rRNA gene. It also contains the fasta of the V6-ASVs and the confusion matrix obtained during the training of theClostridialesandBacteroidalesV6-classifiers.
Authors’contributions
AR contributed to the design of the analysis, the data analysis, manuscript writing, and final approval of the manuscript. AME, RJN, and SLM contributed to the conception of the study, design of the analysis, and critical revision and final approval of the manuscript. RJN and SLM contributed to the data collection. SLM contributed to the acquisition of funding and coordination of the research. All authors read and approved the final manuscript.
Ethics approval and consent to participate
Consent for publication
Not applicable
Competing interests
The authors declare that they have no competing interests.
Publisher’s Note
Springer Nature remains neutral with regard to jurisdictional claims in published maps and institutional affiliations.
Author details
1School of Freshwater Sciences, University of Wisconsin-Milwaukee, Milwaukee, WI, USA.2Department of Medicine, University of Chicago, Chicago, IL, USA.
Received: 5 March 2018 Accepted: 1 October 2018
References
1. Ley RE, Lozupone CA, Hamady M, Knight R, Gordon JI. Worlds within worlds: evolution of the vertebrate gut microbiota. Nat Rev Microbiol. 2008;6:776–88.
2. Kostic AD, Howitt MR, Garrett WS. Exploring host–microbiota interactions in animal models and humans. Genes Dev. 2013;27:701–18.
3. Yoon SS, Kim EK, Lee WJ. Functional genomic and metagenomic approaches to understanding gut microbiota-animal mutualism. Curr Opin Microbiol. 2015;24:38–46.
4. Nishida AH, Ochman H. Rates of gut microbiome divergence in mammals. Mol Ecol. 2018;27(8):1884–97.https://doi.org/10.1111/mec.14473. 5. Eren AM, Sogin ML, Morrison HG, Vineis JH, Fisher JC, Newton RJ, et al. A
single genus in the gut microbiome reflects host preference and specificity. ISME J. 2015;9:90–100.
6. Ahmed W, Staley C, Sadowsky MJ, Gyawali P, Sidhu J, Palmer A, et al. Toolbox approaches using molecular markers and 16S rRNA gene amplicon data sets for identification of fecal pollution in surface water. Appl Environ Microbiol. 2015;81:7067–77.
7. Brown CM, Staley C, Wang P, Dalzell B, Chun CL, Sadowsky MJ. A high-throughput DNA sequencing approach to determine sources of fecal bacteria in a Lake Superior estuary. Environ Sci Technol. 2017;51:8263–71. 8. McLellan SL, Eren AM. Discovering new indicators of fecal pollution. Trends
Microbiol. 2014;22:697–706.
9. Willey JM, Sherwood LM, Woolverton CJ. Proteobacteria. In: Prescott’s microbiology. 10th ed. New York: McGraw-Hil; 2017. p. 504–34. 10. Soller JA, Schoen ME, Bartrand T, Ravenscroft JE, Ashbolt NJ. Estimated
human health risks from exposure to recreational waters impacted by human and non-human sources of faecal contamination. Water Res. 2010; 44:4674–91.
11. Schoen ME, Ashbolt NJ. Assessing pathogen risk to swimmers at non-sewage impacted recreational beaches. Environ Sci Technol. 2010;44:2286–91. 12. Knights D, Kuczynski J, Charlson ES, Zaneveld J, Mozer MC, Collman RG,
et al. Bayesian community-wide culture-independent microbial source tracking. Nat. Methods 2011;8:761–763.
13. Flores GE, Bates ST, Knights D, Lauber CL, Stombaugh J, Knight R, et al. Microbial biogeography of public restroom surfaces. PLoS One. 2011;6: e28132.
14. Hewitt KM, Mannino FL, Gonzalez A, Chase JH, Caporaso JG, Knight R, et al. Bacterial diversity in two neonatal intensive care units (NICUs). PLoS One. 2013;8:e54703.
15. Lax S, Smith DP, Hampton-Marcell J, Owens SM, Handley KM, Scott NM, et al. Longitudinal analysis of microbial interaction between humans and the indoor environment. Science. 2014;345:1048–52.
16. Henry R, Schang C, Coutts S, Kolotelo P, Prosser T, Crosbie N, et al. Into the deep: evaluation of SourceTracker for assessment of faecal contamination of coastal waters. Water Res. 2016;93:242–53.
17. McCarthy D, Jovanovic D, Lintern A, Teakle I, Barnes M, Deletic A, et al. Source tracking using microbial community fingerprints: method comparison with hydrodynamic modelling. Water Res. 2017;109:253–65. 18. Neave M, Luter H, Padovan A, Townsend S, Schobben X, Gibb K. Multiple
approaches to microbial source tracking in tropical northern Australia. Microbiology. 2014;3:860–74.
19. Comte J, Berga M, Severin I, Logue JB, Lindström ES. Contribution of different bacterial dispersal sources to lakes: population and community effects in different seasons. Environ Microbiol. 2017;19:2391–404. 20. Newton RJ, Bootsma MJ, Morrison HG, Sogin ML, McLellan SL. A microbial
signature approach to identify fecal pollution in the waters off an urbanized coast of Lake Michigan. Microb Ecol. 2013;65:1011–23.
21. Caruana R, Niculescu-Mizil A. An empirical comparison of supervised learning algorithms. Proc 23rd Int Conf Mach Learn. 2006;C:161–8. 22. Breiman L. Manual on setting up, using, and understanding random forests
v3.1. Berkeley: Stat. Dep. Univ. Calif; 2002. p. 1.
23. Statnikov A, Henaff M, Narendra V, Konganti K, Li Z, Yang L, et al. A comprehensive evaluation of multicategory classification methods for microbiomic data. Microbiome. 2013;1:11.
24. Unno T, Jang J, Han D, Kim JH, Sadowsky MJ, Kim O-S, et al. Use of barcoded pyrosequencing and shared OTUs to determine sources of fecal bacteria in watersheds. Environ Sci Technol. 2010;44:7777–82.
25. Lee JE, Lee S, Sung J, Ko G. Analysis of human and animal fecal microbiota for microbial source tracking. ISME J Nature Publishing Group. 2011;5:362–5. 26. Breiman L. Random forests. Mach Learn. 2001;45:5–32.
27. Polikar R. Ensemble learning. In: Zhang C, Ma Y, editors. Ensemble machine learning, Springer; 2012. p. 1–34.
28. Cutler DR, Edwards TCJ, Beard KH, Cutler A, Hess KT, Gibson J, et al. Random forests for classification in ecology. Ecology. 2007;88:2783–92.
29. Casanovas-Massana A, Gómez-Doñate M, Sánchez D, Belanche-Muñoz LA, Muniesa M, Blanch AR. Predicting fecal sources in waters with diverse pollution loads using general and molecular host-specific indicators and applying machine learning methods. J Environ Manag. 2015;151:317–25. 30. Smith A, Sterba-Boatwright B, Mott J. Novel application of a statistical
technique, Random Forests, in a bacterial source tracking study. Water Res. 2010;44:4067–76.
31. Newton RJ, McLellan SL, Dila DK, Vineis JH, Morrison HG, Eren AM, et al. Sewage reflects the microbiomes of human populations. MBio. 2015;6:e02574–14. 32. Fisher JC, Levican A, Figueras MJ, McLellan SL. Population dynamics and
ecology of Arcobacter in sewage. Front Microbiol. 2014;5:1–9. 33. Koskey AM, Fisher JC, Eren AM, Ponce-Terashima R, Reis MG, Blanton RE,
et al.BlautiaandPrevotellasequences distinguish human and animal fecal pollution in Brazil surface waters. Environ Microbiol Rep. 2014;6:696–704. 34. Fisher JC, Newton RJ, Dila DK, McLellan SL. Urban microbial ecology of a
freshwater estuary of Lake Michigan. Elem Sci Anthr. 2014;3:64. 35. Fisher JC, Eren AM, Green HC, Shanks OC, Morrison HG, Vineis JH, et al.
Comparison of sewage and animal fecal microbiomes by using oligotyping reveals potential human fecal indicators in multiple taxonomic groups. Appl Environ Microbiol. 2015;81:7023–33.
36. U.S. Environmental Protection Agency. Method 1603:Escherichia coli(E. coli) in water by membrane filtration using modified menbrane-thermotolerant
Escherichia coliagar (modified mTEC). Washington, D.C.: US Environmental Protection Agency Office of Water; 2006.
37. U.S. Environmental Protection Agency. Method 1600: membrane filter test method for enterococci in water. Washington, D.C.: US Environmental Protection Agency Office of Water; 1997.
38. Newton RJ, VandeWalle JL, Borchardt MA, Gorelick MH, McLellan SL.
LachnospiraceaeandBacteroidalesalternative fecal indicators reveal chronic human sewage contamination in an urban harbor. Appl Environ Microbiol. 2011;77:6972–81.
39. Feng S, Bootsma M, Mclellan SL. Novel human-associated
Lachnospiraceae genetic markers improve detection of fecal pollution sources in urban waters. Appl Environ Microbiol. 2018.https://doi.org/ 10.1128/AEM.00309-18.
40. Bernhard AE, Field KG. A PCR assay to discriminate human and ruminant feces on the basis of host differences inBacteroides-Prevotellagenes encoding 16S rRNA. Appl Environ Microbiol. 2000;66:4571–4. 41. Kildare BJ, Leutenegger CM, McSwain BS, Bambic DG, Rajal VB, Wuertz S. 16S
rRNA-based assays for quantitative detection of universal, human-, cow-, and dog-specific fecalBacteroidales: a Bayesian approach. Water Res. 2007;41:3701–15. 42. Morrison HG, Grim SL, Vineis JH, Sogin ML. 16S amplicon Illumina
sequencing methods. Figshare. 2013;5–6.https://figshare.com/articles/16S_ amplicon_fusion_primers_and_protocol_for_Illumina_platform_sequencing/ 833944. Accessed 12 Dec 2017.
44. Martin M. Cutadapt removes adapter sequences from high-throughput sequencing reads. EMBnet J. 2011;17:10–2.
45. Zhang J, Kobert K, Flouri T, Stamatakis A. PEAR: a fast and accurate Illumina paired-end reAd mergeR. Bioinformatics. 2014;30:614–20.
46. Schloss PD, Westcott SL, Ryabin T, Hall JR, Hartmann M, Hollister EB, et al. Introducing mothur: open-source, platform-independent, community-supported software for describing and comparing microbial communities. Appl Environ Microbiol. 2009;75:7537–41.
47. Huse SM, Dethlefsen L, Huber JA, Welch DM, Relman DA, Sogin ML. Exploring microbial diversity and taxonomy using SSU rRNA hypervariable tag sequencing. PLoS Genet. 2008;4:e1000255.
48. McDonald D, Price MN, Goodrich J, Nawrocki EP, DeSantis TZ, Probst A, et al. An improved Greengenes taxonomy with explicit ranks for ecological and evolutionary analyses of bacteria and archaea. ISME J. 2012;6:610–8.
49. DeSantis TZ, Hugenholtz P, Larsen N, Rojas M, Brodie EL, Keller K, et al. Greengenes, a chimera-checked 16S rRNA gene database and workbench compatible with ARB. Appl Environ Microbiol. 2006;72:5069–72. 50. Eren AM, Morrison HG, Lescault PJ, Reveillaud J, Vineis JH, Sogin ML.
Minimum entropy decomposition: unsupervised oligotyping for sensitive partitioning of high-throughput marker gene sequences. ISME J. 2015;9: 968–79.
51. Liaw A, Wiener M. Classification and regression by random forest. version 4. 6-12. R News. 2002;2/3:18–22.
52. Zeileis A, Leisch F, Homik K, Kleiber C. Strucchange: an R package for testing for structural change. J Stat Softw. 2002;7:1–38.
53. Oksanen J, Blanchet FG, Friendly M, Kindt R, Legendre P, McGlinn D, et al. Package‘vegan’: community ecology package version 2.4–4 2017. 54. R Core Team. R: a language and environment for statistical computing.
Vienna, Austria: R Foundation for Statistical Computing; 2016.
55. Hacquard S, Garrido-Oter R, González A, Spaepen S, Ackermann G, Lebeis S, et al. Microbiota and host nutrition across plant and animal kingdoms. Cell Host Microbe. 2015;17:603–16.
56. Dethlefsen L, McFall-Ngai MJ, Relman DA. An ecological and evolutionary perspective on human-microbe mutualism and disease. Nature. 2007;449:811–8. 57. Relman DA. Learning about who we are. Nature. 2012;486:194–5. 58. Derrien M, van Hylckama Vlieg JET. Fate, activity, and impact of ingested
bacteria within the human gut microbiota. Trends Microbiol 2015;23:354–366. 59. David LA, Maurice CF, Carmody RN, Gootenberg DB, Button JE, Wolfe BE,
et al. Diet rapidly and reproducibly alters the human gut microbiome. Nature. 2014;505:559–63.
60. Martiny JBH, Bohannan BJM, Brown JH, Colwell RK, Fuhrman JA, Green JL, et al. Microbial biogeography: putting microorganisms on the map. Nat Rev Microbiol. 2006;4:102–12.
61. Horner-Devine MC, Silver JM, Leibold MA, Bohannan BJM, Colwell RK, Fuhrman JA, et al. A comparison of taxon co-occurrence patterns for macro- and microorganims. Ecology. 2007;88:1345–53.
62. Wesolowska-Andersen A, Bahl MI, Carvalho V, Kristiansen K, Sicheritz-Pontén T, Gupta R, et al. Choice of bacterial DNA extraction method from fecal material influences community structure as evaluated by metagenomic analysis. Microbiome. 2014;2:19.
63. Wagner Mackenzie B, Waite DW, Taylor MW. Evaluating variation in human gut microbiota profiles due to DNA extraction method and inter-subject differences. Front Microbiol. 2015;6.https://doi.org/10.3389/fmicb.2015. 00130.
64. Rintala A, Pietilä S, Munukka E, Eerola E, Pursiheimo JP, Laiho A, et al. Gut microbiota analysis results are highly dependent on the 16s rRNA gene target region, whereas the impact of DNA extraction is minor. J Biomol Tech. 2017;28:19–30.
65. Bahl MI, Bergström A, Licht TR. Freezing fecal samples prior to DNA extraction affects the Firmicutes to Bacteroidetes ratio determined by downstream quantitative PCR analysis. FEMS Microbiol Lett. 2012;329:193–7. 66. Gorzelak MA, Gill SK, Tasnim N, Ahmadi-Vand Z, Jay M, Gibson DL. Methods for improving human gut microbiome data by reducing variability through sample processing and storage of stool. PLoS One. 2015;10:1–14. 67. Staley C, Kaiser T, Lobos A, Ahmed W, Harwood VJ, Brown CM, Sadowsky
MJ. Application of SourceTracker for accurate identification of fecal pollution in recreational freshwater: A double-blinded study. Environ Sci Technol. 2018;52:4207–17.
68. Chakravorty S, Helb D, Burday M, Connell N, Alland D. A detailed analysis of 16S ribosomal RNA gene segments for the diagnosis of pathogenic bacteria. J Microbiol Methods. 2007;69:330–9.
69. Illumina. Sequencing Platform Comparison Tool.https://www.illumina.com/ systems/sequencing-platforms/comparison-tool.htmlAccessed 3 Mar 2018. 70. Tan B, Ng C, Nshimyimana JP, Loh LL, Gin KYH, Thompson JR.