R E S E A R C H
Open Access
Genome-wide DNA methylation profiling
integrated with gene expression profiling
identifies
PAX9
as a novel prognostic
marker in chronic lymphocytic leukemia
Lata Rani
1, Nitin Mathur
1, Ritu Gupta
1*, Ajay Gogia
2, Gurvinder Kaur
1, Jaspreet Kaur Dhanjal
3, Durai Sundar
3,
Lalit Kumar
2and Atul Sharma
2Abstract
Background:In chronic lymphocytic leukemia (CLL), epigenomic and genomic studies have expanded the existing
knowledge about the disease biology and led to the identification of potential biomarkers relevant for implementation of personalized medicine. In this study, an attempt has been made to examine and integrate the global DNA
methylation changes with gene expression profile and their impact on clinical outcome in early stage CLL patients. Results:The integration of DNA methylation profile (n= 14) with the gene expression profile (n= 21) revealed 142 genes as hypermethylated-downregulated and; 62 genes as hypomethylated-upregulated in early stage CLL patients compared to CD19+ B-cells from healthy individuals. The mRNA expression levels of 17 genes identified to be differentially
methylated and/or differentially expressed was further examined in early stage CLL patients (n= 93) by quantitative real time PCR (RQ-PCR). Significant differences were observed in the mRNA expression ofMEIS1,PMEPA1,SOX7,SPRY1,CDK6, TBX2, andSPRY2genes in CLL cells as compared to B-cells from healthy individuals. The analysis in theIGHVmutation based categories (Unmutated = 39, Mutated = 54) revealed significantly higher mRNA expression ofCRY1andPAX9genes in theIGHVunmutated subgroup (p< 0.001). The relative risk of treatment initiation was significantly higher among patients with high expression ofCRY1(RR = 1.91,p= 0.005) orPAX9(RR = 1.87,p= 0.001). High expression ofCRY1 (HR: 3.53,p< 0.001) orPAX9(HR: 3.14,p< 0.001) gene was significantly associated with shorter time to first treatment. The high expression ofPAX9gene (HR: 3.29, 95% CI 1.172–9.272,p= 0.016) was also predictive of shorter overall survival in CLL.
Conclusions:The DNA methylation changes associated with mRNA expression ofCRY1andPAX9genes allow risk stratification of early stage CLL patients. This comprehensive analysis supports the concept that the epigenetic changes along with the altered expression of genes have the potential to predict clinical outcome in early stage CLL patients.
Keywords:Promoter methylation,PAX9, Circadian rhythm, Transcription factors
* Correspondence:[email protected];[email protected] 1Laboratory Oncology Unit, Dr. B.R.A.IRCH, All India Institute of Medical Sciences (AIIMS), Ansari Nagar, New Delhi 110029, India
Full list of author information is available at the end of the article
heavy chain variable (IGHV) gene mutations that segre-gate CLL patients into low and high-risk clinical groups are widely used to assess the prognosis of these patients. Low-risk patients generally display mutatedIGHVgene, low CD38, and lowζchain associated protein kinase-70 (ZAP-70) expression, while high-risk cases exhibit the re-verse pattern [2–6].
Altered DNA methylation is one of the hallmark events in cancer. The first evidence of DNA methylation in CLL was presented by Wahlfors et al. [7] in which a global loss of methylation was reported. In addition to global hypo-methylation, hypermethylation of individual gene pro-moters has also been reported in CLL [7–11]. Methylation of TWIST2 and ZAP-70 exhibited a strong association with theIGHV-mutated status [9, 12] whereas methylation of HOXA4 gene was predominantly associated with the
IGHV unmutated status [13]. Further studies employing genome wide methylation profiling technologies have re-vealed association of differential methylation patterns with prognostic subgroups based on theIGHVmutation status [14–16], CD38 levels [17],ZAP-70levels [16], immunoge-netic subsets [18], and 17p-deletion status [19].
Earlier, DNA hypermethylation was thought to affect the expression of a gene negatively but the emerging re-search has suggested that the function and effect of DNA methylation is contextual, and the relationship between DNA methylation and transcription is more complex [20]. In CLL, although association of differential methylation patterns with specific prognostic subgroups in earlier re-ports highlights the potential of altered gene methylation as a tool to predict clinical outcome, further research is re-quired to establish the relationship between the epige-nome and the transcriptome. The present study was carried out to correlate the DNA methylation patterns with gene expression profile and to assess the prognostic implications of such correlations on clinical outcome in 93 early stage CLL patients.
Methods Patient selection
Treatment naive early stage (Rai 0-II) CLL patients (n= 100) were enrolled in the study after obtaining informed consent as per the guidelines of the institute ethics committee. According to the staging criteria
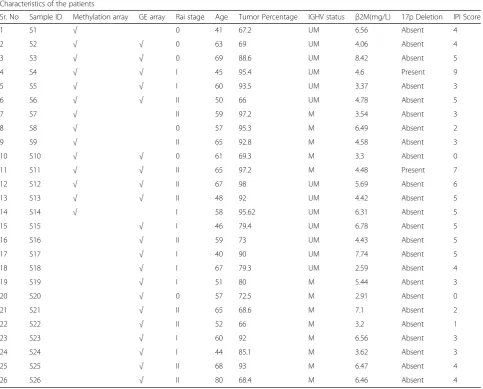
are provided in Table 1. The mRNA expression of 17 of the genes identified to be differentially methylated and /or differentially expressed was validated using SYBR-green based RQ-PCR in 93 (Unmutated = 39, Mutated = 54) CLL patients. The median age of the CLL patients was 60 years (range 35–80 years). With a median follow-up time of 22 months (range 1-124 months), 46 patients required treatment [median time to treatment: 14 months (range 0–92 months)] and 18 patients died. On the basis of international prog-nostic index (IPI) score [22], 11/93 patients were assigned as low risk, 34/93 as intermediate risk, 43/93 as high risk, and 5/93 as very high risk patients.
IGHV mutation status
IGHVgene family usage was evaluated as per BIOMED-2 protocol [BIOMED-23] and the patients were assigned to IGHV mutated or unmutated subgroups based on theIGHV se-quence homology (cut-off = 98%) as determined by the international ImmunoGeneTics database (IMGT; http:// imgt.cines.fr, Montpellier, France).
Methylated CpG island microarrays
Genomic DNA was extracted from the peripheral blood mononuclear cells (PBMC) of CLL patients (n= 14) and CD19+sorted cells pooled from 10 healthy individuals. To isolate the CD19+ cells, mononuclear cells isolated from peripheral blood of healthy individuals were incubated with CD19 + magnetic microbeads and processed accord-ing to the manufacturer’s protocol (Milteneyi Biotech, Gladbach, Germany). In healthy individuals, CD19+ cells constitute 2-3% of the leukocyte fraction and therefore, sorted CD19+ B-cells from healthy individuals were used. In the CLL samples evaluated for microarrays, CD19+ cells constituted at least ≥65% of the leukocytes and the PBMC fraction from CLL patients was used for the study.
Louis, MO, USA), labelled with Cy3- and Cy5-dUTP, re-spectively, and hybridized on 1x244K human promoter chIP-on-chip microarray slides as per the manufacturer’s recommendations (Agilent Technologies, Santa Clara, CA, USA). The slides were washed and scanned on the Agilent DNA microarray scanner D and the data was extracted with Feature Extraction® software FE version 11.5 (Agilent Technologies, Santa Clara, CA, USA).
Gene expression microarray
Total RNA obtained from PBMC of CLL patients (n= 21) and CD19+ sorted cells pooled from 10 healthy individ-uals was amplified and simultaneously labelled with Cy3-CTP using low input quick amp labelling kit (Agilent Technologies, Santa Clara, CA, USA). The labelled prod-uct was finally hybridized to SurePrint G3 Human Gene Expression 8x60K microarray slide as per manufacturer’s recommendation (Agilent Technologies, Santa Clara, CA,
USA). The slides were washed and scanned on the Agilent DNA microarray scanner D and the data was extracted with Feature Extraction® software FE version 11.5 (Agilent Technologies, Santa Clara, CA, USA). These samples included seven CLL samples profiled for DNA methyla-tion status.
Bisulfite genome sequencing
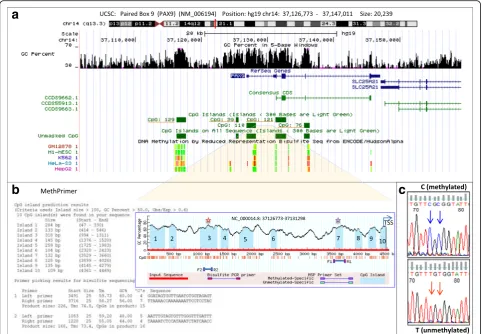
Genomic DNA (2μg) was bisulfite modified and purified using Epitect Bisulfite kit as per the manufacturer’s in-structions (Qiagen, Hilden , Germany). The bisulfite converted DNA was amplified for two CpG islands in
PAX9 gene as depicted in Fig. 1 and sequenced with BigDye Terminator v3.1 Cycle Sequencing kit (Applied Biosystems, CA, USA) with primers designed using MethPrimer (http://www.urogene.org/cgi-bin/methpri-mer/methprimer.cgi). The percent methylation levels were computed and further analysed with Bisulfite
Table 1Clinical and laboratory characteristics of the CLL patients evaluated using methylation and gene expression arrays
Characteristics of the patients
Sr. No Sample ID Methylation array GE array Rai stage Age Tumor Percentage IGHV status β2M(mg/L) 17p Deletion IPI Score
1 S1 √ 0 41 67.2 UM 6.56 Absent 4
2 S2 √ √ 0 63 69 UM 4.06 Absent 4
3 S3 √ √ 0 69 88.6 UM 8.42 Absent 5
4 S4 √ √ I 45 95.4 UM 4.6 Present 9
5 S5 √ √ I 60 93.5 UM 3.37 Absent 3
6 S6 √ √ II 50 66 UM 4.78 Absent 5
7 S7 √ II 59 97.2 M 3.54 Absent 3
8 S8 √ 0 57 95.3 M 6.49 Absent 2
9 S9 √ II 65 92.8 M 4.58 Absent 3
10 S10 √ √ 0 61 69.3 M 3.3 Absent 0
11 S11 √ √ II 65 97.2 M 4.48 Present 7
12 S12 √ √ II 67 98 UM 5.69 Absent 6
13 S13 √ √ II 48 92 UM 4.42 Absent 5
14 S14 √ I 58 95.62 UM 6.31 Absent 5
15 S15 √ I 46 79.4 UM 6.78 Absent 5
16 S16 √ II 59 73 UM 4.43 Absent 5
17 S17 √ I 40 90 UM 7.74 Absent 5
18 S18 √ I 67 79.3 UM 2.59 Absent 4
19 S19 √ I 51 80 M 5.44 Absent 3
20 S20 √ 0 57 72.5 M 2.91 Absent 0
21 S21 √ II 65 68.6 M 7.1 Absent 2
22 S22 √ II 52 66 M 3.2 Absent 1
23 S23 √ I 60 92 M 6.56 Absent 3
24 S24 √ I 44 85.1 M 3.62 Absent 3
25 S25 √ II 68 93 M 6.47 Absent 4
26 S26 √ II 80 68.4 M 6.46 Absent 4
Sequencing DNA Methylation Analysis (BISMA) software (http://services.ibc.uni-stuttgart.de/BDPC/BISMA/).
Real-time quantitative PCR (RQ-PCR)
The mRNA expression based microarray findings were validated using RQ-PCR in an independant cohort of 93 early stage CLL patients for 17 genes with gene-specific primers (Additional file 1: Table S1). The experiments were performed using SYBR Green Master Mix according to the manufacturer’s protocol on Mx3005P (Agilent Technologies, Santa Clara, CA, USA). The fold change was calculated using 2-ΔΔCtmethodwith beta-actinas an endogenous control. The Receiver’s operating characteris-tic (ROC) curve-derived cut-off values were used to define high or low mRNA expression levels.
Bioinformatics analysis and statistics
Methylation array data was analyzed using Genomic Workbench version 7.0 (Agilent Technologies, Santa Clara, CA, USA). On the basis of melt temperature, log-ratio data
for each probe was normalized. By taking into account the Gaussian-fit curves, Z score was generated for each sample andpvalues were calculated. Thepvalues were then used to determine the log-odds score for each probe. The differentially hypermethylated and hypomethylated probes between groups were filtered based on the minimum value of log2-fold change (log2FC) between the groups =0.25, p< 0.05 and the false discovery rates (FDR) of 0.2 [24].The probes with log2FC≤(-)0.25 were considered hypomethylated and≥(+)0.25 were considered hypermethylated.
The gene expression data across all arrays was log2 transformed and normalized using quantile normalization and analyzed by the Lima library from R-Bioconductor. Probes with an adjusted p-value less than 0.05 and log2FC of 1 were selected.
The correlation of log-odds values obtained from the DNA methylation arrays (p< 0.05, log2FC = 0.25) and the expression arrays for the identified genes was used as an in-dicator of the correlation between DNA methylation and
gene expression. The probes showing hypomethylation (log2FC≤(-)0.25, p< 0.05) in conjunction with higher ex-pression (log2 FC > 1,p< 0.05) between any two compared conditions were identified. Similarly, the probes exhibiting hypermethylation (log2FC≥0.25, p< 0.05) in conjunction with lower expression (log2 FC < (-)1, p< 0.05) were also identified.
Receiver’s operating characteristic curve was used to cal-culate the cut-off value to determine the low and high ex-pression of a particular gene. The differences in mRNA expression between the groups as obtained from RQ-PCR were compared using the Mann-Whitney Rank Sum test or Kruskal-Wallis One Way Analysis of Variance on Ranks. The relative risk (RR) of treatment initiation was assessed using the Chi-square statistic with Yate’s continuity correc-tion. The time to first treatment (TTFT) and overall sur-vival (OS) were compared between the groups using the Kaplan-Meier survival analysis followed by the log-rank test. Hazard ratio (HR) for each variable was calculated using the Cox proportional hazard regression (Sigma Plot Version 13.0, Systat Software, Inc.).
Data access
The DNA methylation as well as the mRNA expression data generated in the study have been submitted to the NCBI Gene Expression Omnibus (GEO) (http:// www.ncbi.nlm.nih.gov/geo/) under accession number GSE81937.
Results
Methylation profile
A comparison of differential methylation between CLL (n= 14) and normal CD19+ B-cells identified a total of 6129 probes to be differentially methylated which were further classified as hypermethylated (5254 probes, 2505 genes) or hypomethylated (875 probes, 753 genes). The differentially methylated probes that represented un-known genes, non-coding RNAs, hypothetical proteins, chromosomal loci, predicted open reading frames, and probes associated with sex-chromosomes were excluded from the downstream analysis. Among the differentially methylated probes, 53.8% of hypermethylated probes were located inside known gene bodies, 38.2% in the promoters, 2.6% in divergent promoters and 5.2% were located downstream of the known genes (Fig. 2a). The frequency distribution of the hypomethylated probes (Fig. 2b) was comparable to the hypermethylated probes. Of the differentially methylated probes, CpG sites were found in 73% of the hypermethylated probes and in 81% of the hypomethylated probes. The details pertaining to these probes, including the gene name, chromosomal lo-cation and distribution are provided in Additional file 1: Tables S2A and S2B.
On the basis of gene functions, the CpG islands in the promoter regions of the tumor suppressor genes (KLF4,
PTCH1, PAX5, PCDH10, RASSF10, IRX1, TBX5, ID4,
SOX7, SLIT2) and the transcription factors (TWIST1,
KLF4, TAL1, PAX2, PAX9, NR2F2, IRX4, MEIS1) were found to be hypermethylated. Approximately, 10% of the hypermethylated CpG promoters were located within the homeobox genes. Promoter regions of genes such as
FOXD3, FOXE1, FOXG1, ID4, SLIT2, BNC1, SALL1,
RIPK4, HAND2, SOX9, SOX11, NR2F2, TAL1, SIM2,
PAX9, andTBX2were also found to be hypermethylated in sync with earlier reported results in CLL [16, 19, 25]. In addition, hypomethylation was observed in the promoter region of NFATC1 and inside gene body in NOTCH1,
SFRP1, andGPSas has been reported in earlier studies in CLL [19, 25]. Using the Database for Annotation, Visualization and Integrated Discovery (DAVID) func-tional analysis tool, the differentially methylated genes were evaluated for the overrepresented Gene Ontology (GO) categories and the most significant overrepresented GO biological processes were found to be related to regu-lation of transcription (p< 0.0001) [26, 27].
To identify the association of differential methylation profile with the IGHV mutation status, the methylation array data from 9IGHVunmutated and 5IGHVmutated cases was compared. This analysis elicited a distinct signa-ture of 56 hypermethylated (p< 0.05, log2FC≥0.25) and 2402 hypomethylated probes (p< 0.05, log2FC≤(-)0.25) in unmutated CLL. The hypermethylated probes were dis-tributed across 46 genes and spanned promoter regions of 10 genes (Additional file 1: Table S3A).Similarly, the hypomethylated probes spread across 1332 genes and spanned promoter regions of 399 genes (Additional file 1: Table S3B). Differential methylation of several genes previ-ously reported in the IGHV mutation based subgroups [NCOR2, KCNJ2, SIX3, CHRM1, [16]], [NRF1, CRY1,
KCNJ2,SOX5[28]] was also noticed in the present study. In addition, differential CpG promoter hypomethylation of genes already known to influence clinical outcome in other malignancies was observed and includes EMILIN2 [29], TBX5 [30], CBX8 [31],OLIG2 [32], and PCDH10 [33]. The DAVID database was used to identify biological pathways for the differentially methylated genes. Four of the Kyoto Encyclopedia of Genes and Genomes (KEGG) pathways including circadian rhythm pathway (p= 0.002), calcium signalling pathway (p= 0.03), axon guidance (p= 0.02), and gap junction pathway (p= 0.04) were found to be significantly affected in theIGHVunmutated Vs. mu-tated subgroup.
Correlation of methylation and gene expression analysis
the DNA methylation profiles and co-analyzed. On com-paring the data of CLL patients with healthy individuals, a negative correlation in CpG methylation and gene ex-pression was observed for 211genes (Additional file 1: Table S4). Of these, 149 genes were hypermethylated and downregulated and 62 genes were hypomethylated and upregulated including AXIN2, ID4, EBF1, SOX4,
SOX7,TAL1,PMEPA1, SPRY1,CDK6, andMEIS1. Path-way analysis using the genes having negative correlation for DNA methylation and gene expression in CLL Vs. normal CD19+ cells identified significant enrichment of three KEGG pathways which included p53 signalling pathway (p= 0.002), pathways in cancer (p= 0.005), and the cell cycle pathway (p= 0.007).
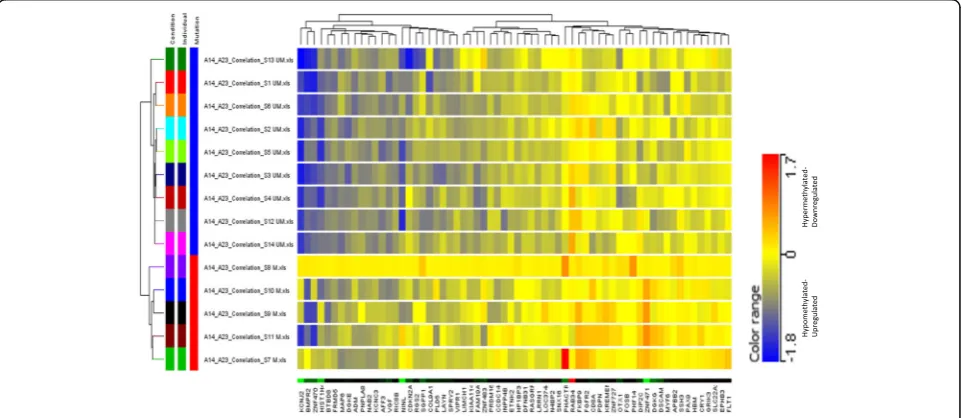
A comparison of the CpG methylation and gene ex-pression profiles among the IGHV unmutated Vs. mu-tated patients identified 64 differentially expressed genes (Fig. 3) including BMPR2, CRY1, FGFR2, FOSB,
INPP4B, PLD5, PAX9, RGS2, RIC8B, and VIPR1 (Additional file 1: Table S5).
Of the various genes found to be differentially methyl-ated and/or differentially expressed, a total of 17 genes (Table 2) were validated using RQ-PCR on a cohort of 93 (22 female: 71 male) early stage CLL patients and pooled CD19+ B cells from 10 healthy volunteers. The criteria for selection of these genes was negative correl-ation between CpG promoter methylcorrel-ation and gene ex-pression in CLL Vs. normal (MEIS1, PMEPA1, SOX7,
SPRY1, CDK6, ID4, AXIN2, TNRC18) and in the IGHV unmutated Vs. mutated subgroup (CRY1,VIPR1, PAX9,
RIC8B). Other genes selected for validation included
NFATC1 (hypomethylated in CLL), TBX2, TSHZ3 (hypermethylated in CLL), SPRY2 (upregulated in CLL) and BIK (downregulated in CLL). We focused on these five genes as they had previously been shown in the lit-erature to be epigenetically influenced in CLL [NFATC1
Fig. 2Distribution ofahypermethylated andbhypomethylated probes in CLLVs.CD19+ normal controls
[11]], or in other malignancies [BIK [34], SPRY2 [35],
TBX2 [36, 37], TSHZ3 [38, 39]]. As expected, MEIS1,
PMEPA1, SOX7, SPRY1, CDK6, TBX2 were significantly downregulated (p< 0.05) while SPRY2 (p= 0.016),VIPR1 (p= 0.04) andID4(p= 0.03) were significantly upregulated in CLL cells as compared to healthy B-cells. Though not significant, AXIN2 was upregulated and TNRC18,
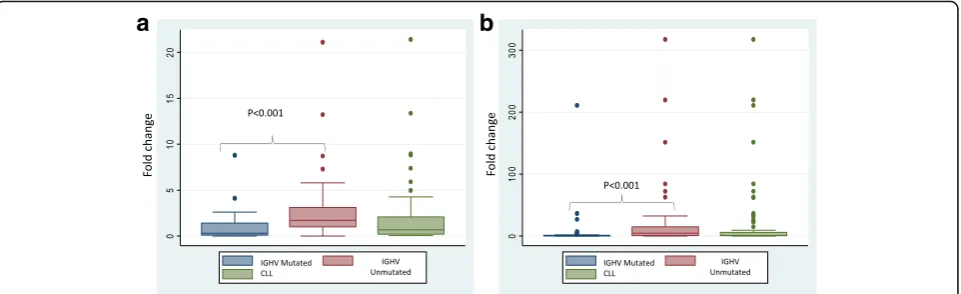
NFATC1 and BIK were downregulated in CLL as com-pared to healthy CD19+ cells (Table 2). The expression of onlyCRY1andPAX9differed significantly (p< 0.05) with respect to theIGHVmutation status (Table 2, Fig. 4)
The status of hypomethylation ofPAX9among unmu-tated CLL was confirmed through bisulfite genome se-quencing of CpG island 3 in close proximity to CpG110
Table 2Comparison of mRNA levels of selected genes (medianΔCq and median fold change) as assessed by real time RQ-PCR in CLL (n= 93; unmutated = 39; mutated = 54) and CD19+ sorted B-cells from healthy individuals (n= 10)
Comparison of levels of mRNA expression of selected genes in CLL
S.No. Gene CLL Vs. normal Mutated CLL Vs. unmutated CLL
Group MedianΔCq Median fold change pvalue IGHV Mutation status MedianΔCq Median fold change pvalue
1. CRY1 CLL 8.61 0.75 0.91 Mutated 9.8 0.31 <0.001
19+ Normal 8.29 Unmutated 7.46 1.73
2. MEIS1 CLL 13.03 0.07 0.01 Mutated 12.85 0.05 0.85
19+ Normal 8.87 Unmutated 12.63 0.06
3. ID4 CLL 13.75 4.37 0.03 Mutated 13.51 3.89 0.45
19+ Normal 15.7 Unmutated 13.71 3.2
4. TNRC18 CLL 13.21 0.64 0.43 Mutated 12.93 0.62 0.6
19+ Normal 12.53 Unmutated 13.34 0.59
5. NFATC1 CLL 8.43 0.5 0.47 Mutated 8.86 0.39 0.37
19+ Normal 7.54 Unmutated 8.37 0.57
6. CDK6 CLL 12.65 0.2 0.02 Mutated 12.65 0.25 0.7
19+ Normal 10.48 Unmutated 12.65 0.26
7. VIPR1 CLL 6.62 7.9 0.04 Mutated 6.5 6.96 0.32
19+ Normal 9.34 Unmutated 5.98 11.4
8. SPRY1 CLL 12.75 0.04 <0.001 Mutated 12.18 0.05 0.28
19+ Normal 8.49 Unmutated 12.7 0.03
9. PAX9 CLL 12.29 0.81 0.66 Mutated 12.8 0.37 <0.001
19+ Normal 11.61 Unmutated 9.28 4.61
10. PMEPA CLL 12.33 0.01 <0.001 Mutated 12.32 0.01 0.47
19+ Normal 5.52 Unmutated 11.72 0.01
11. TBX2 CLL 16.92 0.1 0.004 Mutated 16.42 0.08 0.67
19+ Normal 13.45 Unmutated 16.91 0.08
12. TSHZ3 CLL 10.9 1.19 0.81 Mutated 10.57 1.15 0.56
19+ Normal 10.97 Unmutated 11.18 0.82
13. BIK CLL 8.27 0.4 0.5 Mutated 8.4 0.44 0.54
19+ Normal 7.26 Unmutated 8.08 0.53
14. SPRY2 CLL 10.2 6.2 0.02 Mutated 9.78 6.59 0.42
19+ Normal 12.4 Unmutated 10.26 4.6
15. AXIN2 CLL 9.8 6.3 0.23 Mutated 9.2 4.79 0.56
19+ Normal 11.77 Unmutated 8.91 6.66
16. SOX7 CLL 11.93 0.18 0.02 Mutated 11.65 0.18 0.99
19+ Normal 9.23 Unmutated 11.92 0.16
17. RIC8B CLL 8.77 1.85 0.38 Mutated 8.59 1.85 0.78
19+ Normal 9.61 Unmutated 8.72 1.75
(Fig. 1).While CpG island 7 did not reveal any significant difference in methylation levels, the average % methyla-tion at CpG island 3 was found to be 52.74% in mutated while 24.72% among unmutated CLL. This further cor-roborates with the reduced expression of PAX9 in unmutated group of CLL patients as established through microarray-based observations.
Association between gene expression and clinical outcome
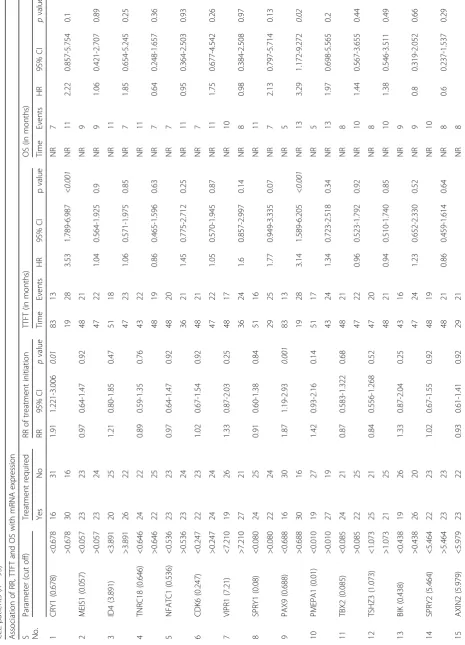
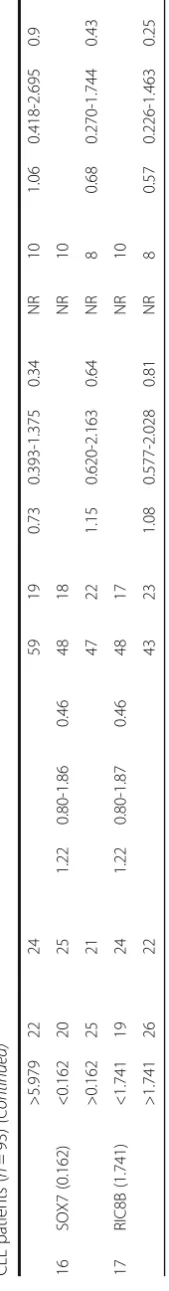
Of the 17 genes evaluated for mRNA expression,CRY1(p = 0.008) and PAX9 (p< 0.001) were expressed at higher levels in Rai stage I and II as compared to stage 0. A pro-gressive increase in the expression of CRY1 (p= 0.004) andPAX9(p< 0.001) was observed in increasing IPI score categories ranging from 1 to 4. We further explored the association between expression level of candidate genes with relative risk of treatment initiation, TTFT and OS (Table 3). The relative risk of treatment initiation was signifi-cantly higher with high expression of PAX9 (p= 0.001) or
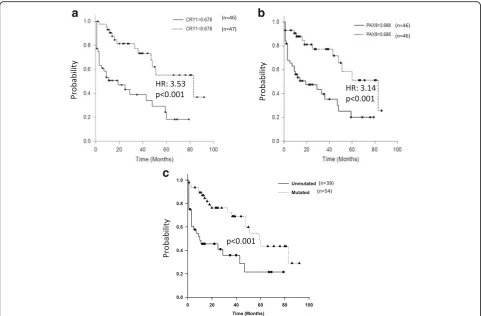
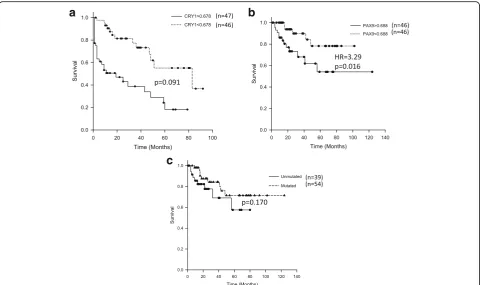
CRY1(p= 0.005). The high expressions of bothPAX9 (HR 3.14, 95% CI 1.589–6.205,p< 0.001) as well as CRY1 (HR 3.53, 95% CI 1.789–6.987,p< 0.001) were significantly asso-ciated with shorter TTFT (Fig. 5). However, high expression of onlyPAX9gene (HR 3.29, 95% CI 1.172–9.272,p= 0.016) was significantly associated with shorter OS (Fig. 6).
Discussion
Extremely variable clinical course of early stage CLL pa-tients highlights the importance of well-described prog-nostic markers for clinical management of these patients. Various prognostic markers that are currently in use includeIGHV mutational status [2], genomic ab-normalities [3], expression ofZAP-70[4], and CD38 [2]. Recent studies have associated specific DNA methylation signatures with specific prognostic subgroups in CLL [14–16, 19]. The present study has dealt with the
methylation profiling of early stage CLL patients on the basis of theirIGHVmutational status.
The study has identified differential methylation of several genes such as NCOR2, SIX3, CHRM1, NRF1,
CRY1,KCNJ2, andSOX5that have been reported earlier to be differentially methylated in the IGHV-gene based subgroups [16, 28]. Besides, an association of promoter hypomethylation of MYLK with the IGHV unmutated cases was also observed in the current study. Since, higher expression ofMYLK is known to be significantly correlated with poor clinical outcome [40], it is plausible that promoter hypomethylation of MYLK in the IGHV unmutated cases might be associated with poor progno-sis. Furthermore, differential CpG promoter hypomethy-lation of two important hematopoietic transcription factors MEIS1 and TAL1 which are known methylation targets in B-cell ALL was also observed [41].
An analysis of signalling pathway network for genes with perturbed methylation profiles observed among
IGHV unmutated patients indicated the involvement of calcium signalling pathway. Previous studies have sug-gested that altered Ca2+ signalling contributes to major tumor progression events including proliferation, migra-tion, invasion, and metastasis [42, 43]. Recently, Muggen et al. [44] demonstrated an association of theIGHV mu-tational status with the level of basal Ca2+ signalling in CLL. The present study provides evidence that aberrant methylation of genes involved in the calcium signalling pathway might be one of the mechanisms responsible for net differences in the basal Ca2+signalling events.
In the present analysis, an inverse correlation between methylation and gene expression was observed for 209 genes in CLL including transcription factors (ID4,
NFATC1, TBX2, TAL1, MEIS1), SPRY family members (SPRY1, SPRY2) and SOX family members (SOX4,
SOX7). Correlation of promoter methylation ofID4gene with shortened patient survival has been already
Table
3
Association
of
relative
risk
of
treatment
initiation,
time
to
first
treatment
and
overall
survival
with
the
mRN
A
expression
of
17
genes
selected
CLL
patients
(
n
=
93)
(Continued)
>5.979
22
24
59
19
0.73
0.393-1.375
0.34
NR
10
16
SOX7
(0.162)
<0.162
20
25
1.22
0.80-1.86
0.46
48
18
NR
10
>0.162
25
21
47
22
1.15
0.620-2.163
0.64
NR
8
17
RIC8B
(1.741)
<1.741
19
24
1.22
0.80-1.87
0.46
48
17
NR
10
>1.741
26
22
43
23
1.08
0.577-2.028
0.81
NR
8
Abbreviations
used:
RR
relative
risk,
TTFT
time
to
first
treatment,
OS
overall
survival,
NR
not
reached,
HR
hazard
ratio
The
statistically
significant
p
values
are
shown
in
documented in CLL [45]. An association of methylation of TBX2 [37] and SPRY2 [35] with disease progression has also been demonstrated in bladder cancer and B-cell diffuse lymphoma, respectively, but so far, no studies have been reported in CLL.
Screening of inversely correlated genes associated with IGHV mutation status revealed only 21 gene promoters to be significantly hypomethylated and upregulated in unmutated cases (Additional file 1: Table S5). One of these genes encodes for bone mor-phogenetic protein (BMP) receptor II which is a serine/threonine receptor kinase and has previously been shown to be involved in molecular pathogenesis of hematological malignancies including acute myelo-monocytic leukemia, acute promyelocytic leukemia, multiple myeloma as well as CLL [46, 47]. Cell sur-face expression of BMP receptors (BMPRIA and BMPRIB) have been shown to be elevated in ad-vanced stages of CLL [47]. In-vitro studies have shown that co-expression of BMPRII facilitates BMP binding to its receptors and therefore contributes to downstream biological functions [48, 49]. This is in line with the results of the present study wherein up-regulated BMPRII gene expression and
hypomethylation of BMPRII gene was noticed among unmutated subgroup of CLL patients.
Alterations in methylation status and associated gene expression levels of another gene CRY1 have also been reported in prognostically distinct subsets of CLL [50] as well as in CML [51]. Our study confirms the possible in-fluence of hypomethylation and upregulated expression of CRY1 in prognostically poor IGHV unmutated CLL and further emphasises its role as potential biomarker for relative risk of treatment initiation and TTFT in early stage CLL. In addition toCRY1, three other circa-dian rhythm genesNPAS2,BHLHE40, andARNTLwere also observed to be hypomethylated in the unmutated subgroup [52].
PAX9 is one of the nine members of "paired box” (PAX)-containing transcription factor family and its hibition has been shown to induce apoptosis with in-creased cleavage of caspase-3 and PARP, increased expression ofBAXand decreased expression ofBCL-2in oral squamous cell carcinoma [53]. In the recent years, it has emerged as one of the biomarkers of cell prolifera-tion in lung cancer [54]. A significant associaprolifera-tion of
PAX9 expression with stage, IPI score, relative risk of treatment initiation, TTFT and OS in the present study
strengthens its role as an important marker of prognosis in CLL as well.
Since levels of expression of eitherPAX9orCRY1did not show significant difference in CLL patients when compared to healthy controls but rather between patients subgrouped on the basis of theIGHV mutational status, it is plausible that these two genes may be involved in progression of CLL rather than development of the disease. This explan-ation is further supported by progressively increasing gene expression levels ofPAX9andCRY1in coherence with ad-vanced Rai stage and higher IPI scores. The mechanism(s) underlying such an influence of these two genes in CLL pathogenesis are not known but might involve apoptotic [53, 55–57], or analogous pathways involved in cancer.
Besides, several aberrantly methylated genes were also identified in IGHV mutational status based subgroups which could serve as potential markers in CLL. The major limitation of the present study was that a limited number of genes were evaluated in a small cohort of early stage CLL patients. Further studies on large cohorts of early stage CLL patients for expression pat-terns of additional set of genes are required that may help in characterizing the functional role of the genes identified in the present study. Identification of relevant epigenetically influenced genes that have an impact on gene expression as well as clinical outcome may pave
way for identification and development of therapeutically relevant drug targets.
Conclusions
The present study confirms the prognostic role of CRY1 in CLL as its aberrant methylation and expression is as-sociated with high risk of treatment initiation and shorter time to first treatment. In addition, this study highlightsPAX9as a novel marker of prognostication in CLL as its expression was significantly associated with high risk of treatment initiation, shorter time to first treatment and overall survival.
Additional file
Additional file 1: Table S1.List of primers used in RQ-PCR studies. Table S2A.List of probes hypermethylated in CLL in comparison to CD19+ cells from healthy individuals.Table S2B.List of probes hypomethylated in CLL in comparison to normal CD19+ cells.Table S3A.List of probes hypermethylated in unmutated in comparison to mutated CLL.Table S3B. List of probes hypomethylated in unmutated CLL in comparison to mutated CLL.Table S4.List of genes having negative correlation for methylation and gene expression in CLL as compared to normal 19+ cells.Table S5.List of genes having negative correlation for methylation and gene expression in unmutated CLL as compared to mutated CLL. (XLS 1339 kb)
Acknowledgements
We acknowledge Mr. Dhritiman Dan for the technical support.
Funding
The financial support was provided by the Department of Biotechnology (BT/PR11106/GBD/27/145/2008, BT/PR15438/MED/30/606/2011 and BT/ PR8680/AGR/36/754/2013), Ministry of Science and Technology, Government of India; and All India Institute of Medical Sciences, New Delhi (8-60/A060/ 2011/RS) to RG for carrying out this research work.
Availability of data and materials
The DNA methylation as well as expression data generated in the study have been submitted to the NCBI Gene Expression Omnibus (GEO) (http:// www.ncbi.nlm.nih.gov/geo/) under accession number GSE81937.
Authors’contributions
LR and NM performed all the experiments under the guidance of RG, analyzed the experimental data, and wrote the manuscript; RG designed the study, analyzed clinical and experimental data, and wrote the manuscript; GK contributed in validation experiments and reviewed the revised manuscript; AG, LK and AS evaluated the clinical data, and reviewed the manuscript; DS analyzed the experimental data and reviewed the manuscript; JKD helped DS in analysis of experimental data. All authors read and approved the final manuscript.
Competing interests
The authors declare that they have no competing interests.
Consent for publication Not applicable.
Ethics approval and consent to participate
The study was approved by Institute Ethics Committee (AIIMS). All the patients were enrolled in the study after taking informed consent as per the guidelines of the institute ethics committee. The study numbers provided by the committee were: A-03/25.07.2007, IEC/NP-129/2011, IEC/NP-25/2012 and IEC/NP-424/2013.
Publisher’s Note
Springer Nature remains neutral with regard to jurisdictional claims in published maps and institutional affiliations.
Author details
1Laboratory Oncology Unit, Dr. B.R.A.IRCH, All India Institute of Medical Sciences (AIIMS), Ansari Nagar, New Delhi 110029, India.2Department of Medical Oncology, Dr. B.R.A.IRCH, All India Institute of Medical Sciences (AIIMS), Ansari Nagar, New Delhi 110029, India.3Department of Biochemical Engineering and Biotechnology, DBT-AIST International Laboratory of Advanced Biomedicine (DAILAB), Indian Institute of Technology (IIT) Delhi, Hauz Khas, New Delhi 110016, India.
Received: 28 June 2016 Accepted: 18 May 2017
References
1. Chiorazzi N, Rai KR, Ferrarini M. Chronic lymphocytic leukemia. N Engl J Med. 2005;352:804–15.
2. Damle RN, Wasil T, Fais F, Ghiotto F, Valetto A, Allen SL, et al. IgV gene mutation status and CD38 expression as novel prognostic indicators in chronic lymphocytic leukemia. Blood. 1999;94:1840–7.
3. Krober A, Seiler T, Benner A, Bullinger L, Brückle E, Lichter P, et al. V (H) mutation status, CD38 expression level, genomic aberrations, and survival in chronic lymphocytic leukemia. Blood. 2002;100:1410–6.
4. Dürig J, Nückel H, Cremer M, Führer A, Halfmeyer K, Fandrey J, et al. ZAP-70 expression is a prognostic factor in chronic lymphocytic leukemia. Leukemia. 2003;17:2426–34.
5. Gentile M, Mauro FR, Calabrese E, De Propris MS, Giammartini E, Mancini F, et al. The prognostic value of CD38 expression in chronic lymphocytic leukemia patients studied prospectively at diagnosis: a single institute experience. Br J Haematol. 2005;130:549–57.
6. Eisele L, Haddad T, Sellmann L, Dührsen U, Dürig J. Expression levels of CD38 on leukemic B cells but not on non-leukemic T cells are comparably stable over time and predict the course of disease in patients with chronic lymphocytic leukemia. Leuk Res. 2009;33:775–8.
7. Wahlfors J, Hiltunen H, Heinonen K, Hämäläinen E, Alhonen L, Jänne J. Genomic hypomethylation in human chronic lymphocytic leukemia. Blood. 1992;80:2074–80.
8. Rush LJ, Raval A, Funchain P, Johnson AJ, Smith L, Lucas DM, et al. Epigenetic profiling in chronic lymphocytic leukemia reveals novel methylation targets. Cancer Res. 2004;64:2424–33.
9. Raval A, Lucas DM, Matkovic JJ, Bennett KL, Liyanarachchi S, Young DC, et al. TWIST2 demonstrates differential methylation in immunoglobulin variable heavy chain mutated and unmutated chronic lymphocytic leukemia. J Clin Oncol. 2005;23:3877–85.
10. Raval A, Byrd JC, Plass C. Epigenetics in chronic lymphocytic leukemia. Semin Oncol. 2006;33:157–66.
11. Liu TH, Raval A, Chen SS, Matkovic JJ, Byrd JC, Plass C. CpG island methylation and expression of the secreted frizzled-related protein gene family in chronic lymphocytic leukemia. Cancer Res. 2006;66:653–8.
12. Corcoran M, Parker A, Orchard J, Davis Z, Wirtz M, Schmitz OJ, et al. ZAP-70 methylation status is associated with ZAP-70 expression status in chronic lymphocytic leukemia. Haematologica. 2005;90:1078–88.
13. Strathdee G, Sim A, Parker A, Oscier D, Brown R. Promoter hypermethylation silences expression of the HoxA4 gene and correlates with IgVh mutational status in CLL. Leukemia. 2006;20:1326–9.
14. Kanduri M, Cahill N, Goransson H, Enström C, Ryan F, Isaksson A, et al. Differential genome-wide array-based methylation profiles in prognostic subsets of chronic lymphocytic leukemia. Blood. 2010;115:296–305. 15. Cahill N, Bergh AC, Kanduri M, Göransson-Kultima H, Mansouri L, Isaksson A,
et al. 450 K-array analysis of chronic lymphocytic leukemia cells reveals global DNA methylation to be relatively stable over time and similar in resting and proliferative compartments. Leukemia. 2013;27:150–8. 16. Ronchetti D, Tuana G, Rinaldi A, Agnelli L, Cutrona G, Mosca L, et al. Distinct
patterns of global promoter methylation in early stage chronic lymphocytic leukemia. Genes Chromosomes Cancer. 2014;53:264–73.
17. Rahmatpanah FB, Carstens S, Hooshmand SI, Welsh EC, Sjahputera O, Taylor KH, et al. Large-scale analysis of DNA methylation in chronic lymphocytic leukemia. Epigenomics. 2009;1:39–61.
18. Kanduri M, Marincevic M, Halldórsdóttir AM, Mansouri L, Junevik K, Ntoufa S, et al. Distinct transcriptional control in major immunogenetic subsets of chronic lymphocytic leukemia exhibiting subset-biased global DNA methylation profiles. Epigenetics. 2012;7:1435–42.
19. Tong WG, Wierda WG, Lin E, Kuang SQ, Bekele BN, Estrov Z, et al. Genome-wide DNA methylation profiling of chronic lymphocytic leukemia allows identification of epigenetically repressed molecular pathways with clinical impact. Epigenetics. 2010;5:499–508.
20. Jones PA. Functions of DNA methylation: islands, start sites, gene bodies and beyond. Nat Rev Genet. 2012;13:484–92.
21. Rai K. A critical analysis of staging in CLL. In: Gale R, Rai K, editors. Chronic Lymphocyte Leukemia: Recent progress and future direction. New York, NY: Alan R Liss; 1987. p. 59–253.
22. Kutsch N, Bahlo J, Byrd J C, Dohner H, Eichhorst B, Else M, et al. The international prognostic index for patients with CLL (CLL-IPI): An international meta-analysis. Journal of Clinical Oncology, ASCO Annual Meeting Abstracts. 2015; 33, suppl; abstr 7002.
23. van Dongen JJ, Langerak AW, Brüggemann M, Evans PA, Hummel M, Lavender FL, et al. Design and standardization of PCR primers and protocols for detection of clonal immunoglobulin and T-cell receptor gene recombinations in suspect lymphoproliferations: report of the BIOMED-2 Concerted Action BMH4-CT98-3936. Leukemia. 2003;17:2257–317. 24. Provençal N, Suderman MJ, Guillemin C, Vitaro F, Côté SM, Hallett M, et al.
Association of childhood chronic physical aggression with a DNA methylation signature in adult human T- cells. PLoS One. 2014;9, e89839. 25. Pei L, Choi J, Liu J, Lee E, McCarthy B, Wilson JM, et al. Genome-wide DNA
methylation analysis reveals novel epigenetic changes in chronic lymphocytic leukemia. Epigenetics. 2012;7:567–78.
26. da Huang W, Sherman BT, Lempicki RA. Systematic and integrative analysis of large gene lists using DAVID bioinformatics resource. Nat Protoc. 2009;4:44–57. 27. da Huang W, Sherman BT, Lempicki RA. Bioinformatics enrichment tools:
paths toward the comprehensive functional analysis of large gene lists. Nucleic Acids Res. 2009;37:1–13.
33. Narayan G, Freddy A, Xie D, Liyanage H, Clark L, Kisselev S, et al. Promoter methylation-mediated inactivation of PCDH10 in acute lymphoblastic leukemia contributes to chemotherapy resistance. Genes Chromosomes Cancer. 2011;50:1043–53.
34. Hatzimichael E, Dasoula A, Dranitsaris G, Vassou A, Papoudou-Bai A, Stebbing J, et al. BIK (Bcl2-Interacting Killer) CpG methylation status as a potential predictive biomarker of relapsed/refractory multiple myeloma disease. Journal of Clinical Oncology, ASCO Annual Meeting Abstracts.2010; Vol 28, No 15 suppl (May 20 Supplement), 8118.
35. Sanchez A, Setien F, Martınez N, Oliva JL, Herranz M, Fraga MF, et al. Epigenetic inactivation of the ERK inhibitor Spry2 in B-cell diffuse lymphomas. Oncogene. 2008;27:4969–72.
36. Kandimalla R, van Tilborg AA, Kompier LC, Stumpel DJ, Stam RW, Bangma CH, et al. Genome-wide analysis of CpG island methylation in bladder cancer identified TBX2, TBX3, GATA2, and ZIC4 as pTa-Specific prognostic markers. Eur Urol. 2012;61:1245–56.
37. Beukers W, Kandimalla R, Masius R, Vermeij M, Kranse R, Leenders G, et al. Stratification based on methylation of TBX2 and TBX3 into three molecular grades predicts progression in patients with pTa-bladder cancer. Mod Pathol. 2015;28:515–22.
38. Yamamoto M, Cid E, Bru S, Yamamoto F. Rare and frequent promoter methylation, respectively, of TSHZ2 and 3 genes that are both downregulated in expression in breast and prostate cancers. PLoS One. 2011;6, e17149.
39. Dunwell T, Hesson L, Rauch TA, Wang L, Clark RE, Dallol A, et al. A genome-wide screen identifies frequently methylated genes in haematological and epithelial cancers. Mol Cancer. 2010;9:44.
40. Shukla A, Chaturvedi N, Ahrens A, Cutucache C, Mittal A, Bierman P, et al. Stromal tumor microenvironment in chronic lymphocytic leukemia: regulation of leukemic progression. J Leuk (Los Angel). 2013;1:113. 41. Musialik E, Bujko M, Kober P, Wypych A, Gawle-Krawczyk K, Matysiak M, et al.
Promoter methylation and expression levels of selected hematopoietic genes in pediatric B-cell acute lymphoblastic leukemia. Blood Res. 2015;50:26–32. 42. Monteith GR, McAndrew D, Faddy HM, Roberts-Thomson SJ. Calcium and
cancer: targeting Ca2+transport. Nat Rev Cancer. 2007;7:519–30. 43. Monteith GR, Davis FM, Roberts-Thomson SJ. Calcium channels and pumps
in cancer: changes and consequences. J Biol Chem. 2012;287:31666–73. 44. Muggen AF, Pillai SY, Kil LP, van Zelm MC, van Dongen JJ, Hendriks RW, et
al. Basal Ca (2+) signalling is particularly increased in mutated chronic lymphocytic leukemia. Leukemia. 2015;29:321–8.
45. Chen SS, Claus R, Lucas DM, Yu L, Qian J, Ruppert AS, et al. Silencing of the inhibitor of DNA binding protein 4 (ID4) contributes to the pathogenesis of mouse and human CLL. Blood. 2011;117:862–71.
46. GrcevićD, MarusićA, Grahovac B, JaksićB, Kusec R. Expression of bone morphogenetic proteins in acute promyelocytic leukemia before and after combined all trans-retinoic acid and cytotoxic treatment. Leuk Res. 2003;27:731–8. 47. Dzietczenia J, Wróbel T, Jaźwiec B, Mazur G, Butrym A, Poręba R, et al.
Expression of bone morphogenetic proteins (BMPs) receptors in patients with B-cell chronic lymphocytic leukemia (B-CLL). Int J Lab Hematol. 2010;32:e217–21.
48. Gilboa L, Nohe A, Geissendörfer T, Sebald W, Henis YI, Knaus P. Bone morphogenetic protein receptor complexes on the surface of live cells: a new oligomerization mode for serine/threonine kinase receptors. Mol Biol Cell. 2000;11:1023–35.
49. Chen D, Ji X, Harris MA, Feng JQ, Karsenty G, Celeste AJ, et al. Differential roles for bone morphogenetic protein (BMP) receptor type IB and IA in differentiation and specification of mesenchymal precursor cells to osteoblast and adipocyte lineages. J Cell Biol. 1998;142:295–305.
54. Wielscher M, Vierlinger K, Kegler U, Ziesche R, Gsur A, Weinhäusel A. Diagnostic performance of plasma DNA methylation profiles in lung cancer, pulmonary fibrosis and COPD. EBio Medicine. 2015;2:927–34.
55. Gorbacheva VY, Kondratov RV, Zhang R, Cherukuri S, Gudkov AV, Takahashi JS, et al. Circadian sensitivity to the chemotherapeutic agent cyclophosphamide depends on the functional status of the CLOCK/BMAL1 transactivation complex. Proc Natl Acad Sci U S A. 2005;102:3407–12.
56. Kondratov RV, Kondratova AA, Lee C, GorbachevaVY CMV, Antoch MP. Post-translational regulation of circadian transcriptional CLOCK(NPAS2)/BMAL1 complex by cryptochromes. Cell Cycle. 2006;5:890–5.
57. Gauger MA, Sancar A. Cryptochrome, circadian cycle, cell cycle checkpoints, and cancer. Cancer Res. 2005;65:6828–34.
• We accept pre-submission inquiries
• Our selector tool helps you to find the most relevant journal • We provide round the clock customer support
• Convenient online submission • Thorough peer review
• Inclusion in PubMed and all major indexing services • Maximum visibility for your research
Submit your manuscript at www.biomedcentral.com/submit