R E S E A R C H
Open Access
DNA methylation-based subtype prediction for
pediatric acute lymphoblastic leukemia
Jessica Nordlund
1*, Christofer L Bäcklin
2, Vasilios Zachariadis
3, Lucia Cavelier
4, Johan Dahlberg
1,
Ingegerd Öfverholm
3, Gisela Barbany
3, Ann Nordgren
3, Elin Övernäs
1, Jonas Abrahamsson
5, Trond Flaegstad
6,
Mats M Heyman
7, Ólafur G Jónsson
8, Jukka Kanerva
9, Rolf Larsson
2, Josefine Palle
1,10, Kjeld Schmiegelow
11,
Mats G Gustafsson
2†, Gudmar Lönnerholm
10†, Erik Forestier
12†and Ann-Christine Syvänen
1†Abstract
Background:We present a method that utilizes DNA methylation profiling for prediction of the cytogenetic subtypes of acute lymphoblastic leukemia (ALL) cells from pediatric ALL patients. The primary aim of our study was to improve risk stratification of ALL patients into treatment groups using DNA methylation as a complement to current diagnostic methods. A secondary aim was to gain insight into the functional role of DNA methylation in ALL. Results:We used the methylation status of ~450,000 CpG sites in 546 well-characterized patients with T-ALL or seven recurrent B-cell precursor ALL subtypes to design and validate sensitive and accurate DNA methylation classifiers. After repeated cross-validation, a final classifier was derived that consisted of only 246 CpG sites. The mean sensitivity and specificity of the classifier across the known subtypes was 0.90 and 0.99, respectively. We then used DNA methylation classification to screen for subtype membership of 210 patients with undefined karyotype (normal or no result) or non-recurrent cytogenetic aberrations (‘other’subtype). Nearly half (n= 106) of the patients lacking cytogenetic subgrouping displayed highly similar methylation profiles as the patients in the known recurrent groups. We verified the subtype of 20% of the newly classified patients by examination of diagnostic karyotypes, array-based copy number analysis, and detection of fusion genes by quantitative polymerase chain reaction (PCR) and RNA-sequencing (RNA-seq). Using RNA-seq data from ALL patients where cytogenetic subtype and DNA methylation classification did not agree, we discovered several novel fusion genes involvingETV6,RUNX1, andPAX5. Conclusions:Our findings indicate that DNA methylation profiling contributes to the clarification of the heterogeneity in cytogenetically undefined ALL patient groups and could be implemented as a complementary method for diagnosis of ALL. The results of our study provide clues to the origin and development of leukemic transformation. The methylation status of the CpG sites constituting the classifiers also highlight relevant biological characteristics in otherwise unclassified ALL patients.
Keywords:DNA methylation, Pediatric acute lymphoblastic leukemia, CpG site, Subtyping, Cytogenetics, RNA-seq, 450 k array, epigenetics
* Correspondence:jessica.nordlund@medsci.uu.se
†Equal contributors 1
Department of Medical Sciences, Molecular Medicine and Science for Life Laboratory, Uppsala University, Box 1432, BMC, SE-751 44 Uppsala, Sweden Full list of author information is available at the end of the article
Background
The genetic subtypes of pediatric acute lymphoblastic leukemia (ALL) are characterized by large-scale chromo-somal aberrations, such as aneuploidies and transloca-tions [1-3]. Karyotyping, fluorescentin situhybridization (FISH), reverse transcriptase polymerase chain reaction (RT-PCR), and array-based methods for copy number analysis are routinely used to detect high hyperdiploidy (HeH, 51-67 chromosomes), the translocations t(9;22) (q34;q11)[BCR/ABL1], t(12;21)(p13;q22)[ETV6/RUNX1], t(1;19)(q23;p13.3)[TCF3/PBX1], 11q23/MLL -rearrange-ment, dic(9;20)(p13.2;q11.2), and intrachromosomal amplification of chromosome 21 iAMP21[RUNX1X >3], which are recurrent in patients with ALL. Therapy inten-sity for ALL patients is determined by risk assessment based on presenting features, such as white blood cell count, B- or T-lineage, genetic aberrations, and minimal residual disease after induction treatment [4,5]. The accur-acy of detecting chromosomal abnormalities by karyotyp-ing, FISH, and PCR is generally high; however, these methods do not allow detection of all the aberrations that may occur [6]. Moreover, 15% of ALL patients harbor complex, non-recurrent genomic aberrations and would benefit from improved diagnostic subtyping to identify potential high-risk aberrations.
Methylation of cytosine (5mC) residues in CpG dinu-cleotides is an epigenetic modification that plays a pivotal role in the establishment of cellular identity by influencing gene expression [7,8]. There are approxi-mately 28 million CpG sites in the human genome that are targets for DNA methylation. The pathogenesis and phenotypic characteristics of leukemic cells are partially explained by specific and genome-wide alterations in DNA methylation [9-17]. We and others have previously observed a strong correlation between cytogenetic subtype and DNA methylation in ALL, which indicates that DNA methylation profiling may serve as a proxy for cytogenetic analysis [11,12,14,18].
Herein, we used our previously published 450 k DNA methylation profiling dataset [14] from >500 primary ALL samples comprising eight known recurrent sub-types of ALL to design and evaluate DNA methylation classifiers for subtype prediction. Using extensive cross-validation and methylation-based subtyping in an inde-pendently derived set of ALL patient samples, we show that DNA methylation classification is a highly sensitive and specific method for ALL subtyping. Finally, we aimed to ascertain subtype membership of 210 ALL patients where no subtype information is available and verified the DNA methylation-based subtype predictions with copy number analysis and detection of fusion genes. The classifier and code required for DNA methy-lation classification can be freely downloaded at https:// github.com/Molmed/Nordlund-ALL-subtyping.
Results
Prediction of ALL subtypes using DNA methylation classifiers
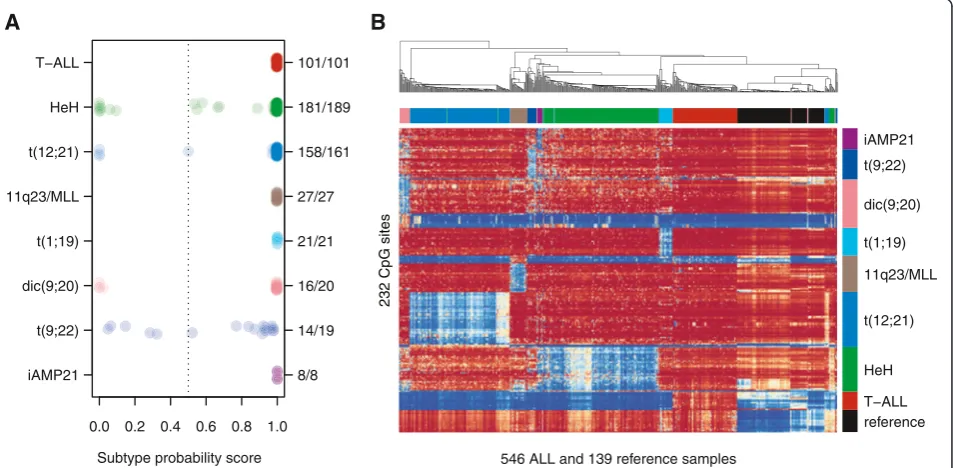
We previously analyzed the genome-wide DNA methyla-tion patterns of 756 primary ALL patients diagnosed between 1996 and 2008 in the Nordic countries [14]. Criteria for selecting patients with established subtypes for the current study included abnormal karyotypes from chromosome banding and/or positive results from tar-geted FISH or RT-PCR analyses. An overview of the pa-tients included in the study can be found in Additional file 1: Figure S1. In total, 546 patients fulfilled these cri-teria and were included in the design of the DNA methy-lation classifier (Table 1, Additional file 2: Table S1). We designed DNA methylation classifiers for the following eight subtypes: T-ALL and the B-cell precursor ALL (BCP-ALL) subtypes HeH, t(12;21), 11q23/MLL, t(1;19), dic(9;20), t(9;22), and iAMP21. We also included a clas-sifier for normal blood cells and patient sex to highlight samples with low blast count and to verify the sex of the patients, respectively. We evaluated the perform-ance of the classifier design procedure by cross-validation (Additional file 1: Figures S2–S3). The best performance in terms of sensitivity and specificity was obtained using a set of 246 consensus CpG sites that contained 14-42 CpG sites per ALL subtype (Additional file 1: Figure S4, Additional file 2: Table S2). During cross-validation, on average, 91% of the ALL samples were assigned to one single correct subtype, 3.4% were assigned to multiple subtypes including the correct subtype, and 5.6% were assigned to an incorrect or no subtype (Table 2). When the consensus classifier was trained on the entire data set, it correctly classified 526 out of the 546 samples (95% CI = 515–532 patients). The consensus classifier failed to predict a subtype for as few as 17 patients in the design set, and of these pa-tients, only three were assigned to have an unexpected subtype (Figure 1A, Additional file 2: Table S1).
All patients with the iAMP21 subtype (n= 8) displayed high prediction scores according to both the iAMP21
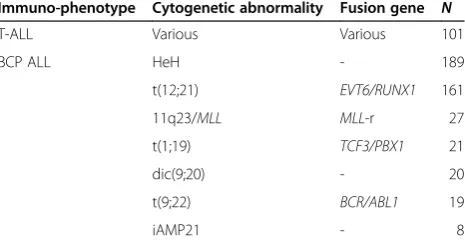
Table 1 Summary of ALL samples with known subtype used to design DNA methylation-based classifiers
Immuno-phenotype Cytogenetic abnormality Fusion gene N
T-ALL Various Various 101
BCP ALL HeH - 189
t(12;21) EVT6/RUNX1 161
11q23/MLL MLL-r 27
t(1;19) TCF3/PBX1 21
dic(9;20) - 20
t(9;22) BCR/ABL1 19
and HeH classifiers, while none of the patients with HeH obtained a high score in the iAMP21 classifier. Twenty-six out of 34 (76%) of the consensus CpG sites in the HeH classifier were hypomethylated in the iAMP21 samples at similar levels as in the HeH sam-ples (mean β-value iAMP21 = 0.36 and HeH = 0.28, Additional file 2: Table S2). The majority of the consen-sus sites for HeH were hypermethylated across all the other ALL subtypes (mean β-value >0.77) (Figure 1B).
It is likely that the consensus classifier for HeH fails to exclude sites where iAMP21 is similar to HeH due to the small number of iAMP21 patients in our study. Furthermore, gains of chromosome 21 are observed in both the iAMP21 and HeH subtypes. Nearly 90% (168/ 189) of HeH patients have one or more extra copy of chromosome 21, and thus iAMP21 and HeH may share some common biological features due to the increased gene dosage on 21q. Of note, the 10% of atypical HeH
Table 2 Performance of classifiers designed using ALL samples with known subtype
Subtype group Mean sensitivity ± SD Mean specificity ± SD Min CpGs (N)a Max CpGs (N)a Consensus CpGs (N)b
Reference 1.00 ± 0.01 0.99 ± 0.01 13 21 17
T-ALL 0.99 ± 0.02 1.00 ± 0.00 7 17 14
HeH 0.94 ± 0.04 0.95 ± 0.02 23 55 34
t(12;21) 0.97 ± 0.04 0.99 ± 0.01 28 2 263 42
11q23/MLL 0.95 ± 0.11 1.00 ± 0.00 16 27 28
t(1;19) 0.91 ± 0.13 1.00 ± 0.00 9 30 21
dic(9;20) 0.78 ± 0.16 0.99 ± 0.01 24 35 37
t(9;22) 0.70 ± 0.25 0.99 ± 0.01 17 41 23
iAMP21 0.81 ± 0.35 1.00 ± 0.00 11 19 16
Sex 0.98 ± 0.01 1.00 ± 0.01 8 12 14
a
The minimum and maximum number of CpG sites chosen by each subtype classifier during cross validation. b
The number of CpG sites chosen for each subtype in the consensus classifier.
0.0 0.2 0.4 0.6 0.8 1.0 iAMP21
t(9;22) dic(9;20) t(1;19) 11q23/MLL t(12;21) HeH T−ALL
8/8 14/19 16/20 21/21 27/27 158/161 181/189 101/101
546 ALL and 139 reference samples
reference T−ALL HeH t(12;21) 11q23/MLL t(1;19) dic(9;20) t(9;22) iAMP21
B
A
232 CpG sites
Subtype probability score
patients without extra copies of chromosome 21, as determined by chromosomal banding at diagnosis, were all accurately classified as HeH.
Blinded validation of ALL subtype classifiers
For independent validation of our DNA methylation classifiers, 39 newly diagnosed ALL patient samples that were not included in the classifier design were analyzed using the 450 k BeadChip (Illumina Inc., San Diego, CA, USA) and subjected to blinded classifica-tion. In total, 36 of the 39 (92%) samples were classified correctly (Figure 2). Review of the clinical diagnosis of the three misclassified samples revealed atypical results in the original chromosomal analyses performed at diagnosis (see Additional file 2: Table S3 for detailed information).
Classification of ALL samples with unknown cytogenetic risk group
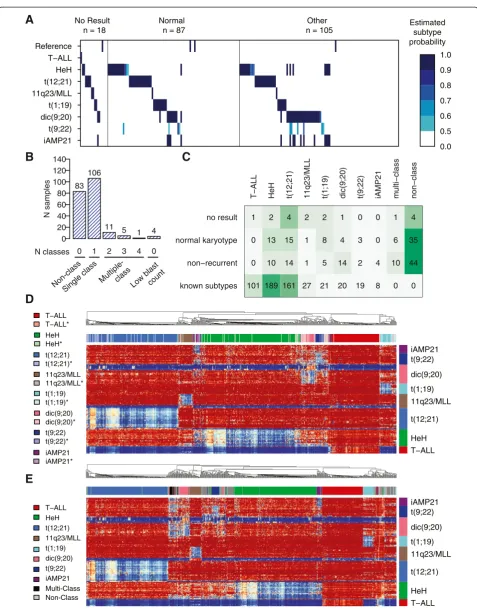
We performed DNA methylation-based subtype classifi-cation of 210 BCP-ALL patient samples with no result (n= 18), normal (n= 87), or non-recurrent karyotype (n= 105) (Figure 3A). In total, 106 of the 210 samples were assigned to one of the recurrent subtypes with an estimated class probability of ≥0.50 (Figure 3B). Because all the iAMP21 patients obtained high scores from both the iAMP21 and HeH classifiers in the design set, we counted all patients with this pattern as iAMP21 only. In total, we assigned a subtype to 50 out of 105 patients in the non-recurrent group, 50 out of 87 patients in the
group with normal karyotype, and 13 out of the 18 pa-tients in the group with no cytogenetic results available (Additional file 2: Tables S4–S6). The distribution of the newly assigned patients from the normal karyotype group and group of patients with no cytogenetic results was as could be expected in a pediatric ALL population (Figure 3C). The methylation profiles of the newly classified samples closely matched those of the group of original samples used to design the classifier and are referred to as‘subtype-like’(Figure 3D, Additional file 1: Figures S5–S12).
A small group of 17 patients classified into two or more groups and are denoted as ‘multi-class’. The most common ‘multi-class’ subtype was double classification as dic(9;20) and t(9;22). Eighty-three patients (~10% of the entire cohort) did not have methylation patterns that are similar to any of the subtype groups, and they were labeled as‘non-class’. Four patients received high scores in the classifier for non-leukemic reference samples and were excluded from further analysis. According to hier-archical clustering, the patients in the‘multi-class’group displayed variable degrees of hypomethylation in the dic (9;20) and t(9;22) consensus CpG sites, which is in agreement with double classification in those subtype groups (Figure 3E, Additional file 1: Figure S13). The ‘non-class’patients separated into three clusters and did not display strong similarities to any of the other known ALL subtypes.
Subtype verification
Verification by karyotype
All patients in the group with non-recurrent aberrations (n= 105) had information from karyotyping performed at diagnosis (Additional file 2: Table S7). We used this information to provide support for the DNA methylation classification (Table 3). Nine out of ten patients with HeH-like methylation profiles had gains of chromosome 21, six of them had 48–49 chromosomes, and three had Down's syndrome (constitutional + chr21). This finding indicates that the methylation status of the genes in the HeH classifier is associated with chromosomal aneu-ploidy. Thus, these patients may share common bio-logical features although they do not have the >50 chromosomes, which is the criteria used to define HeH as a subtype. All iAMP21-like patients (n= 4) and the single patient classified as 11q23-like had aberrations suggestive of, but not conclusive for, the canonical rear-rangements in their karyotype data.
Verification by expressed fusion genes
Targeted analysis using FISH or RT-PCR for ETV6/
RUNX1, MLL rearrangements, PBX1/TCF3, and BCR/
ABL1 had been performed for only 57% of the subtype-like patients at the time of diagnosis. Therefore, it is
T-ALL n=4
HeH n=17
t(12;21) n=14t(1;19) n=2 11q23/MLL
n=2 iAMP21
t(9;22) dic(9;20) t(1;19) 11q23/MLL t(12;21) HeH T−ALL Reference
0.0 0.5 0.6 0.7 0.8 0.9 1.0 Estimated subtype probability
0 1 2 3 4 0
N samples
0 20 40 60 80 100 120 140
83 106
11 5
1 4
11q23/MLL 11q23/MLL*
dic(9;20) dic(9;20)* HeH HeH*
iAMP21 iAMP21* T−ALL T−ALL*
t(1;19) t(1;19)* t(12;21) t(12;21)*
t(9;22) t(9;22)*
iAMP21 t(9;22) dic(9;20) t(1;19) 11q23/MLL t(12;21) HeH T−ALL Reference
No Result n = 18
Normal n = 87
Other n = 105
0.0 0.5 0.6 0.7 0.8 0.9 1.0 Estimated
subtype probability
A
C
B
D
Multi-Class Non-Class
E
11q23/MLL
dic(9;20) HeH
iAMP21 T−ALL
t(1;19) t(12;21)
t(9;22) Non-class
Single class
Multiple-class
N classes
Low blast count
T−ALL HeH t(12;21) 11q23/MLL t(1;19) dic(9;20) t(9;22) iAMP21
T−ALL HeH t(12;21) 11q23/MLL t(1;19) dic(9;20) t(9;22) iAMP21
T−ALL HeH t(12;21) 11q23/MLL t(1;19) dic(9;20) t(9;22) iAMP21 multi−class non−class
known subtypes non−recurrent normal karyotype no result
101 0 0 1
189 10 13 2
161 14 15 4
27 1 1 2
21 5 8 2
20 14 4 1
19 2 3 0
8 4 0 0
0 10
6 1
0 44 35 4
likely that many of the newly classified patients actually harbor the canonical translocations that define the group they were assigned to by our DNA methylation classifier. Re-analysis by RT-PCR for the ETV6/RUNX1 fusion transcript in RNA taken at diagnosis from eight ran-domly selected t(12;21)-like patients with available RNA showed that half of them were positive for ETV6/ RUNX1(Additional file 2: Table S8).
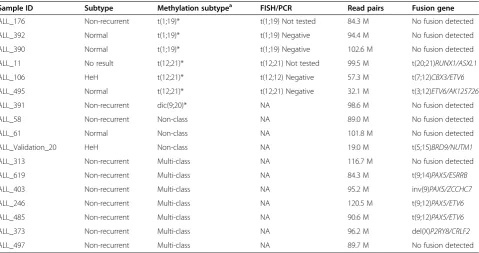
We performed RNA-seq of 17 patients with available high quality RNA for whom cytogenetic subtype infor-mation from ALL diagnosis and the results obtained by the DNA methylation classifier did not agree. In nine out of these 17 patients, we detected expressed fusion genes (Table 4, Additional file 2: Table S9). Three previ-ously unknown fusion genes t(20;21)RUNX1/ASXL1, t(7;12)ETV6/CBX3, and t(3;12)ETV6/AK125726 were identified in patients with t(12;21)-like methylation pro-files. We found that several of the patients assigned to
the ‘multi-class’group according to the DNA methyla-tion classifier harbored fusion genes withPAX5 as one of the fusion partners, including the known t(9;12) PAX5/ETV6 and inv(9p13.2)PAX5/ZCCHC7fusion genes previously reported in ALL [19-21]. We also identified a new fusion gene, t(9;14)PAX5/ESRRB, which to our knowledge has not been previously reported. In an in-fant patient with HeH in the validation cohort who was misclassified as‘non-class’(ALL_validation_20 in Table 4), we identified an additional novel fusion gene, t(5;15) BRD9/NUTM1.
Verification by copy number analysis
Since the 450 k BeadChip assay uses the same reaction principle as SNP genotyping arrays, the 450 k data can be used to detect copy number alterations (CNAs) [22-24]. CNA analysis was applied to identify large-scale chromosomal gains and losses to support the subtype
(See figure on previous page.)
Figure 3Classification of ALL samples with undefined cytogenetic subtypes. (A)Each sample (n= 210) is represented as a vertical bar positioned in its corresponding subtype‘track’according to its allocation by the classifier. The color key to the right of panel(A)shows the estimated subtype probability scores. Probability scores <0.5 are not shown.(B)The distribution of probability scores≥0.5 in the 210 patients. Eighty-three patients were not classified, 106 patients were unequivocally assigned to one subtype, 17 patients were classified into multiple subtype groups, and four patients had high reference scores.(C)The distribution of the number of patients with‘normal’,‘no result’, and‘non-recurrent’karyotypes into subtype-groups. The subtype distribution in the known sample group is also shown.(D)Hierarchical clustering of the original 546 ALL patients of known subtype and the patients newly classified as one unequivocal subtype (n= 106). Patients are clustered on the horizontal axis and the 215 autosomal subtype-specific consensus CpG sites are clustered on the vertical axis and color-coded by subtype classifier. The darker color indicates samples with previously established cytogenetic subtype, and the corresponding lighter color and asterisk (*) indicates newly classified samples. The color key for the patient samples is shown to the left of the heatmap. In the heatmap, blue indicates low and red indicates high methylation levels.(E)Hierarchical clustering and heatmap of the ALL patients of known subtype (n= 546), those newly classified and unequivocally assigned to one subtype (n= 106), patients without classification (n= 83, gray), and patients classified into multiple subtypes (n= 17, black). Four patients with suspected low blast count are not shown.
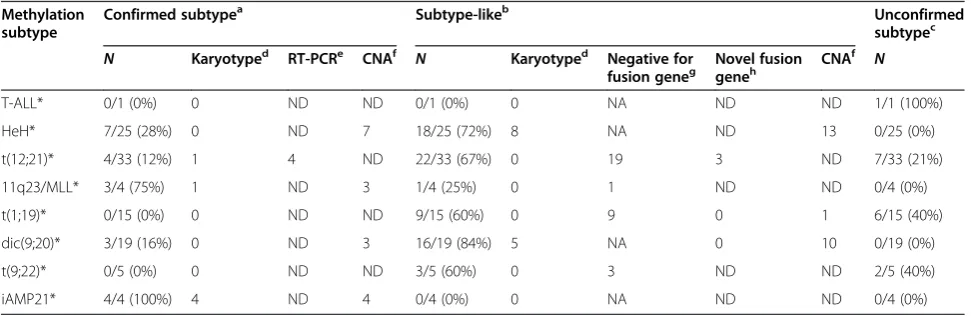
Table 3 Summary of subtype verification results
Methylation subtype
Confirmed subtypea Subtype-likeb Unconfirmed
subtypec
N Karyotyped RT-PCRe CNAf N Karyotyped Negative for
fusion geneg Novel fusiongeneh CNA
f
N
T-ALL* 0/1 (0%) 0 ND ND 0/1 (0%) 0 NA ND ND 1/1 (100%)
HeH* 7/25 (28%) 0 ND 7 18/25 (72%) 8 NA ND 13 0/25 (0%)
t(12;21)* 4/33 (12%) 1 4 ND 22/33 (67%) 0 19 3 ND 7/33 (21%)
11q23/MLL* 3/4 (75%) 1 ND 3 1/4 (25%) 0 1 ND ND 0/4 (0%)
t(1;19)* 0/15 (0%) 0 ND ND 9/15 (60%) 0 9 0 1 6/15 (40%)
dic(9;20)* 3/19 (16%) 0 ND 3 16/19 (84%) 5 NA 0 10 0/19 (0%)
t(9;22)* 0/5 (0%) 0 ND ND 3/5 (60%) 0 3 ND ND 2/5 (40%)
iAMP21* 4/4 (100%) 4 ND 4 0/4 (0%) 0 NA ND ND 0/4 (0%)
*DNA methylation-based subtype group. Asterisks indicate groups classified by DNA methylation. a
Newly classified patients with confirmed verification of their subtype group by at least one verification method. b
Newly classified patients negative for the canonical event that defines their subtype and/or non-canonical event. c
Newly classified patients without a positive or negative result from one of the verification methods. d
Number of patients with a chromosomal aberration observed in karyotyping results determined at diagnosis in NOPHO centers. e
Number of patients positive for respective fusion genes by re-analysis by RT-PCR. f
The number of patients with chromosomal aberrations discovered by array-based copy number alteration (CNA) that support subtype classification. g
The number of subtype-like patients negative for canonical aberrations by targeted analyses (FISH/RT-PCR) at diagnosis. h
classification by DNA methylation in the subtype-like patients, in whom unbalanced large scale chromosomal alterations are expected to occur, such as in HeH, t (1;19), dic(9;20), and iAMP21 (Table 3, Additional file 2: Table S7).
We observed >50 chromosomes in six out of 15 of the HeH-like patients with ‘normal’ or ‘no result’ in the karyotype analysis, suggesting that these patients did in fact harbor aneuploidies that were undetected at diagno-sis (Additional file 1: Figure S14). We also found evi-dence for amplification of chromosome 21q, which is consistent with the iAMP21 subtype in each of the four iAMP21-like patients (Additional file 1: Figure S15). In three out of the 21 dic(9;20)-like patients and in one multi-class patient, we found deletions of chromosome 9p and 20q, which confirm that these four patients harbor dic(9;20). Thirteen out of the 20 remaining dic (9;20)-like patients and 11 out of the 17 ‘multi-class’ patients displayed deletions of various sizes on 9p but lacked 20q deletions (Additional file 1: Figure S16).
We found a breakpoint in the TCF3 locus in one of the t(1;19)-like patients (Additional file 1: Figure S17). The remaining 18 t(1;19)-like patients showed no evi-dence of CNAs on chromosomes 1 or 19, which does not exclude that these patients harbor balanced translo-cations, which are common in this subtype. Although t(9;22) results in a balanced re-arrangement that cannot be detected by CNAs, we screened the t(9;22)-like pa-tients forIKZF1 deletions which are known to occur in
patients with the BCR/ABL1 fusion gene and BCR/ ABL1-like gene expression patterns [25]. In three out of the five t(9;22)-like patients, we detected intragenic IKZF1 deletions or iso(7q), resulting in hemizygous loss ofIKZF1(Additional file 1: Figure S18).
Clinical outcome of the newly classified ALL patients The clinical features of the newly classified patients, in-cluding age, white blood cell count at diagnosis, central nervous system involvement, and outcome were similar to those of the original patients with known subtypes (Table 5). No significant differences in the cumulative incidence of relapse were detected between the newly classified and previously established patient groups (Additional file 1: Figures S19–S20). The multi-class group had an overall favorable prognosis (one relapse in 17 patients), despite the fact that the patients in this group had a median age of diagnosis of 10 years.
Down's syndrome ALL
Nineteen BCP-ALL patients with Down's syndrome (DS-ALL) were included in our study. These patients were not classified separately from ALL patients without DS. Two DS-ALL patients had t(12;21) and one had t (9;22). Each of these three patients was classified cor-rectly according to their cytogenetic subtype. Eight DS-ALL patients had the karyotype‘other’, seven had a ‘normal’karyotype, and one had‘no result’. Only four of the DS-ALL patients were classified as HeH-like, and
Table 4 Fusion gene screening by RNA sequencing
Sample ID Subtype Methylation subtypea FISH/PCR Read pairs Fusion gene
ALL_176 Non-recurrent t(1;19)* t(1;19) Not tested 84.3 M No fusion detected
ALL_392 Normal t(1;19)* t(1;19) Negative 94.4 M No fusion detected
ALL_390 Normal t(1;19)* t(1;19) Negative 102.6 M No fusion detected
ALL_11 No result t(12;21)* t(12;21) Not tested 99.5 M t(20;21)RUNX1/ASXL1
ALL_106 HeH t(12;21)* t(12;12) Negative 57.3 M t(7;12)CBX3/ETV6
ALL_495 Normal t(12;21)* t(12;21) Negative 32.1 M t(3;12)ETV6/AK125726
ALL_391 Non-recurrent dic(9;20)* NA 98.6 M No fusion detected
ALL_58 Non-recurrent Non-class NA 89.0 M No fusion detected
ALL_61 Normal Non-class NA 101.8 M No fusion detected
ALL_Validation_20 HeH Non-class NA 19.0 M t(5;15)BRD9/NUTM1
ALL_313 Non-recurrent Multi-class NA 116.7 M No fusion detected
ALL_619 Non-recurrent Multi-class NA 84.3 M t(9;14)PAX5/ESRRB
ALL_403 Non-recurrent Multi-class NA 95.2 M inv(9)PAX5/ZCCHC7
ALL_246 Non-recurrent Multi-class NA 120.5 M t(9;12)PAX5/ETV6
ALL_485 Non-recurrent Multi-class NA 90.6 M t(9;12)PAX5/ETV6
ALL_373 Non-recurrent Multi-class NA 96.2 M del(X)P2RY8/CRLF2
ALL_497 Non-recurrent Multi-class NA 89.7 M No fusion detected
*Patients with DNA methylation patterns similar to those of the recurrent ALL subtypes. a
three were confirmed to have 48–49 chromosomes at diagnosis by chromosomal banding or array-based CNA detection. The chromosomal gains included +14, +17, and + X, which are the typical chromosomal gains ob-served in HeH in addition to +21c. Additional details about the classification of DS-ALL patients can be found in Additional file 2: Table S7.
Annotation of the consensus CpG sites in the ALL subtype classifier
Remarkably, none of the consensus CpG sites in the classifier were located in the genomic regions harboring the subtype-specific cytogenetic aberrations. For ex-ample, none of the consensus CpG sites for the iAMP21 subtype were located on chromosome 21, none of the CpG sites for the t(12;21) subtype were located on chro-mosomes 12 or 21, and none of the CpG sites defining the 11q23/MLL, dic(9;20), and t(1;19) subtypes were on chromosomes 11, 9, 20, 1, or 19, respectively.
Over 90% of the consensus CpG sites for each the BCP ALL subtypes were hypomethylated (medianβ-value 0.19) in the patients belonging to the respective subtypes, while
all other patients were highly methylated. The CpG sites in the T-ALL classifier were hypermethylated in T-ALL patients (medianβ-value 0.92) and hypomethylated in the BCP ALL patients (medianβ-value 0.04). Over 95% of the consensus CpG sites were annotated to protein coding genes, and the majority (87%) of them were located out-side CpG islands (Additional file 2: Table S2). Several of the genes highlighted in our classification procedure are associated with a somatic mutation or differential DNA methylation or gene expression patterns in ALL subtypes such asDDIT4L(4q23) in HeH [14,26],CBFA2T3(16q24), TCFL5(20q13.33), DSC3(18q12.1), and EPOR (19p13.3-p13.2) in t(12;21) [12,14,25-29],MBNL1(3q25) and ZEB2 (2q22.3) in 11q23/MLL [25,30], and NT5C2(10q24.32) andPON2(7q21.3) in t(9;22) [26,27,31,32]. However, most of the genes that we identified with CpG methylation that was characteristic of specific ALL subtypes have no previ-ously known function or connection with ALL.
Discussion
We present a method for the identification of recurrent cytogenetic abnormalities in patients with ALL using
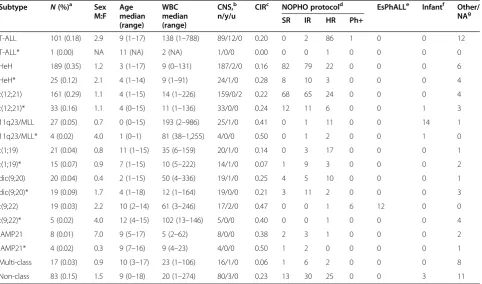
Table 5 Clinical characteristics of ALL patients of known and newly classified subtype
Subtype N(%)a Sex
M:F Age median (range)
WBC median (range)
CNS,b
n/y/u
CIRc NOPHO protocold EsPhALLe Infantf Other/
NAg
SR IR HR Ph+
T-ALL 101 (0.18) 2.9 9 (1–17) 138 (1–788) 89/12/0 0.20 0 2 86 1 0 0 12
T-ALL* 1 (0.00) NA 11 (NA) 2 (NA) 1/0/0 0.00 0 0 1 0 0 0 0
HeH 189 (0.35) 1.2 3 (1–17) 9 (0–131) 187/2/0 0.16 82 79 22 0 0 0 6
HeH* 25 (0.12) 2.1 4 (1–14) 9 (1–91) 24/1/0 0.28 8 10 3 0 0 0 4
t(12;21) 161 (0.29) 1.1 4 (1–15) 14 (1–226) 159/0/2 0.22 68 65 24 0 0 0 4
t(12;21)* 33 (0.16) 1.1 4 (0–15) 11 (1–136) 33/0/0 0.24 12 11 6 0 0 1 3
11q23/MLL 27 (0.05) 0.7 0 (0–15) 193 (2–986) 25/1/0 0.41 0 1 11 0 0 14 1
11q23/MLL* 4 (0.02) 4.0 1 (0–1) 81 (38–1,255) 4/0/0 0.50 0 1 2 0 0 1 0
t(1;19) 21 (0.04) 0.8 11 (1–15) 35 (6–159) 20/1/0 0.14 0 3 17 0 0 0 1
t(1;19)* 15 (0.07) 0.9 7 (1–15) 10 (5–222) 14/1/0 0.07 1 9 3 0 0 0 2
dic(9;20) 20 (0.04) 0.4 2 (1–15) 50 (4–336) 19/1/0 0.25 4 5 10 0 0 0 1
dic(9;20)* 19 (0.09) 1.7 4 (1–18) 12 (1–164) 19/0/0 0.21 3 11 2 0 0 0 3
t(9;22) 19 (0.03) 2.2 10 (2–14) 61 (3–246) 17/2/0 0.47 0 0 1 6 12 0 0
t(9;22)* 5 (0.02) 4.0 12 (4–15) 102 (13–146) 5/0/0 0.40 0 0 1 0 0 0 4
iAMP21 8 (0.01) 7.0 9 (5–17) 5 (2–62) 8/0/0 0.38 2 3 1 0 0 0 2
iAMP21* 4 (0.02) 0.3 9 (7–16) 9 (4–23) 4/0/0 0.50 1 2 0 0 0 0 1
Multi-class 17 (0.03) 0.9 10 (3–17) 23 (1–106) 16/1/0 0.06 1 6 2 0 0 0 8
Non-class 83 (0.15) 1.5 9 (0–18) 20 (1–274) 80/3/0 0.23 13 30 25 0 0 3 11
*Patients with subtype determined by DNA methylation-based classification. a
Proportion of the total number of patients in the known subtype groups (n= 546) and newly classified patients (n= 210). b
Central nervous system involvement. c
Cumulative incidence of relapse (relapse as event of interest and other events as censoring). d
Number of patients treated on NOPHO-ALL treatment protocols. e
Number of patients treated according to the EsPhALL protocol. f
Number of patients treated according to the Interfant-99 or Interfant-06 protocols. g
Number of patients treated on other protocol or information not available.
DNA methylation profiling. Our DNA methylation clas-sifier that consists of only 246 CpG sites is able to accur-ately detect the subtype of primary ALL samples. Nearly 50% of 210 ALL patients in our study that had not previ-ously been assigned to a recurrent subtype group at diagnosis displayed DNA methylation patterns that are similar to those of the eight recurrent subtypes of ALL investigated in the present study. Thus, DNA methyla-tion analysis could complement current cytogentic and molecular biological analyses applied in routine diagno-sis of ALL to allow stratification of a larger number of ALL patients into risk-based treatment groups. Verifica-tion of our DNA methylaVerifica-tion-based analyses suggests that at least 21 out of the 106 patients classified by DNA methylation harbor one of the canonical aberrations that define an ALL subtype, which were not detected at the time of diagnosis. Since our cohort of ALL patients in-cluded samples diagnosed as early as 1996, the fact that the canonical aberrations were not detected at diagnosis could be due to technical limitations of the methods ap-plied at that time.
In contrast to traditional methods used for diagnostics, which require >1 ug of RNA or intact dividing cells, analysis of DNA methylation using the 450 k BeadChip requires only 250 ng of DNA, which is useful for cases where little material is available, especially for biobanked samples. A more targeted diagnostic test than the 450 k BeadChip could be constructed for routine use to analyze the limited number of CpG sites that constitutes the classifier. On the other hand, the use of the 450 k BeadChip could be an advantage as the CpG site content of the classifier might be altered when novel ALL subtypes have been defined.
In our study, we found several new fusion genes in subtype-like patients that involve the same chromosomes and genes as the known fusion genes that define the known subtypes of ALL, which appear to result in the similar DNA methylation patterns. The patients harboring non-canonical gene fusions include ETV6, RUNX1, or PAX5. This observation indicates that alterations that affect either one or both of the gene fusion partners may influence the DNA methylation patterns of the CpG sites in our classifier. The newly identified fusion genes in pa-tients with t(12;21)-like methylation profiles include CBX3/ETV6,andRUNX1/ASXL1, and notably bothCBX3 andASXL1are known to be mutated in ALL and in AML, respectively [31,33]. Furthermore, the patients that we classified into multiple subtype groups display the previ-ously unreported PAX5/ESRRB fusion gene and the
PAX5/ZCCHC7 and PAX5/ETV6 fusions that occur in
approximately 1% of ALLs [19-21]. The high prevalence of PAX5fusions in this group raises the question of whether these patients comprise a biologically and clinically dis-tinct subgroup. We also discovered an unexpected novel
fusion gene involvingBRD9/NUTM1in an infant patient with HeH who did not classify into any subtype group. BRD9 is required for the oncogenic properties of the MLL-fusion proteins [34], which are common in infant ALL patients. A similar fusion gene, BRD4/NUTM1, de-fines a lethal subtype of midline carcinoma [35,36]. These observations warrant further investigation in additional pediatric ALL patients to determine their prognostic or potential therapeutic value.
The translocations resulting in the expression of a fusion protein may modulate DNA methylation patterns via aberrant repression or activation of downstream genes. This hypothesis is supported by the observation that the majority (85%) of CpG sites in the consensus classifier are hypomethylated, by previous reports of aberrant gene expression in the subtype for which they were selected [14,18,25-28], and because the subtype-specific sites are spread out across all autosomes and are not clustered near the physical translocation break-points. One patient (Validation_ALL_39) was positive for t(1;19) with FISH and negative for expression of TCF3/PBX1 due to deletion of the TCF3 gene in the translocation. Consequently, this patient failed to classify as a t(1;19). The alteration of gene expression cascades due to the activity of the fusion proteins may be essen-tial for the DNA hypomethylation pattern in patients with t(1;19) and the other translocations, which presum-ably occur in the early stages of leukemic transformation and are maintained through cellular division and clonal evolution.
The reason behind the striking similarities in DNA methylation in patients with HeH remains a mystery. Be-cause the DNA methylation profiles are so similar in pa-tients harboring various combinations of chromosomal gains, the methylation changes may predate the gains in chromosome number. Yeoh and colleagues reported that most of the genes whose expression patterns define HeH are on chromosomes 21 or X [28]. Although we did not analyze the X chromosome due to its inactivation in females, the consensus CpG sites for HeH were distrib-uted across the different autosomes and only two of the CpG sites were on chromosome 21. One of them was in the CLDN14 gene in the Down's syndrome breakpoint region, and the second CpG site was located in a non-coding RNA gene on 21q22.3. Our results indicate that the HeH-like patients with 47–50 chromosomes are a biological group with similar etiology and clinical out-come as those with >50 chromosomes. As more ALL ge-nomes are sequenced, it will be interesting to see if there are recurrent somatic mutations and/or cryptic genomic rearrangements that provide a unifying cause underlying the HeH subtype.
(7p12.2), ERG(21q22.3), CRLF2(Xp22.3 and Yp11.3), and translocations involving tyrosine kinase genes were not included in the present study [1,2,37]. The prevalence of such aberrations is under investigation in Nordic ALL patients [38,39]. When these data become available, it will be possible to determine if the patients harboring these aberrations form distinct subgroups based on their DNA methylation profiles.
Conclusions
Together with response to induction therapy, genetic aberrations are among the most important prognostic factors in pediatric ALL. Our findings indicate that DNA methylation profiling can contribute to reduction of the heterogeneity in undefined ALL patient groups and can potentially be implemented for diagnostics of ALL and possibly other types of hematological cancers. Follow-up studies of findings where DNA methylation and cytogen-etic aberrations do not agree provide an interesting approach for the discovery of previously unrealized chromosomal aberrations in ALL. Annotation of the CpG sites that constitute the subtype classifier highlights genes that are known to be relevant for ALL, which suggests a functional role for methylation of these sites but also genes with no known function in ALL are highlighted for further studies.
Methods
Clinical diagnostic analysis of ALL samples
Bone marrow aspirates or peripheral blood samples were collected at diagnosis from 756 population-based pediatric ALL patients enrolled between 1996 and 2010 on the Nordic Society of Pediatric Hematology and On-cology (NOPHO), EsPhALL, or Infant treatment proto-cols (Additional file 2: Table S10) [4,40,41]. Diagnoses were established by analysis of leukemic cells with re-spect to morphology, immunophenotype, and cytogenet-ics. HeH was defined as 51–67 chromosomes per cell [42]. FISH or RT-PCR analyses were used to screen for the following translocations: t(12;21)(p13;q22)[ETV6/ RUNX1], t(9;22)(q34;q11)[BCR/ABL1], and t(1;19)(q23; p13.3)[TCF3/PBX1]. FISH or Southern blot analyses were used to identify MLL rearrangements, more than three copies of RUNX1 by FISH define iAMP21, and high resolution SNP arrays and/or FISH were used to detect dic(9;20) aberrations [43,44]. The study was ap-proved by the Regional Ethical Review Board in Uppsala, Sweden and was conducted according to the guidelines of the Declaration of Helsinki. The patients or their guardians provided informed consent.
DNA methylation assay and samples
Genome-wide DNA methylation data for ~450,000 CpG sites was generated as previously described [14]. A total
of 546 out of 756 patients were determined to have estab-lished subtype by chromosome banding and/or positive results from targeted FISH and RT-PCR analyses and were included in the design of the DNA methylation classifier (Table 1, Additional file 2: Table S1). Thirty-nine blinded DNA samples were obtained from newly diagnosed ALL cases as an independent validation set (Additional file 2: Table S3). The reference panel for determining samples with low leukemic blast content consisted of remission bone marrow aspirates from pediatric ALL patients (n= 86) and fractionated blood cells from healthy donors (n= 51) [14].
In total, 210 patients included in the current study did not belong to one of the canonical subtypes according to results from chromosomal banding or targeted assays performed at ALL diagnosis. Patients denoted as ‘ non-recurrent’ harbored non-recurrent aberrations (n= 105, Additional file 2: Table S4). Patients designated as‘normal’ (n= 87) displayed normal karyotypes and were negative in the targeted assays (Additional file 2: Table S5). Patients designated as ‘no result’failed in the cytogenetic analysis (n= 18, Additional file 2: Table S6).
Predictive modeling of ALL subtypes using DNA methylation
Methylation-based classifiers were designed to distin-guish between ten pairs of groups: ALL against reference samples, female against male, and each of the eight subtypes T-ALL, HeH, t(12;21), 11q23/MLL, t(1;19), dic (9;20), t(9;22), and iAMP21 against a background of the other ALL subtypes. The sex classifier was trained on all chromosomes except Y, and the other classifiers were trained on autosomes only. The male-versus-female clas-sifier was implemented to highlight sample mix-ups. The classifiers were created using Nearest Shrunken Centroid (NSC) classification [45]. The NSC modeling procedure consisted of a feature selection step and a training step (Additional file 1: Figure S2). In the feature selection step, fivefold cross-validation was repeated five times. CpG sites selected during the NSC training process in 17/25 cross validation folds were selected as ‘consensus CpG sites’ (Additional file 1: Figure S3). The performance of the consensus classifier was evaluated using external cross-validation (Additional file 1: Figure S2). Additional details on the classification procedure can be found in Additional file 1.
Analysis of copy number alterations
normalized intensity by the mean intensity across the non-leukemic reference cells. CNAs were detected by plotting the log2 ratios in the integrative genomics viewer (IGV) [47].
Analysis of fusion genes
One microgram of total RNA was converted to cDNA using the Superscript III kit (Life Technologies, Carlsbad, CA, USA) and subjected to RT-PCR for the fusion tran-script ETV6/RUNX1 using the probe set ENF301-ENPr341-ENR361 (Life Technologies, Carlsbad, CA, USA). Strand-specific RNA-sequencing libraries were generated from 1μg total RNA with the ScriptSeq v1.2 kits (Epicentre, Madison, WI, USA), followed by sequen-cing on a HiSeq2000/2500 or MiSeq instrument (Illumina Inc., San Diego, CA, USA). Gene fusions were detected using the FusionCatcher software [48]. Details about the fusion gene analysis can be found in Additional file 1.
Availability of supporting data
Methylation data are available at the Gene Expression Omnibus under series GSE49031. The R-code is available at Github (https://github.com/Molmed/Nordlund-ALL-subtyping).
Additional files
Additional file 1:Supplementary methods and supplementary Figures S1–S20.
Additional file 2:Supplementary Tables S1–10.
Abbreviations
5mC:5-Methyl cytosine; ALL: Acute lymphoblastic leukemia; BCP ALL: B-cell precursor ALL; CNA: Copy number alteration; FISH: Fluorescentin situ hybridization; HeH: High hyperdiploidy; iAMP21: Intrachromosomal amplification of chromosome 21; PCR: Polymerase chain reaction; T-ALL: T-cell ALL.
Competing interests
The authors declare that they have no competing interests.
Authors’contributions
JN, CB, MG, GL, EF, and ACS conceived the study. JN, CB, VZ, and JD analyzed data. VZ, IÖ, LC, AN, and GB provided blinded test patients and expertise on clinical diagnostics. LC, EÖ, and JN performed experiments. JA, TF, OGJ, JK, RL, JP, KS, and GL provided clinical material. MH provided information from the NOPHO registry. MG supervised the classifier design. EF provided karyotyping data. JN and ACS wrote the paper. All authors read and approved the final manuscript.
Authors’information
Jonas Abrahamsson, Trond Flaegstad, Mats M Heyman, Ólafur G Jónsson, Jukka Kanerva, Josefine Palle, Kjeld Schmiegelow, Gudmar Lönnerholm and Erik Forestier for the Nordic Society of Pediatric Hematology and Oncology (NOPHO).
Acknowledgements
This work was supported by grants from the Swedish Foundation for Strategic Research (RBc08-008; ACS, GL, MGG), the Eric, Karin, and Gösta Selanders Stiftelse (JN), the Swedish Cancer Society (CAN2010/592; ACS), the Swedish Childhood Cancer Foundation (11098; ACS), the Swedish Research Council for Science and Technology (90559401; ACS), and joint funding from
the Swedish Research Councils FORTE, FORMAS, VINNOVA, and VR (259-2012-23; ACS) for epigenetics. Epigenotyping and RNA-sequencing were performed at the SNP&SEQ Technology Platform in Uppsala, Sweden. Computational analysis was performed using resources provided by SNIC through the Uppsala Multidisciplinary Center for Advanced Computational Science. We thank Anna-Karin Lannergård, Christina Leek, Lili Milani, and Anders Lundmark for technical assistance. We especially thank our colleagues from NOPHO and the ALL patients who contributed samples to this study. This study was approved by the NOPHO Scientific Committee as study number 56.
Author details 1
Department of Medical Sciences, Molecular Medicine and Science for Life Laboratory, Uppsala University, Box 1432, BMC, SE-751 44 Uppsala, Sweden. 2
Department of Medical Sciences, Cancer Pharmacology and Computational Medicine, Uppsala University, Uppsala University Hospital, Entrance 40SE-751 85 Uppsala, Sweden.3Department of Molecular Medicine and Surgery, Karolinska Institutet, SE-171 76 Stockholm, Sweden.4Department of Immunology, Genetics and Pathology, Uppsala University,
Rudbecklaboratoriet, SE-751 85 Uppsala, Sweden.5Department of Pediatrics, Queen Silvia Children’s Hospital, Rondvägen 10SE-416 85 Gothenburg, Sweden.6Department of Pediatrics, Tromsø University and University Hospital, Sykehusveien 38N-9038 Tromsø, Norway.7Childhood Cancer Research Unit, Karolinska Institutet, Astrid Lindgren Children’s Hospital, Karolinska University Hospital, Q6:05, SE-171 76, Stockholm, Sweden. 8Pediatric Hematology-Oncology, Children’s Hospital, Barnaspitali Hringsins,
Landspitali University Hospital, Norðurmýri, 101, Reykjavik, Iceland.9Division of Hematology-Oncology and Stem Cell Transplantation, Children’s Hospital, Helsinki University Central Hospital and University of Helsinki, Box 281FIN-00029 Helsinki, Finland.10Department of Women’s and Children’s Health, Pediatric Oncology, Uppsala University, Uppsala University Hospital, Entrance 95SE-751 85 Uppsala, Sweden.11Pediatrics and Adolescent Medicine, Rigshospitalet, and the Medical Faculty, Institute of Clinical Medicine, University of Copenhagen, Blegdamsvej 9DK-2100 Copenhagen, Denmark.12Department of Medical Biosciences, University of Umeå, SE-901 85 Umeå, Sweden.
Received: 26 September 2014 Accepted: 18 December 2014
References
1. Inaba H, Greaves M, Mullighan CG. Acute lymphoblastic leukaemia. Lancet. 2013;381:1943–55.
2. Harrison CJ. Targeting signaling pathways in acute lymphoblastic leukemia: new insights. Hematology Am Soc Hematol Educ Program. 2013;2013:118–25. 3. Dario Campana M, Pui C-H. Diagnosis and treatment of childhood acute
lymphoblastic leukemia. In: Neoplastic diseases of the blood. New York: Springer; 2013. p. 305–29.
4. Schmiegelow K, Forestier E, Hellebostad M, Heyman M, Kristinsson J, Soderhall S, et al. Long-term results of NOPHO ALL-92 and ALL-2000 studies of childhood acute lymphoblastic leukemia. Leukemia. 2010;24:345–54. 5. Pui CH, Carroll WL, Meshinchi S, Arceci RJ. Biology, risk stratification, and
therapy of pediatric acute leukemias: an update. J Clin Oncol. 2011;29:551–65. 6. Olde Nordkamp L, Mellink C, van der Schoot E, van den Berg H.
Karyotyping, FISH, and PCR in acute lymphoblastic leukemia: competing or complementary diagnostics? J Pediatr Hematol Oncol. 2009;31:930–5. 7. Easwaran H, Tsai HC, Baylin SB. Cancer epigenetics: tumor heterogeneity,
plasticity of stem-like states, and drug resistance. Mol Cell. 2014;54:716–27. 8. Deaton AM, Bird A. CpG islands and the regulation of transcription. Genes
Dev. 2011;25:1010–22.
9. Nordlund J, Milani L, Lundmark A, Lonnerholm G, Syvanen AC. DNA methylation analysis of bone marrow cells at diagnosis of acute lymphoblastic leukemia and at remission. PLoS One. 2012;7:e34513. 10. Martin-Subero JI, Ammerpohl O, Bibikova M, Wickham-Garcia E, Agirre X,
Alvarez S, et al. A comprehensive microarray-based DNA methylation study of 367 hematological neoplasms. PLoS One. 2009;4:e6986.
11. Chatterton Z, Morenos L, Mechinaud F, Ashley DM, Craig JM, Sexton-Oates A, et al. Epigenetic deregulation in pediatric acute lymphoblastic leukemia. Epigenetics. 2014;9:459–67.
outcome in patients with childhood acute lymphoblastic leukemia. Blood. 2010;115:1214–25.
13. You JS, Jones PA. Cancer genetics and epigenetics: two sides of the same coin? Cancer Cell. 2012;22:9–20.
14. Nordlund J, Backlin CL, Wahlberg P, Busche S, Berglund EC, Eloranta ML, et al. Genome-wide signatures of differential DNA methylation in pediatric acute lymphoblastic leukemia. Genome Biol. 2013;14:r105.
15. Figueroa ME, Chen SC, Andersson AK, Phillips LA, Li Y, Sotzen J, et al. Integrated genetic and epigenetic analysis of childhood acute lymphoblastic leukemia. J Clin Invest. 2013;123:3099–111.
16. Davidsson J, Lilljebjorn H, Andersson A, Veerla S, Heldrup J, Behrendtz M, et al. The DNA methylome of pediatric acute lymphoblastic leukemia. Hum Mol Genet. 2009;18:4054–65.
17. Rodriguez-Paredes M, Esteller M. Cancer epigenetics reaches mainstream oncology. Nat Med. 2011;17:330–9.
18. Busche S, Ge B, Vidal R, Spinella JF, Saillour V, Richer C, et al. Integration of high-resolution methylome and transcriptome analyses to dissect epigenomic changes in childhood acute lymphoblastic leukemia. Cancer Res. 2013;73:4323–36.
19. Sarhadi VK, Lahti L, Scheinin I, Tyybakinoja A, Savola S, Usvasalo A, et al. Targeted resequencing of 9p in acute lymphoblastic leukemia yields concordant results with array CGH and reveals novel genomic alterations. Genomics. 2013;102:182–8.
20. Strehl S, Konig M, Dworzak MN, Kalwak K, Haas OA. PAX5/ETV6 fusion defines cytogenetic entity dic(9;12)(p13;p13). Leukemia. 2003;17:1121–3. 21. Roberts KG, Morin RD, Zhang J, Hirst M, Zhao Y, Su X, et al. Genetic
alterations activating kinase and cytokine receptor signaling in high-risk acute lymphoblastic leukemia. Cancer Cell. 2012;22:153–66.
22. Xu XJ, Johnson EB, Leverton L, Arthur A, Watson Q, Chang FL, et al. The advantage of using SNP array in clinical testing for hematological malignancies-a comparative study of three genetic testing methods. Cancer Genet. 2013;206:317–26.
23. Kwee I, Rinaldi A, Rancoita P, Rossi D, Capello D, Forconi F, et al. Integrated DNA copy number and methylation profiling of lymphoid neoplasms using a single array. Br J Haematol. 2012;156:354–7.
24. Feber A, Guilhamon P, Lechner M, Fenton T, Wilson GA, Thirlwell C, et al. Using high-density DNA methylation arrays to profile copy number alterations. Genome Biol. 2014;15:R30.
25. Den Boer ML, van Slegtenhorst M, De Menezes RX, Cheok MH, Buijs-Gladdines JG, Peters ST, et al. A subtype of childhood acute lymphoblastic leukaemia with poor treatment outcome: a genome-wide classification study. Lancet Oncol. 2009;10:125–34.
26. Nordlund J, Kiialainen A, Karlberg O, Berglund EC, Goransson-Kultima H, Sonderkaer M, et al. Digital gene expression profiling of primary acute lymphoblastic leukemia cells. Leukemia. 2012;26:1218–27.
27. Ross ME, Zhou X, Song G, Shurtleff SA, Girtman K, Williams WK, et al. Classification of pediatric acute lymphoblastic leukemia by gene expression profiling. Blood. 2003;102:2951–9.
28. Yeoh EJ, Ross ME, Shurtleff SA, Williams WK, Patel D, Mahfouz R, et al. Classification, subtype discovery, and prediction of outcome in pediatric acute lymphoblastic leukemia by gene expression profiling. Cancer Cell. 2002;1:133–43.
29. Gandemer V, Rio AG, de Tayrac M, Sibut V, Mottier S, Ly Sunnaram B, et al. Five distinct biological processes and 14 differentially expressed genes characterize TEL/AML1-positive leukemia. BMC Genomics. 2007;8:385. 30. Caudell D, Harper DP, Novak RL, Pierce RM, Slape C, Wolff L, et al. Retroviral
insertional mutagenesis identifies Zeb2 activation as a novel leukemogenic collaborating event in CALM-AF10 transgenic mice. Blood. 2010;115:1194–203. 31. Meyer JA, Wang JH, Hogan LE, Yang JJ, Dandekar S, Patel JP, et al. Relapse-specific mutations in NT5C2 in childhood acute lymphoblastic leukemia. Nat Genet. 2013;45:290–4.
32. Tzoneva G, Perez-Garcia A, Carpenter Z, Khiabanian H, Tosello V, Allegretta M, et al. Activating mutations in the NT5C2 nucleotidase gene drive chemotherapy resistance in relapsed ALL. Nat Med. 2013;19:368–71. 33. Liang DC, Liu HC, Yang CP, Jaing TH, Hung IJ, Yeh TC, et al. Cooperating
gene mutations in childhood acute myeloid leukemia with special reference on mutations of ASXL1, TET2, IDH1, IDH2, and DNMT3A. Blood.
2013;121:2988–95.
34. Collins EC, Rabbitts TH. The promiscuous MLL gene links chromosomal translocations to cellular differentiation and tumour tropism. Trends Mol Med. 2002;8:436–42.
35. French CA, Kutok JL, Faquin WC, Toretsky JA, Antonescu CR, Griffin CA, et al. Midline carcinoma of children and young adults with NUT rearrangement. J Clin Oncol. 2004;22:4135–9.
36. French CA, Miyoshi I, Kubonishi I, Grier HE, Perez-Atayde AR, Fletcher JA. BRD4-NUT fusion oncogene: a novel mechanism in aggressive carcinoma. Cancer Res. 2003;63:304–7.
37. Roberts KG, Li Y, Payne-Turner D, Harvey RC, Yang YL, Pei D, et al. Targetable kinase-activating lesions in Ph-like acute lymphoblastic leukemia. N Engl J Med. 2014;371:1005–15.
38. Ofverholm I, Tran AN, Heyman M, Zachariadis V, Nordenskjold M, Nordgren A, et al. Impact of IKZF1 deletions and PAX5 amplifications in pediatric B-cell precursor ALL treated according to NOPHO protocols. Leukemia. 2013;27:1936–9.
39. Olsson L, Castor A, Behrendtz M, Biloglav A, Forestier E, Paulsson K, et al. Deletions of IKZF1 and SPRED1 are associated with poor prognosis in a population-based series of pediatric B-cell precursor acute lymphoblastic leukemia diagnosed between 1992 and 2011. Leukemia. 2013;28:302–10. 40. Pieters R, Schrappe M, De Lorenzo P, Hann I, De Rossi G, Felice M, et al. A
treatment protocol for infants younger than 1 year with acute lymphoblastic leukaemia (Interfant-99): an observational study and a multicentre randomised trial. Lancet. 2007;370:240–50.
41. Biondi A, Schrappe M, De Lorenzo P, Castor A, Lucchini G, Gandemer V, et al. Imatinib after induction for treatment of children and adolescents with Philadelphia-chromosome-positive acute lymphoblastic leukaemia (EsPhALL): a randomised, open-label, intergroup study. Lancet Oncol. 2012;13:936–45.
42. Paulsson K, Johansson B. High hyperdiploid childhood acute lymphoblastic leukemia. Genes Chromosomes Cancer. 2009;48:637–60.
43. Zachariadis V, Gauffin F, Kuchinskaya E, Heyman M, Schoumans J, Blennow E, et al. The frequency and prognostic impact of dic(9;20)(p13.2;q11.2) in childhood B-cell precursor acute lymphoblastic leukemia: results from the NOPHO ALL-2000 trial. Leukemia. 2011;25:622–8.
44. Zachariadis V, Schoumans J, Ofverholm I, Barbany G, Halvardsson E, Forestier E, et al. Detecting dic(9;20)(p13.2;p11.2)-positive B-cell precursor acute lymphoblastic leukemia in a clinical setting using fluorescence in situ hybridization. Leukemia. 2013;28:196–8.
45. Tibshirani R, Hastie T, Narasimhan B, Chu G. Diagnosis of multiple cancer types by shrunken centroids of gene expression. Proc Natl Acad Sci U S A. 2002;99:6567–72.
46. Bolstad BM, Irizarry RA, Astrand M, Speed TP. A comparison of normalization methods for high density oligonucleotide array data based on variance and bias. Bioinformatics. 2003;19:185–93.
47. Thorvaldsdottir H, Robinson JT, Mesirov JP. Integrative Genomics Viewer (IGV): high-performance genomics data visualization and exploration. Brief Bioinform. 2013;14:178–92.
48. Nicorici D, Satalan M, Edgren H, Kangaspeska S, Murumagi A, Kallioniemi O, et al. FusionCatcher—a tool for finding somatic fusion genes in paired-end RNA-sequencing data. bioRxiv. 2014. http://dx.doi.org/10.1101/011650.
Submit your next manuscript to BioMed Central and take full advantage of:
• Convenient online submission
• Thorough peer review
• No space constraints or color figure charges
• Immediate publication on acceptance
• Inclusion in PubMed, CAS, Scopus and Google Scholar
• Research which is freely available for redistribution