R E S E A R C H
Open Access
Genetic effect of interleukin-1 beta (C-511T)
polymorphism on the structural covariance
network and white matter integrity in
Alzheimer
’
s disease
Chi-Wei Huang
1†, Shih-Wei Hsu
2†, Shih-Jen Tsai
3,4, Nai-Ching Chen
1, Mu-En Liu
3, Chen-Chang Lee
2,
Shu-Hua Huang
5, Weng-Neng Chang
1, Ya-Ting Chang
1, Wan-Chen Tsai
1and Chiung-Chih Chang
1*Abstract
Background:Inflammatory processes play a pivotal role in the degenerative process of Alzheimer’s disease. In humans, a biallelic (C/T) polymorphism in the promoter region (position-511) (rs16944) of the interleukin-1 beta gene has been significantly associated with differences in the secretory capacity of interleukin-1 beta. In this study, we investigated whether this functional polymorphism mediates the brain networks in patients with Alzheimer’s disease.
Methods:We enrolled a total of 135 patients with Alzheimer’s disease (65 males, 70 females), and investigated their gray matter structural covariance networks using 3D T1 magnetic resonance imaging and their white matter macro-structural integrities using fractional anisotropy. The patients were classified into two genotype groups: C-carriers (n= 108) and TT-carriers (n= 27), and the structural covariance networks were constructed using seed-based analysis focusing on the default mode network medial temporal or dorsal medial subsystem, salience network and executive control network. Neurobehavioral scores were used as the major outcome factors for clinical correlations.
Results: There were no differences between the two genotype groups in the cognitive test scores, seed, or peak cluster volumes and white matter fractional anisotropy. The covariance strength showing C-carriers > TT-carriers was the entorhinal-cingulum axis. There were two peak clusters (Brodmann 6 and 10) in the salience network and four peak clusters (superior prefrontal, precentral, fusiform, and temporal) in the executive control network that showed C-carriers < TT-carriers in covariance strength. The salience network and executive control network peak clusters in the TT group and the default mode network peak clusters in the C-carriers strongly predicted the cognitive test scores.
Conclusions: Interleukin-1 beta C-511 T polymorphism modulates the structural covariance strength on the anterior brain network and entorhinal-interconnected network which were independent of the white matter tract integrity. Depending on the specific C-511 T genotype, different network clusters could predict the cognitive tests.
Keywords: Alzheimer’s disease, Anatomical structural covariance, Interleukin-1 beta polymorphism, Salience network, Executive control network
* Correspondence:[email protected]
†Equal contributors
1Department of Neurology, Cognition and Aging Center, Kaohsiung Chang
Gung Memorial Hospital, Chang Gung University College of Medicine, #123, Ta-Pei Road, Niaosung, Kaohsiung County 833, Taiwan
Full list of author information is available at the end of the article
Background
The neuropathology of Alzheimer’s disease (AD) in-volves a profound innate immune response and produc-tion of inflammatory cytokines [1]. Whether or not inflammatory processes represent a causal component of AD or are simply a consequence of neurodegeneration is still under debate. However, it is generally accepted that inflammatory cascades [2] together with neurofibrillary tangles [3] and degenerative neuroimaging biomarkers [4] are more strongly associated with cognitive declines in patients with AD. Many inflammatory mediators have been identified in the brains of patients with AD. Variations in inflammatory-related genes have been ex-tensively investigated [5–8], and the expression of interleukin-1 (IL-1) beta has been shown to have clinical relevance. IL-1 beta, produced in the glial cells and neu-rons, has been reported to have a higher density in the hippocampus in response to stress of injury [9]. In addition, in an Alzheimer’s mouse model, IL-1 beta-related inflammatory responses surprisingly reduced amyloid beta deposition [10] but paradoxically enhanced tau pathology [11].
A large number of functional polymorphisms in the promoter regions of pro- and anti-inflammatory genes have been associated with different levels of mediators that have an overall effect on the strength of inflamma-tory responses [12]. The human interleukin-1 beta gene (IL1B) is located on chromosome 2q14. A biallelic (C/T) polymorphism in the promoter region (position-511) (rs16944) of the IL-1 beta gene has been significantly associated with IL-1 beta secretory capacity after lipopolysaccharide-stimulation that T homozygous indi-viduals secreted significantly more IL-1 beta than CC and CT individuals [13]. In Taiwan, the−511 TT geno-type has also been associated with an increased risk of AD [14]. The substantial increase in the expression of the IL-1 beta gene during long-term potentiation of syn-aptic transmission suggests its role in synsyn-aptic function [15]; however, blocking of IL-1 beta in the hippocampus has been reported to produce significant memory im-pairment compared with vehicle-treated rats [16].
Both deep and periventricular white matter hyperin-tensities (WMHs) have been reported to be significantly associated with AD degeneration process in both cross-sectional and longitudinal studies [17–19]. The presence of WMHs in AD may reflect multiple physiological and pathological changes such as breakdown of the blood-brain barrier [20], impaired cerebral auto-regulation [21], vasculopathies, and inflammation [22, 23]. In healthy adults, homozygotes for the IL-1 beta -511 T al-lele have been associated with increased inflammatory responses and larger WMHs than the other two geno-typic combinations [24]. The -511 T homozygotes are also associated with a higher risk of ischemic stroke,
suggesting a role in large [25] or small vessel pathology [26]. These observations make the IL-1 beta C-511 T genetic variant a plausible candidate to evaluate the gen-etic effect on WMH proliferation. Data on the C-511 T with regards to WMH load and gray matter (GM) de-generation in AD are still lacking.
The application of structural covariance networks (SCNs) has been supported by recent research in that highly related regions may show covariance in morpho-metric characteristics. SCN patterns have been shown to be associated with structural or functional connectivity while the structural covariance strength often reflects how close two interconnected hubs interact [27]. Mean-while, biological factors such as genetic variations, devel-opmental, degenerative processes or the WMH loads [24] have been shown to modulate the patterns of SCNs [27]. Three SCNs have been reported to be relevant to AD, the so called default mode network (DMN) [28–30], salience network (SN) [31], and executive control net-work (ECN) [32, 33]. A recent report suggested that the DMN may be comprised of multiple, spatially dissoci-ated but interactive components, of which two subsys-tems are particularly relevant: the“medial temporal lobe subsystem”, and the “dorsal medial prefrontal cortex subsystem”(or the midline core subsystem) [34].
An association between the IL-1 beta -511 T allele and AD has been reported [14], however the mechanism by which IL-1 beta functional polymorphisms affect the brain networks in patients with AD has yet to be ex-plored. Recent neuroscience studies have supported that cognitive function is highly reflective of the architecture of the neuronal network scaffold [35]. As the potential mechanisms of genetic-based neurobiology are still under investigation [36–39], the exploration of IL-1 beta functional polymorphism may address how genetic vari-ations may affect the organization of the GM and white matter (WM) integrities. The neuroimaging biomarkers of SCN and WMH spatial distribution can be used to test the influence of the genotype groups with regards to inflammatory processes on disease-related degeneration. In this study, we hypothesized that the IL-1 beta C-511 T functional polymorphism may modulate large-scale structural covariance patterns and WMHs in pa-tients with AD, and that these alterations may conse-quently determine neurobehavioral performance.
Methods
International Working Group criteria [40], with a clin-ical diagnosis of typclin-ical AD encompassing both pro-dromal and dementia phases. Amnestic syndrome of the hippocampal type was characterized by a low free recall that was not normalized by cueing [41]. All of the pa-tients had a clinical dementia rating scores ranges from 0.5 to 2, and all of the patients were in a stable condition under treatment with acetylcholine esterase inhibitors from the time of diagnosis. The exclusion criteria were a past history of clinical stroke, a modified Hachinski is-chemic score >4 [42] and depression.
Study working scheme
Based on the study rationale, the patients were classified into two genotype groups based on the functional poly-morphism: C carrier (CC + CT,n= 108), and TT homo-zygotes (n= 27). The working scheme was as follows. First, four SCN were established by seed-based correl-ation analysis. Differences in each seed regional volume and SCN peak cluster volume were compared between the two genotype groups. Meanwhile, neuroimaging bio-markers used to assess the micro-structural of the WM integrities were derived from the diffusion tensor im-aging, compared between groups and correlated with cognitive test scores. Finally, to evaluate the genetic effects on SCN clusters, the covariance strength showing significant genotype interactions (i.e., T ho-mozygotes > C-carriers or T hoho-mozygotes < C-carriers) were modeled. The volumes of the peak clusters showing genotype effect was correlated with cognitive test scores to evaluate the clinical significance.
Clinical and neurobehavioral assessments
After enrolment, demographic data of each patient were recorded. A trained neuro-psychologist administered the neurobehavior tests. The Mini-Mental State Examination (MMSE) [43] and the Cognitive Abilities Screening Instrument (CASI) [44] total scores were used as a glo-bal assessment of cognitive function. Attention, verglo-bal fluency, abstract thinking, and mental manipulation sub-domain scores of the CASI were used to assess executive function test (EFT) [22], while the non-executive do-mains included orientation, short- and long-term mem-ory, language ability, and drawing.
Genotyping
Genomic DNA was extracted from blood samples using a commercial kit (Qiagen, Gentra Puregene Blood Kit), followed by genotyping for C-511 T polymorphisms of the IL-1 beta gene using the polymerase chain reaction (PCR)-restriction fragment length polymorphism method [45]. Genotyping was conducted with the operator blinded to the clinical data. The apolipoprotein E genotype was also determined using a PCR-restriction fragment length
polymorphism assay and restriction enzyme HhaI [46]. Apolipoprotein E4 carriers were defined as those with one or two E4 alleles [23].
Cerebrovascular risk confounders
Factors such as oxidative stress, deregulated metabolic factors and an elevated blood sugar level are related to greater WMHs loads in AD [23]. Therefore, the follow-ing risk confounders were included for comparisons: age, high sensitive C-reactive protein, homocysteine, total cholesterol, triglyceride, high-density lipoprotein, low-density lipoprotein, creatinine, vitamin B12, folate, and hemoglobin-A1C [47].
Image acquisition
MR images were acquired using a 3.0 T MRI scanner (Excite, GE Medical Systems, Milwaukee, WI, USA). Structural images were acquired for SCN constructions using the following protocols: a T1-weighted, inversion-recovery-prepared, three-dimensional, gradient-recalled acquisition in a steady-state sequence with a repetition time/echo time/inversion time of 8600 ms/minimal/ 450 ms, a 256 × 256 mm field of view, and a 1-mm slice sagittal thickness with a resolution of 0.5 × 0.5 × 1 mm3.
The diffusion-tensor imaging was acquired using the following parameters: repetition time/echo time/flip angle = 9600 ms/62.7 ms/90°, a 192 × 192 mm field of view, a 128 × 128 matrix and a 4-mm axial slice thick-ness. For whole brain coverage, 40 contiguous axial slices were obtained. The diffusion-weighting gradients were applied in 61 non-collinear directions, optimised by the static electron-repulsion model. Thebvalue used was 1000 s/mm2. One reference image was acquired using the same imaging parameters but without diffu-sion weighting.
Data analysis for neuroimaging biomarkers SCN analysis
Image preprocessing and statistical analysis were per-formed using SPM8 (SPM8, Wellcome Trust Centre of Cognitive Neurology, University College London, UK, http://www.fil.ion.ucl.ac.uk/spm/). The T1 images were reoriented, realigned, and normalized using the standard Montreal Neurological Institute (MNI) space. The im-ages were then segmented into GM and WM. Related tissue segments were used to create a custom template using the diffeomorphic anatomical registration using exponentiated lie algebra (DARTEL) approach that rep-resented one of the highest ranking registration methods in patients with AD [48]. The modulated and warped images were then smoothed using a Gaussian kernel of 8 mm full width at half maximum.
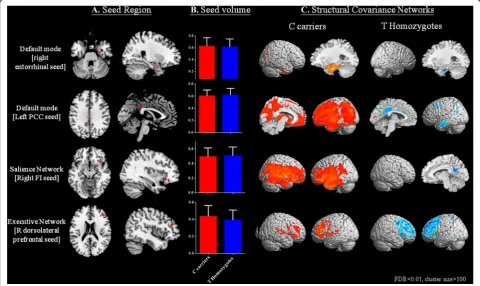
preprocessed images. These following seed ROIs that anchor the DMN medial temporal subsystem (right en-torhinal cortex [coordinates: 25,-9,-28]) [49], DMN mid-line core subsystem (left posterior cingulate cortex [PCC; coordinates: −2,-36, 35]) [50, 51], SN (right fron-toinsular cortex [coordinates: 38, 26,-10]), and ECN (right dorsolateral prefrontal cortex [coordinates: 44, 36, 20]) [31] were selected (Fig. 1a). The laterality was based on the original report of the seeds. As the pathology or functional connectivity in typical patients with AD is distributed symmetrically, we did not perform a contra-lateral seed analysis in this study.
From the modified GM images, the GM volumes of a 4-mm radius sphere around the seed ROI coordi-nates were also calculated, followed by four separate correlation analyses using the extracted GM volumes as the covariates of interest. The two genotype groups were modeled separately. For each genotype group, specific contrasts were set to identify voxels that showed positive correlations for each seed ROI, forming the SCN. The results reflected the SCNs of each ROI and the threshold was set at p< 0.01, cor-rected for false discovery rate (FDR) with a cluster size >100 voxels.
In addition, to investigate how genetic variance may interfere with SCN clusters, voxels showing significant differences in the regression slopes in each seed-peak cluster correlations were compared, pointing to possible interactions between TT > C-carrier or TT < C-carrier based on the dosage-related IL-1 beta protein expression [13]. Specific t contrasts were established to map the voxels that expressed significant between-group associa-tions. The threshold for the resulting statistical paramet-ric maps was set at p< 0.001 (uncorrected) with a cluster size >100 voxels. For the peak clusters showing significant between-group differences, a 4-mm radius sphere was placed on the peak voxel, and the GM vol-umes were calculated for regression analysis. To evaluate the clinical significance of the seed or identified peak voxel, we used a linear regression model with the cogni-tive test scores serving as the dependent variable. The threshold was set atp< 0.05 with multiple corrections.
WM analysis
The fractional anisotropy (FA) maps were obtained using the functional MRI of the brain software library (FSL) version 4.0.1 package (http://www.fmrib.ox.ac.uk). A dir-ect comparison of two genotype groups of the diffusion
indices used permutation-based, non-parametric infer-ence for the cluster size [52] and Randomise 2.0 software. A restrictive statistical threshold was used (the threshold-free, cluster-enhancement threshold with p <0.05, cor-rected for multiple comparisons). To provide the between-group quantitative analysis, the WM parcellation algorithm [53] and calculation of 11 major bundles were performed. The FA from the each association bundle was extracted for group-interaction analysis or correlations with neurobehavior scores.
Statistical analysis
Clinical and laboratory data were expressed as mean ± standard deviation. The student’sttest was used to com-pare levels of cerebrovascular risk biomarkers or continu-ous variables of the C-carriers and T homozygotes. All statistical analyses were conducted using SPSS software (SPSS version 13 for Windows®, SPSS Inc., Chicago, IL). Pearson correlation adjusted for possible confounders were perfomed to assess the associations between continuous variables. Statistical significance was set atp< 0.05.
Results
Demographic data, cognitive data, and NPI
The genotype distribution was in Hardy-Weinberg equi-librium (χ2= 0.28, p= 0.6) and the demographic charac-teristics, neuropsychiatric test or cerebrovascular risk biomarker results of the two genotype groups are shown in Table 1. The clinical dementia rating scores and type groups distributions were not significant (E4 geno-type,χ2= 0.971,p= 0.262; IL-1 beta genotype,χ2= 2.682,
p= 0.615).
Patterns of SCN and genetic variants
A direct comparison between the GM volume of C-carriers or T homozygotes using voxel-based morphom-etry [54] showed no significant volumetric differences (with the threshold set at p< 0.05, corrected for a FDR with a cluster size >100 voxels).
According to the genotype classification (C-carriers and TT-carriers) and four seeds (Fig. 1a), there were no signifi-cant differences in the GM volumes of each seed (Fig. 1b). The SCN patterns and clusters for each genotype are shown in Fig. 1c and Additional file 1: Table S1–S8.
Relationships between seed region volumes and cognitive scores
We first explored whether each seed region volume was correlated with the cognitive test scores in each group, adjusted for years of education (Table 2). The posterior cingulate, frontoinsular seed volume correlated variably with cognitive test scores in both genotypes, while the dorsolateral prefrontal seed showed significance only in the TT group.
Peak clusters showing significant interactions between genotype groups
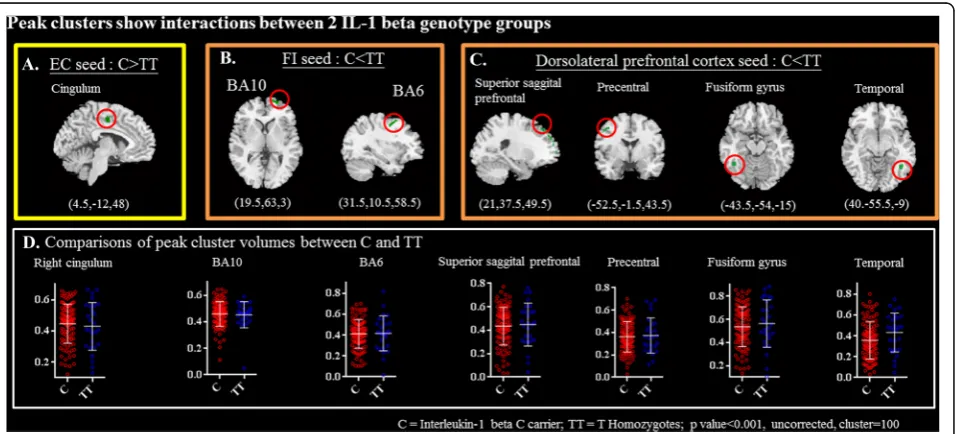
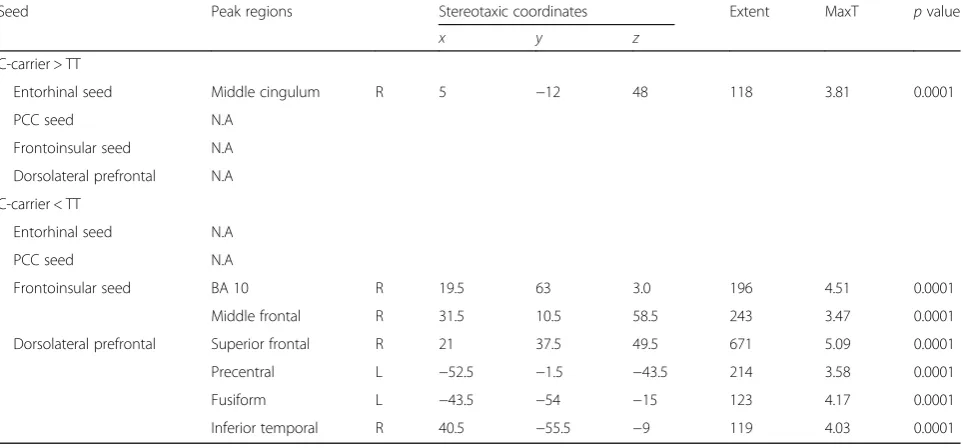
For each seed, we further explored the genotypic inter-actions with regards to the topography showing differ-ences in structural covariance strength between seed and peak clusters (Fig. 2; Table 3).
The middle cingulum that anchored to the entorhinal seed was the only significant cluster showing C-carriers > TT in covariance strength (Fig. 2a). In
Table 1Demographical characteristics and neuropsychiatric tests in the interleukin-1 beta C-carrier and TT-carriers in 135 cases
Group C-carrier
(n= 108)
TT-carriers (n= 27) p
value
Age 71.7(14.2) 72.6(7.4) 0.77
Education (year) 6.9(4.7) 9.3(4.8) 0.02
Apolipoprotein E4 carrier (positive case, %)
42.6% 48.1% 0.67
Sex (male/female) 56/52 14/13 1
Mini-Mental State Examination 20.2(6.2) 20.6(7.7) 0.82
CASI total scores 67.8(20.2) 68.3(25.1) 0.89
CASI executive function test scores 25.3(7.9) 25.2(10.1) 0.97
CASI subdomains
Short term memory 5.5(3.8) 5.4(3.8) 0.90
Orientation 12.8(5.1) 12.9(6.0) 0.88
Long term memory 8.3(2.4) 8.4(2.7) 0.90
Language 8.2(2.1) 8.1(2.8) 0.83
Drawing 7.8(2.8) 8.4(2.6) 0.37
Attention 6.3(1.4) 6.3(1.6) 0.98
Verbal fluency 5.2(2.5) 5.3(3.7) 0.86
Abstract thinking 8.2(2.8) 7.9(3.2) 0.64
Mental manipulation 5.6(3.2) 5.7(3.4) 0.92
Cerebrovascular risk biomarkers
High sensitive C reactive protein (mg/L)
2.8(4.9) 2.4(5.2) 0.68
Homocysteine (umol/L) 12.9(4.3) 11.5(4.7) 0.14
Hemoglobin-A1C (%) 6.1(1.0) 6.2(1.7) 0.74
Creatinine (mg/dl) 0.9(0.4) 0.9(0.2) 0.52
High-density lipoprotein (mg/dl) 57.1(17.0) 61.0(16.6) 0.29
Low-density lipoprotein (mg/dl) 106.2(38.1) 97.4(28.6) 0.27
Total cholesterol (mg/dl) 188.5(40.8) 180.6(36.0) 0.36
Triglyceride (mg/dl) 120.7(62.0) 110.7(55.0) 0.44
Vitamin B12 (pg/dl) 589.1 (315.7) 687.2(428.1) 0.19
Folate (ng/dl) 12.0(5.6) 12.8(5.4) 0.52
Data are presented as mean (standard deviation) or number (percentage (%)) Attention, verbal fluency, abstract thinking, and mental manipulation sub-domain scores of the CASI were added to assess executive function
APOE4 carriers were defined as the presence of one or two APOE4 alleles
contrast, there were two clusters that anchored to the right frontoinsular seed (Fig. 2b) and four clusters that anchored to the right dorsolateral prefrontal cortex seed (Fig. 2c) showing TT > C-carriers in covariance strength. Meanwhile, direct comparisons of the peak clusters vol-ume between two genotype groups showed no signifi-cant differences (Fig. 2d).
Clinical significance of peak clusters showing genotype differences
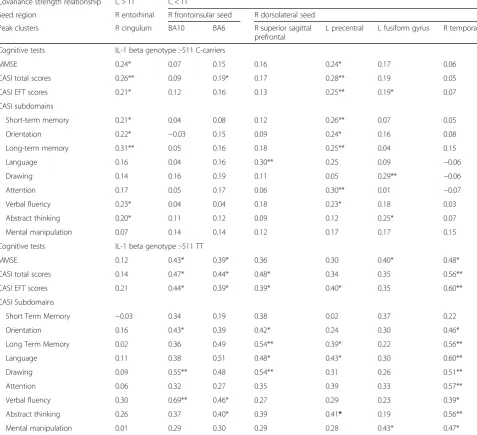
The clinical significance of the aforementioned seven peak clusters showing genotype interactions was evalu-ated by partial correlation analysis with cognitive tests (Table 4). For right cingulum volume, the correlation analysis with cognitive test scores showed significance
Table 2Correlation matrix between cognitive test scores with seed volume
Seed region R entorhinal L posterior cingulate R frontoinsular R dorsolateral prefrontal
MNI coordinates (25,-9,-28) (−2,-36, 35) (38, 26,-10) (44, 36, 20)
IL-1 beta genotypes C-carrier TT C-carrier TT C-carrier TT C-carrier TT
MMSE 0.189 −0.122 0.324** 0.451* 0.355** 0.464* −0.039 0.489*
CASI total scores 0.140 −0.105 0.314** 0.391* 0.286** 0.393* −0.027 0.530**
CASI EFT scores 0.109 −0.158 0.294** 0.344 0.219* 0.407* 0.000 0.510**
CASI Subdomains
Short Term Memory 0.085 −0.012 0.308** 0.275 0.335** 0.475* 0.064 0.401*
Orientation 0.136 −0.133 0.308** 0.376 0.342** 0.362 −0.044 0.457*
Long Term Memory 0.188 0.074 0.172 0.351 0.148 0.131 −0.041 0.485*
Language 0.155 −0.101 0.290** 0.394* 0.235** 0.255 −0.057 0.484*
Drawing 0.045 −0.040 0.058 0.389* 0.054 0.281 −0.078 0.472*
Attention −0.013 −0.174 0.200 0.376 0.246** 0.421* 0.077 0.511
Verbal fluency 0.083 0.050 0.272** 0.406* 0.186 0.455* −0.001 0.349
Abstract thinking 0.288** −0.298 0.174 0.291 0.200** 0.141 0.030 0.478*
Mental manipulation −0.018 −0.028 0.285** 0.159 0.074 0.424* −0.091 0.367
Numbers indicate Pearson correlation coefficients,*p
< 0.05; **p< 0.01
MMSEMini-Mental State Examination,EFTexecutive function test,Rright,Lleft,IL-1interleukin-1,CASICognitive Abilities Screening Instrument,MNIMontreal
Neurological Institute
only in the C-carriers. For the six peak clusters showing TT > C-carriers in covariance strength, the frontoinsular seed- BA10 or -BA6 and dorsolateral-right temporal cluster showed significant correlations with cognitive tests in TT genotype. For C-carriers, the fusiform gyrus showed significant correlation with cognitive tests.
No differences of WM integrities between two genotype groups
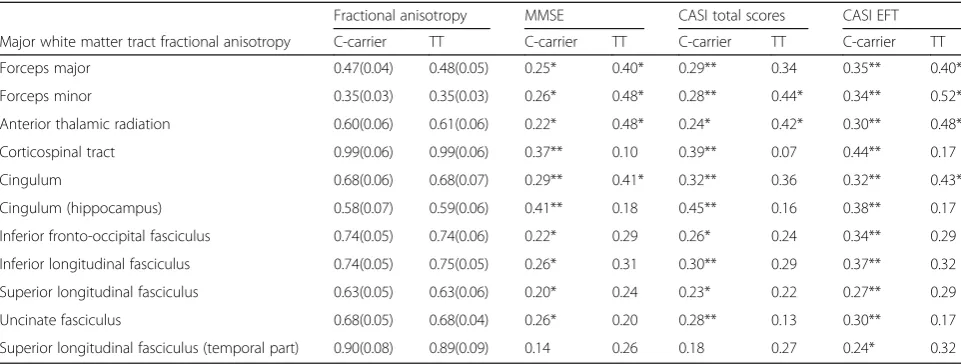
For major WM tract FA, the differences between the two genotype groups and correlations with cognitive tests are shown in Table 5. The correlation between fiber bundle FA and cognitive tests were significant in both groups but there were no statistic differences between the two genotype groups.
Discussion
This study provides data on the network-specific geno-type influence of IL-1 beta in the early stages of AD. There were three main findings. First, the seed-based SCN pattern validated the hypothesis that IL-1 beta C-511 T polymorphism targets different functional net-works in patients with AD, of which interactions between C-carriers and T homozygotes differed in co-variance strength. The increased coco-variance strength be-tween the frontoinsular-BA10, frontoinsular-BA6, and dorsolateral-temporal axis in TT homozygotes suggest increased influences involving the anterior prefrontal-re-lated degenerative scaffold by this genotype. In contrast, the entorhinal-cingulum connections were increased in
the C-carriers. Second, IL-1 beta C-511 T functional poly-morphism exerts no significant effects on the preselected cerebrovascular risk biomarkers, seed, or peak cluster vol-umes. Finally, the C-511 T genetic effect may interfere with the SCN network independent of the WMHs, as no differences were found between the two genotype groups in diffusion parameters.
IL-1 beta genotypes and AD diagnosis
The impact of IL-1 beta C-511 T polymorphism on amyloid beta immunoreactivity in the brains of patients with AD [55] or amyloid beta levels in the cerebral spinal fluid of patients with AD [56] suggest the import-ant role of this polymorphism in modulating the path-ology of AD, although findings regarding C-511 T polymorphism on the susceptibility to AD or the effect on AD onset age have been inconsistent [14, 55–58]. IL-1 beta exerts a myriad of effects in the brain and, in par-ticular, plays a significant role in hippocampal synaptic function, which is implicated in the AD pathogenesis [9]. Although an increased IL-1 beta expression has been reported in Taiwan Chinese TT-carriers [14] which is thought to modulate hippocampal function, we did not find such relationships between the −511 TT poly-morphism and entorhinal seed volume and cognitive outcomes. In contrast, the significant correlations be-tween cognitive test scores and cingulum volume (i.e., entorhinal-interconnect peak cluster) in the −511 C-carriers may support the selective IL-1 beta genetic modulation in the entorhinal anchored network of AD
Table 3Connectivity interactions of interleukin-1 beta genotypes with pre-defined seed
Seed Peak regions Stereotaxic coordinates Extent MaxT pvalue
x y z
C-carrier > TT
Entorhinal seed Middle cingulum R 5 −12 48 118 3.81 0.0001
PCC seed N.A
Frontoinsular seed N.A
Dorsolateral prefrontal N.A
C-carrier < TT
Entorhinal seed N.A
PCC seed N.A
Frontoinsular seed BA 10 R 19.5 63 3.0 196 4.51 0.0001
Middle frontal R 31.5 10.5 58.5 243 3.47 0.0001
Dorsolateral prefrontal Superior frontal R 21 37.5 49.5 671 5.09 0.0001
Precentral L −52.5 −1.5 −43.5 214 3.58 0.0001
Fusiform L −43.5 −54 −15 123 4.17 0.0001
Inferior temporal R 40.5 −55.5 −9 119 4.03 0.0001
Peak regions are within the main cluster
Max T is the maximum T statistic for each local maximum.p< 0.001 with cluster size = 100
patients. In contrast, no association was reported be-tween the IL-1−511 TT polymorphism and AD in Hong Kong [59] or China [60] Han Chinese. This discrepancy may partially reflect differences in ethnicity among Han Chinese [61].
While the DMN in patients with AD has been demon-strated to show reduced connectivity compared with controls, enhanced resting-state functional connectivity of the SN [62] or ECN [32, 33] has also been found in AD patients. The increase in network connectivity in AD has been hypothesized to reflect a compensatory mechanism for weakened posterior hubs [63] and to
participate in functions such as sustained attention, working memory, response selection, or suppression [31]. As such, changes in structural covariance strength in the IL-1 beta C-511 T polymorphism may infer the capacity of this polymorphism to modulate symptoms in patients with AD. As increased covari-ance strength indicates stronger interconnections be-tween seed and peak clusters, we speculate the −511 TT variant may potentially be a more vulnerable genotype group in this context. Once the compensa-tory regions located in the anterior brain axis were involved by pathology, the specific involvement of the
Table 4Correlation matrix between cognitive test scores with peak clusters volume
Covariance strength relationship C > TT C < TT
Seed region R entorhinal R frontoinsular seed R dorsolateral seed
Peak clusters R cingulum BA10 BA6 R superior sagittal
prefrontal
L precentral L fusiform gyrus R temporal
Cognitive tests IL-1 beta genotype :-511 C-carriers
MMSE 0.24* 0.07 0.15 0.16 0.24* 0.17 0.06
CASI total scores 0.26** 0.09 0.19* 0.17 0.28** 0.19 0.05
CASI EFT scores 0.21* 0.12 0.16 0.13 0.25** 0.19* 0.07
CASI subdomains
Short-term memory 0.21* 0.04 0.08 0.12 0.26** 0.07 0.05
Orientation 0.22* −0.03 0.15 0.09 0.24* 0.16 0.08
Long-term memory 0.31** 0.05 0.16 0.18 0.25** 0.04 0.15
Language 0.16 0.04 0.16 0.30** 0.25 0.09 −0.06
Drawing 0.14 0.16 0.19 0.11 0.05 0.29** −0.06
Attention 0.17 0.05 0.17 0.06 0.30** 0.01 −0.07
Verbal fluency 0.23* 0.04 0.04 0.18 0.23* 0.18 0.03
Abstract thinking 0.20* 0.11 0.12 0.09 0.12 0.25* 0.07
Mental manipulation 0.07 0.14 0.14 0.12 0.17 0.17 0.15
Cognitive tests IL-1 beta genotype :-511 TT
MMSE 0.12 0.43* 0.39* 0.36 0.30 0.40* 0.48*
CASI total scores 0.14 0.47* 0.44* 0.48* 0.34 0.35 0.56**
CASI EFT scores 0.21 0.44* 0.39* 0.39* 0.40* 0.35 0.60**
CASI Subdomains
Short Term Memory −0.03 0.34 0.19 0.38 0.02 0.37 0.22
Orientation 0.16 0.43* 0.39 0.42* 0.24 0.30 0.46*
Long Term Memory 0.02 0.36 0.49 0.54** 0.39* 0.22 0.56**
Language 0.11 0.38 0.51 0.48* 0.43* 0.30 0.60**
Drawing 0.09 0.55** 0.48 0.54** 0.31 0.26 0.51**
Attention 0.06 0.32 0.27 0.35 0.39 0.33 0.57**
Verbal fluency 0.30 0.69** 0.46* 0.27 0.29 0.23 0.39*
Abstract thinking 0.26 0.37 0.40* 0.39 0.41* 0.19 0.56**
Mental manipulation 0.01 0.29 0.30 0.29 0.28 0.43* 0.47*
Numbers indicate Pearson correlation coefficients between peak cluster volume and test scores, *p< 0.05; **p< 0.01
MMSEMini-Mental State Examination,EFTexecutive function test,Rright,Lleft,IL-1interleukin-1,CASICognitive Abilities Screening Instrument,BABrodmann area,
SN and ECN in the TT group may accelerate the de-generation process.
IL-1 beta genotypes and brain network analysis
The mechanism by which IL-1 beta C-511 T polymorph-ism affect the brain networks in patients with AD has yet to be fully established. The higher IL-1 beta gene ex-pression during long-term potentiation suggests its role in synaptic function [15]. In patients with mild to mod-erate stage AD, carriers of the -511C allele have been shown to have a reduced inflammatory response, and this has been proposed to allow for better cognitive im-provements on a ketone body based treatment [64]. Studies of other IL-1 beta polymorphisms have also sug-gested the anti-correlated relationships between the ex-pression of IL-1 beta and cognitive performance [65]. Functional connectivity analysis in normal elderly has shown that the IL-1 beta−511 TT carriers have reduced connectivity of the anterior mid-cingulate-prefrontal-striate networks [66], pointing to the role of this func-tional polymorphism and the anterior brain network.
Our analysis provides evidence that GM network alter-ations may be considered as the endophenotype of the IL-1 beta C-511 T polymorphism that predicts the cog-nitive outcomes. Although we purposed that increased structural covariance strength within functional network may lead to detrimental effects in patients with AD, whether the genetic effects by our reports fully address the hippocampal IL-1 beta expression still left unex-plored. Data on IL-1 beta genotypes and postmortem IL-1 beta level examinations are needed to elucidate the consequences. In line with our findings, several neuro-imaging studies have also demonstrated the detrimental
effects of IL-1 beta -511 T allele on fronto-temporal GM [67, 68], left dorsolateral prefrontal cortex [68–70], or parahippocampus [71] in various brain disorders.
Increased structural covariance between the cingulum peak cluster and entorhinal seed was found in the C-carriers compared with TT homozygotes. Adjusted for educational years, this covariance also determines cogni-tive test scores in the C carriers, suggesting the unique covariance strength relationship in terms of spatial dis-tribution in AD. Current research criteria of AD [40] do not include the influence of genomic data; however, re-cent results from studies on neuronal exosomes and nanosomes [72–74] support the importance of metabolic and inflammatory abnormalities in predicting the pro-dromal phase. Since metabolic and inflammatory func-tions are greatly under genetic control, this may be productive if genetic profiling is taken into consideration in the diagnosis of patients with cognitive deficits.
IL-1 beta genotypes and cognition
There have been many IL-1 beta genetic association studies on individuals without dementia during the cog-nitive aging stages. A cross-sectional study reported a significant relationship between C-511 T polymorphism and episodic memory, with a better performance in the C homozygous than in the CT/TT group [75]. As the authors [75] did not find any association between this polymorphism and attention, processing or motor func-tion, they suggested that the effect of this IL-1 beta poly-morphism on cognition may be domain-specific (i.e., memory-specific). In accordance with their findings, two other studies on elderly males [45] and elderly females [76] showed that −511 C-carriers had higher scores in
Table 5Significant relationships between major white matter tracts integrity and interleukin-1 beta genotype groups or cognitive test scores
Fractional anisotropy MMSE CASI total scores CASI EFT
Major white matter tract fractional anisotropy C-carrier TT C-carrier TT C-carrier TT C-carrier TT
Forceps major 0.47(0.04) 0.48(0.05) 0.25* 0.40* 0.29** 0.34 0.35** 0.40*
Forceps minor 0.35(0.03) 0.35(0.03) 0.26* 0.48* 0.28** 0.44* 0.34** 0.52*
Anterior thalamic radiation 0.60(0.06) 0.61(0.06) 0.22* 0.48* 0.24* 0.42* 0.30** 0.48*
Corticospinal tract 0.99(0.06) 0.99(0.06) 0.37** 0.10 0.39** 0.07 0.44** 0.17
Cingulum 0.68(0.06) 0.68(0.07) 0.29** 0.41* 0.32** 0.36 0.32** 0.43*
Cingulum (hippocampus) 0.58(0.07) 0.59(0.06) 0.41** 0.18 0.45** 0.16 0.38** 0.17
Inferior fronto-occipital fasciculus 0.74(0.05) 0.74(0.06) 0.22* 0.29 0.26* 0.24 0.34** 0.29
Inferior longitudinal fasciculus 0.74(0.05) 0.75(0.05) 0.26* 0.31 0.30** 0.29 0.37** 0.32
Superior longitudinal fasciculus 0.63(0.05) 0.63(0.06) 0.20* 0.24 0.23* 0.22 0.27** 0.29
Uncinate fasciculus 0.68(0.05) 0.68(0.04) 0.26* 0.20 0.28** 0.13 0.30** 0.17
Superior longitudinal fasciculus (temporal part) 0.90(0.08) 0.89(0.09) 0.14 0.26 0.18 0.27 0.24* 0.32
Data of Fractional Anisotropy represent mean (standard deviation),MMSEMini-Mental State Examination scores,CASICognitive Ability Screening Instrument,EFT
executive function test,EFTSum of attention, verbal fluency, abstract thinking, and mental manipulation sub-domain scores of the CASI,TTT homozygotes
general or in selective cognitive tests compared to the T homozygotes. After adjusting for years of education, our correlation results suggested parallel relationships be-tween seed and peak cluster volumes in relation to cog-nitive tests scores in the genotype groups. As the cross-sectional cognitive test design may have resulted in population selections bias, data on cross-sectional models may not fully address whether IL-1 beta C-511 T polymorphisms mediate domain-specific cognitive defi-cits or whether they are more generalized [45, 77, 78]. A longitudinal follow-up study may increase the accuracy of genotypes and involved cognitive domains. In contrast to previous reports, our study analysis did not establish a direct C-511 T genotype effect on cognitive test scores.
IL-1 beta genotypes and WMHs
Homozygotes for the IL-1 beta -511 T allele have been associated with larger WMHs than other genotypic com-binations in the elderly without dementia [24]; however, we did not find such an association in AD. Nonetheless, our results show that the IL-1 beta genetic effect can be solely present in the GM network, and that this effect is independent of the modulation of WMHs. Our study only enrolls patients in the early stage and AD pathology is more localized in the GM in the early stage of AD. Thus, the influence of IL-1 beta C-511 T polymorphism on WMHs may be stage-specific.
Study limitations
An important limitation of this study is that we did not include a control group. The enrolment of controls may help to understand whether IL-1 beta C-511 T poly-morphism has similar effects on the normative brain network. Nonetheless, the aim of this study was to deter-mine whether changes in the SCN caused by IL-1 beta genetic polymorphism in AD patients. Our results sup-port the data from elderly healthy subjects [71] that gen-etic variations of IL-1 beta mediate the dorsolateral prefrontal cortex, yet the analysis of SCN patterns with changes in structural covariance strength was not avail-able. Another potential limitation is that we reported the genetic effect between the C-carriers and TT homozy-gotes, and such group stratification could not explore the model of heterozygote advantage. We based this de-cision on the small sample size and a previously pub-lished report [13] on the IL-1 beta dosage effects. Thirdly, as clinical significance was established in four pre-defined networks, we did not test whether other net-works participated in genetic modulation. The use of in-dependent component analysis [79] or resting state functional MRI data may elucidate other potential net-works and also validate the findings observed in this study. Finally, cognitive tests such as MMSE and CASI
are often used as screening tests. Further studies are warranted that include an extensive battery of tests.
Conclusions
In the early stages of AD, our analysis supports that IL-1 beta C-511 T polymorphism modulates the strength of the structural covariance independent of WMHs. The
−511 TT homozygotes convey increased covariance pat-terns in anterior brain networks that may then modulate the degenerative process differently from the patterns of entorhinal-cingulum networks in C-carriers.
Additional file
Additional file 1:The peak clusters in the structural covariance network. (DOCX 39 kb)
Abbreviations
AD:Alzheimer’s disease; CASI: Cognitive Abilities Screening Instrument; DARTEL: Diffeomorphic anatomical registration using exponentiated lie algebra; DMN: Default mode network; ECN: Executive control network; EFT: Executive function test; FA: Fractional anisotropy; FDR: False discovery rate; GM: Gray matter; IL-1: Interleukin-1; MMSE: Mini-Mental State Examination; MNI: Montreal Neurological Institute; PCR: Polymerase chain reaction; ROIs: Regions of interest; SCNs: Structural covariance networks; SN: Salience network; WM: White matter; WMHs: White matter hyperintensities
Acknowledgements
The authors wish to acknowledge Yu-Ting Lin and Su-Chen Liu for the experiment schedule.
Funding
This work was supported by grants CMRPG8C0571, CMRPG8D0771, and CMRPG8E0541 from Chang Gung Memorial Hospital, and 104-2314-B-182A-026-MY2 from the National Science Council to CCC for MRI acquisition, genetic, and clinical data collection and analysis.
Availability of data and materials
The datasets generated during and/or analyzed during the current study are not publicly available due to the intelligence rights owned by the hospital and the authors but are available from the corresponding author on reasonable request.
Authors’contributions
CW, SJ, and ME carried out the genetic studies, participated in the sequence alignment and drafted the manuscript. SW and CC-Lee carried out the MRI acquisition, data analysis, and interpretation. MT participated in the sequence alignment. NC, SH, YT, and WC participated in the design of the study and performed the statistical analysis. SJ and CC-Chang conceived of the study, participated in its design and coordination, and helped to draft the manuscript. WN provided critical intellectual information for the revision. All authors read and approved the final manuscript.
Competing interests
The authors declare that they have no competing interests.
Consent for publication
Not applicable.
Ethics approval and consent to participate
Author details
1Department of Neurology, Cognition and Aging Center, Kaohsiung Chang
Gung Memorial Hospital, Chang Gung University College of Medicine, #123, Ta-Pei Road, Niaosung, Kaohsiung County 833, Taiwan.2Department of Radiology, Kaohsiung Chang Gung Memorial Hospital, Chang Gung University College of Medicine, Niaosung, Kaohsiung, Taiwan.3Psychiatric
Department of Taipei Veterans General Hospital, Taipei, Taiwan.4Psychiatric
Division, School of Medicine, National Yang-Ming University, Taipei, Taiwan.
5Department of Nuclear Medicine, Cognition and Aging Center, Kaohsiung
Chang Gung Memorial Hospital, Chang Gung University College of Medicine, Niaosung, Kaohsiung, Taiwan.
Received: 5 August 2016 Accepted: 4 January 2017
References
1. Dickson DW, Lee SC, Mattiace LA, Yen SH, Brosnan C. Microglia and cytokines in neurological disease, with special reference to AIDS and Alzheimer’s disease. Glia. 1993;7:75–83.
2. Holmes C, Cunningham C, Zotova E, Woolford J, Dean C, Kerr S, Culliford D, Perry VH. Systemic inflammation and disease progression in Alzheimer disease. Neurology. 2009;73:768–74.
3. Nelson PT, Alafuzoff I, Bigio EH, Bouras C, Braak H, Cairns NJ, Castellani RJ, Crain BJ, Davies P, Del Tredici K, et al. Correlation of Alzheimer disease neuropathologic changes with cognitive status: a review of the literature. J Neuropathol Exp Neurol. 2012;71:362–81.
4. Wirth M, Madison CM, Rabinovici GD, Oh H, Landau SM, Jagust WJ. Alzheimer’s disease neurodegenerative biomarkers are associated with decreased cognitive function but not beta-amyloid in cognitively normal older individuals. J Neurosci. 2013;33:5553–63.
5. Candore G, Bulati M, Caruso C, Castiglia L, Colonna-Romano G, Di Bona D, Duro G, Lio D, Matranga D, Pellicano M, et al. Inflammation, cytokines, immune response, apolipoprotein E, cholesterol, and oxidative stress in Alzheimer disease: therapeutic implications. Rejuvenation Res. 2010;13:301–13. 6. Cevenini E, Caruso C, Candore G, Capri M, Nuzzo D, Duro G, Rizzo C,
Colonna-Romano G, Lio D, Di Carlo D, et al. Age-related inflammation: the contribution of different organs, tissues and systems. How to face it for therapeutic approaches. Curr Pharm Des. 2010;16:609–18.
7. Di Bona D, Scapagnini G, Candore G, Castiglia L, Colonna-Romano G, Duro G, Nuzzo D, Iemolo F, Lio D, Pellicano M, et al. Immune-inflammatory responses and oxidative stress in Alzheimer’s disease: therapeutic implications. Curr Pharm Des. 2010;16:684–91. 8. Vasto S, Candore G, Duro G, Lio D, Grimaldi MP, Caruso C. Alzheimer’s
disease and genetics of inflammation: a pharmacogenomic vision. Pharmacogenomics. 2007;8:1735–45.
9. Lynch MA. Interleukin-1 beta exerts a myriad of effects in the brain and in particular in the hippocampus: analysis of some of these actions. Vitam Horm. 2002;64:185–219.
10. Shaftel SS, Kyrkanides S, Olschowka JA, Miller JN, Johnson RE, O’Banion MK. Sustained hippocampal IL-1 beta overexpression mediates chronic neuroinflammation and ameliorates Alzheimer plaque pathology. J Clin Invest. 2007;117:1595–604.
11. Ghosh S, Wu MD, Shaftel SS, Kyrkanides S, LaFerla FM, Olschowka JA, O’Banion MK. Sustained interleukin-1beta overexpression exacerbates tau pathology despite reduced amyloid burden in an Alzheimer’s mouse model. J Neurosci. 2013;33:5053–64.
12. Hollegaard MV, Bidwell JL. Cytokine gene polymorphism in human disease: on-line databases, supplement 3. Genes Immun. 2006;7:269–76.
13. Pociot F, Molvig J, Wogensen L, Worsaae H, Nerup J. A TaqI polymorphism in the human interleukin-1 beta (IL-1 beta) gene correlates with IL-1 beta secretion in vitro. Eur J Clin Invest. 1992;22:396–402.
14. Wang WF, Liao YC, Wu SL, Tsai FJ, Lee CC, Hua CS. Association of interleukin-I beta and receptor antagonist gene polymorphisms with late onset Alzheimer’s disease in Taiwan Chinese. Eur J Neurol. 2005;12:609–13. 15. Schneider H, Pitossi F, Balschun D, Wagner A, del Rey A, Besedovsky HO. A neuromodulatory role of interleukin-1beta in the hippocampus. Proc Natl Acad Sci U S A. 1998;95:7778–83.
16. Barrientos RM, Sprunger DB, Campeau S, Watkins LR, Rudy JW, Maier SF. BDNF mRNA expression in rat hippocampus following contextual learning is blocked by intrahippocampal IL-1beta administration. J Neuroimmunol. 2004;155:119–26.
17. Huang CW, Chang WN, Lui CC, Chen CF, Lu CH, Wang YL, Chen C, Juang YY, Lin YT, Tu MC, Chang CC. Impacts of hyper-homocysteinemia and white matter hyper-intensity in Alzheimer’s disease patients with normal creatinine: an MRI-based study with longitudinal follow-up. Curr Alzheimer Res. 2010;7:527–33.
18. Tu MC, Huang CW, Chen NC, Chang WN, Lui CC, Chen CF, Chen C, Wang YL, Lin YT, Chang CC. Hyperhomocysteinemia in Alzheimer dementia patients and cognitive decline after 6 months follow-up period. Acta Neurol Taiwan. 2010;19:168–77.
19. Chang YT, Chang CC, Lin HS, Huang CW, Chang WN, Lui CC, Lee CC, Lin YT, Chen CH, Chen NC. Montreal cognitive assessment in assessing clinical severity and white matter hyperintensity in Alzheimer’s disease with normal control comparison. Acta Neurol Taiwan. 2012;21:64–73.
20. Deppe M, Duning T, Mohammadi S, Schwindt W, Kugel H, Knecht S, Ringelstein EB. Diffusion-tensor imaging at 3 T: detection of white matter alterations in neurological patients on the basis of normal values. Invest Radiol. 2007;42:338–45.
21. Hoth KF, Haley AP, Gunstad J, Paul RH, Poppas A, Jefferson AL, Tate DF, Ono M, Jerskey BA, Cohen RA. Elevated C-reactive protein is related to cognitive decline in older adults with cardiovascular disease. J Am Geriatr Soc. 2008;56:1898–903.
22. Huang CW, Chang WN, Huang SH, Lui CC, Chen NC, Chang YT, Lee CC, Chang CC, Chang AY. Impact of homocysteine on cortical perfusion and cognitive decline in mild Alzheimer’s dementia. Eur J Neurol. 2013;20:1191–7. 23. Huang CW, Tsai MH, Chen NC, Chen WH, Lu YT, Lui CC, Chang YT, Chang WN,
Chang AY, Chang CC. Clinical significance of circulating vascular cell adhesion molecule-1 to white matter disintegrity in Alzheimer’s dementia. Thromb Haemost. 2015;114:1230–40.
24. Raz N, Yang Y, Dahle CL, Land S. Volume of white matter hyperintensities in healthy adults: contribution of age, vascular risk factors, and inflammation-related genetic variants. Biochim Biophys Acta. 1822;2012:361–9. 25. Zhang Z, Liu LJ, Zhang C, Yu YP. Association between Interleukin-1 gene
single nucleotide polymorphisms and ischemic stroke classified by TOAST criteria in the Han population of northern China. Biomed Res Int. 2013;2013:961039.
26. Dziedzic T, Slowik A, Pera J, Szczudlik A. Interleukin 1 beta polymorphism (−511) and risk of stroke due to small vessel disease. Cerebrovasc Dis. 2005;20:299–303.
27. Alexander-Bloch A, Giedd JN, Bullmore E. Imaging structural co-variance between human brain regions. Nat Rev Neurosci. 2013;14:322–36. 28. Greicius MD, Srivastava G, Reiss AL, Menon V. Default-mode network activity
distinguishes Alzheimer’s disease from healthy aging: evidence from functional MRI. Proc Natl Acad Sci U S A. 2004;101:4637–42.
29. Greicius MD, Supekar K, Menon V, Dougherty RF. Resting-state functional connectivity reflects structural connectivity in the default mode network. Cereb Cortex. 2009;19:72–8.
30. Seeley WW, Allman JM, Carlin DA, Crawford RK, Macedo MN, Greicius MD, Dearmond SJ, Miller BL. Divergent social functioning in behavioral variant frontotemporal dementia and Alzheimer disease: reciprocal networks and neuronal evolution. Alzheimer Dis Assoc Disord. 2007;21:S50–57. 31. Seeley WW, Menon V, Schatzberg AF, Keller J, Glover GH, Kenna H, Reiss AL,
Greicius MD. Dissociable intrinsic connectivity networks for salience processing and executive control. J Neurosci. 2007;27:2349–56.
32. Agosta F, Pievani M, Geroldi C, Copetti M, Frisoni GB, Filippi M. Resting state fMRI in Alzheimer’s disease: beyond the default mode network. Neurobiol Aging. 2012;33:1564–78.
33. Filippi M, Agosta F, Scola E, Canu E, Magnani G, Marcone A, Valsasina P, Caso F, Copetti M, Comi G, et al. Functional network connectivity in the behavioral variant of frontotemporal dementia. Cortex. 2013;49:2389–401. 34. Andrews-Hanna JR, Reidler JS, Sepulcre J, Poulin R, Buckner RL.
Functional-anatomic fractionation of the brain’s default network. Neuron. 2010;65:550–62.
35. Jack Jr CR, Lowe VJ, Weigand SD, Wiste HJ, Senjem ML, Knopman DS, Shiung MM, Gunter JL, Boeve BF, Kemp BJ, et al. Serial PIB and MRI in normal, mild cognitive impairment and Alzheimer’s disease: implications for sequence of pathological events in Alzheimer’s disease. Brain. 2009;132:1355–65.
37. Hong SB, Zalesky A, Park S, Yang YH, Park MH, Kim B, Song IC, Sohn CH, Shin MS, Kim BN, et al. COMT genotype affects brain white matter pathways in attention-deficit/hyperactivity disorder. Hum Brain Mapp. 2015;36:367–77.
38. Thompson PM, Ge T, Glahn DC, Jahanshad N, Nichols TE. Genetics of the connectome. Neuroimage. 2013;80:475–88.
39. Zeidan-Chulia F, de Oliveira BH, Salmina AB, Casanova MF, Gelain DP, Noda M, Verkhratsky A, Moreira JC. Altered expression of Alzheimer’s disease-related genes in the cerebellum of autistic patients: a model for disrupted brain connectome and therapy. Cell Death Dis. 2014;5:e1250.
40. Dubois B, Feldman HH, Jacova C, Cummings JL, Dekosky ST, Barberger-Gateau P, Delacourte A, Frisoni G, Fox NC, Galasko D, et al. Revising the definition of Alzheimer’s disease: a new lexicon. Lancet Neurol. 2010;9:1118–27. 41. Chang CC, Kramer JH, Lin KN, Chang WN, Wang YL, Huang CW, Lin YT,
Chen C, Wang PN. Validating the Chinese version of the Verbal Learning Test for screening Alzheimer’s disease. J Int Neuropsychol Soc. 2010;16:244–51. 42. Rosen WG, Terry RD, Fuld PA, Katzman R, Peck A. Pathological verification of
ischemic score in differentiation of dementias. Ann Neurol. 1980;7:486–8. 43. Folstein MF, Folstein SE, McHugh PR.“Mini-mental state”. A practical
method for grading the cognitive state of patients for the clinician. J Psychiatr Res. 1975;12:189–98.
44. Teng EL, Hasegawa K, Homma A, Imai Y, Larson E, Graves A, Sugimoto K, Yamaguchi T, Sasaki H, Chiu D, et al. The Cognitive Abilities Screening Instrument (CASI): a practical test for cross-cultural epidemiological studies of dementia. Int Psychogeriatr. 1994;6:45–58. discussion 62.
45. Tsai SJ, Hong CJ, Liu ME, Hou SJ, Yen FC, Hsieh CH, Liou YJ. Interleukin-1 beta (C-511 T) genetic polymorphism is associated with cognitive performance in elderly males without dementia. Neurobiol Aging. 2010;31:1950–5. 46. Del Bo R, Comi GP, Bresolin N, Castelli E, Conti E, Degiuli A, Ausenda CD,
Scarlato G. The apolipoprotein E epsilon4 allele causes a faster decline of cognitive performances in Down’s syndrome subjects. J Neurol Sci. 1997;145:87–91.
47. Wu MK, Lu YT, Huang CW, Lin PH, Chen NC, Lui CC, Chang WN, Lee CC, Chang YT, Chen SF, Chang CC. Clinical significance of cerebrovascular biomarkers and white matter tract integrity in Alzheimer disease: clinical correlations with neurobehavioral data in cross-sectional and after 18 months follow-ups. Medicine (Baltimore). 2015;94:e1192. 48. Cuingnet R, Gerardin E, Tessieras J, Auzias G, Lehericy S, Habert MO,
Chupin M, Benali H, Colliot O. Automatic classification of patients with Alzheimer’s disease from structural MRI: a comparison of ten methods using the ADNI database. Neuroimage. 2011;56:766–81.
49. Bernhardt BC, Worsley KJ, Besson P, Concha L, Lerch JP, Evans AC, Bernasconi N. Mapping limbic network organization in temporal lobe epilepsy using morphometric correlations: insights on the relation between mesiotemporal connectivity and cortical atrophy. Neuroimage. 2008;42:515–24.
50. Spreng RN, Turner GR. Structural covariance of the default network in healthy and pathological aging. J Neurosci. 2013;33:15226–34.
51. Zielinski BA, Anderson JS, Froehlich AL, Prigge MB, Nielsen JA, Cooperrider JR, Cariello AN, Fletcher PT, Alexander AL, Lange N, et al. scMRI reveals large-scale brain network abnormalities in autism. PLoS One. 2012;7:e49172.
52. Nichols TE, Holmes AP. Nonparametric permutation tests for functional neuroimaging: a primer with examples. Hum Brain Mapp. 2002;15:1–25. 53. Hua K, Zhang J, Wakana S, Jiang H, Li X, Reich DS, Calabresi PA, Pekar JJ,
van Zijl PC, Mori S. Tract probability maps in stereotaxic spaces: analyses of white matter anatomy and tract-specific quantification. Neuroimage. 2008;39:336–47.
54. Ashburner J, Friston KJ. Voxel-based morphometry—the methods. Neuroimage. 2000;11:805–21.
55. Green EK, Harris JM, Lemmon H, Lambert JC, Chartier-Harlin MC, St Clair D, Mann DM, Iwatsubo T, Lendon CL. Are interleukin-1 gene polymorphisms risk factors or disease modifiers in AD? Neurology. 2002;58:1566–8. 56. Ehl C, Kolsch H, Ptok U, Jessen F, Schmitz S, Frahnert C, Schlosser R, Rao ML,
Maier W, Heun R. Association of an interleukin-1beta gene polymorphism at position−511 with Alzheimer’s disease. Int J Mol Med. 2003;11:235–8. 57. Grimaldi LM, Casadei VM, Ferri C, Veglia F, Licastro F, Annoni G, Biunno I,
De Bellis G, Sorbi S, Mariani C, et al. Association of early-onset Alzheimer’s disease with an interleukin-1alpha gene polymorphism. Ann Neurol. 2000;47:361–5.
58. Licastro F, Pedrini S, Ferri C, Casadei V, Govoni M, Pession A, Sciacca FL, Veglia F, Annoni G, Bonafe M, et al. Gene polymorphism affecting
alpha1-antichymotrypsin and interleukin-1 plasma levels increases Alzheimer’s disease risk. Ann Neurol. 2000;48:388–91.
59. Ma SL, Tang NL, Lam LC, Chiu HF. Lack of association of the interleukin-1beta gene polymorphism with Alzheimer’s disease in a Chinese population. Dement Geriatr Cogn Disord. 2003;16:265–8.
60. Li XQ, Zhang JW, Zhang ZX, Chen D, Qu QM. Interleukin-1 gene cluster polymorphisms and risk of Alzheimer’s disease in Chinese Han population. J Neural Transm (Vienna). 2004;111:1183–90.
61. Chen CH, Yang JH, Chiang CW, Hsiung CN, Wu PE, Chang LC, Chu HW, Chang J, Song IW, Yang SL, et al. Population structure of Han Chinese in the modern Taiwanese population based on 10,000 participants in the Taiwan Biobank project. Hum Mol Genet. 2016.
62. Supekar K, Menon V, Rubin D, Musen M, Greicius MD. Network analysis of intrinsic functional brain connectivity in Alzheimer’s disease. PLoS Comput Biol. 2008;4:e1000100.
63. Zhou J, Greicius MD, Gennatas ED, Growdon ME, Jang JY, Rabinovici GD, Kramer JH, Weiner M, Miller BL, Seeley WW. Divergent network connectivity changes in behavioural variant frontotemporal dementia and Alzheimer’s disease. Brain. 2010;133:1352–67.
64. Henderson ST, Poirier J. Pharmacogenetic analysis of the effects of polymorphisms in APOE, IDE and IL1B on a ketone body based therapeutic on cognition in mild to moderate Alzheimer’s disease: a randomized, double-blind, placebo-controlled study. BMC Med Genet. 2011;12:137. 65. Benke KS, Carlson MC, Doan BQ, Walston JD, Xue QL, Reiner AP, Fried LP,
Arking DE, Chakravarti A, Fallin MD. The association of genetic variants in interleukin-1 genes with cognition: findings from the cardiovascular health study. Exp Gerontol. 2011;46:1010–9.
66. Tu PC, Su TP, Huang CC, Yang AC, Yeh HL, Hong CJ, Liou YJ, Liu ME, Lin CP, Tsai SJ. Interleukin-1 beta C-511 T polymorphism modulates functional connectivity of anterior midcingulate cortex in non-demented elderly Han males. Brain Struct Funct. 2014;219:61–9.
67. Meisenzahl EM, Rujescu D, Kirner A, Giegling I, Kathmann N, Leinsinger G, Maag K, Hegerl U, Hahn K, Moller HJ. Association of an interleukin-1beta genetic polymorphism with altered brain structure in patients with schizophrenia. Am J Psychiatry. 2001;158:1316–9.
68. Papiol S, Molina V, Desco M, Rosa A, Reig S, Sanz J, Palomo T, Fananas L. Gray matter deficits in bipolar disorder are associated with genetic variability at interleukin-1 beta gene (2q13). Genes Brain Behav. 2008;7:796–801.
69. Papiol S, Molina V, Rosa A, Sanz J, Palomo T, Fananas L. Effect of interleukin-1beta gene functional polymorphism on dorsolateral prefrontal cortex activity in schizophrenic patients. Am J Med Genet B Neuropsychiatr Genet. 2007;144B:1090–3.
70. Fatjo-Vilas M, Pomarol-Clotet E, Salvador R, Monte GC, Gomar JJ, Sarro S, Ortiz-Gil J, Aguirre C, Landin-Romero R, Guerrero-Pedraza A, et al. Effect of the interleukin-1beta gene on dorsolateral prefrontal cortex function in schizophrenia: a genetic neuroimaging study. Biol Psychiatry. 2012;72:758–65. 71. Persson N, Ghisletta P, Dahle CL, Bender AR, Yang Y, Yuan P, Daugherty AM,
Raz N. Regional brain shrinkage over two years: individual differences and effects of pro-inflammatory genetic polymorphisms. Neuroimage. 2014;103:334–48.
72. Fiandaca MS, Kapogiannis D, Mapstone M, Boxer A, Eitan E, Schwartz JB, Abner EL, Petersen RC, Federoff HJ, Miller BL, Goetzl EJ. Identification of preclinical Alzheimer’s disease by a profile of pathogenic proteins in neurally derived blood exosomes: a case-control study. Alzheimers Dement. 2015;11:600–7. e601.
73. Goetzl EJ, Boxer A, Schwartz JB, Abner EL, Petersen RC, Miller BL, Carlson OD, Mustapic M, Kapogiannis D. Low neural exosomal levels of cellular survival factors in Alzheimer’s disease. Ann Clin Transl Neurol. 2015;2:769–73. 74. Goetzl EJ, Boxer A, Schwartz JB, Abner EL, Petersen RC, Miller BL,
Kapogiannis D. Altered lysosomal proteins in neural-derived plasma exosomes in preclinical Alzheimer disease. Neurology. 2015;85:40–7. 75. Baune BT, Ponath G, Rothermundt M, Riess O, Funke H, Berger K.
Association between genetic variants of IL-1beta, IL-6 and TNF-alpha cytokines and cognitive performance in the elderly general population of the MEMO-study. Psychoneuroendocrinology. 2008;33:68–76.
76. Sasayama D, Hori H, Teraishi T, Hattori K, Ota M, Matsuo J, Kawamoto Y, Kinoshita Y, Higuchi T, Amano N, Kunugi H. Association of interleukin-1beta genetic polymorphisms with cognitive performance in elderly females without dementia. J Hum Genet. 2011;56:613–6.
polymorphism in inflammatory genes in subjective memory complainers. Neurobiol Aging. 2012;33:1054–6.
78. Marioni RE, Deary IJ, Murray GD, Fowkes FG, Price JF. Associations between polymorphisms in five inflammation-related genes and cognitive ability in older persons. Genes Brain Behav. 2010;9:348–52.
79. Beckmann CF, DeLuca M, Devlin JT, Smith SM. Investigations into resting-state connectivity using independent component analysis. Philos Trans R Soc Lond B Biol Sci. 2005;360:1001–13.
• We accept pre-submission inquiries
• Our selector tool helps you to find the most relevant journal
• We provide round the clock customer support
• Convenient online submission
• Thorough peer review
• Inclusion in PubMed and all major indexing services
• Maximum visibility for your research
Submit your manuscript at www.biomedcentral.com/submit