by
Sarah Nichole Bruce
A thesis
submitted in partial fulfillment of the requirements for the degree of Master of Science in Mathematics Education
Boise State University
DEFENSE COMMITTEE AND FINAL READING APPROVALS
of the thesis submitted by
Sarah Nichole Bruce
Thesis Title: The Assignment Packet Grading System Date of Final Oral Examination: 20 March 2013
The following individuals read and discussed the thesis submitted by student Sarah Nichole Bruce, and they evaluated her presentation and response to questions during the final oral examination. They found that the student passed the final oral examination. Laurie Cavey, Ph.D. Chair, Supervisory Committee
Margaret Kinzel, Ph.D. Member, Supervisory Committee Mary Jarratt-Smith, Ph.D. Member, Supervisory Committee
iv
v
vi
The Assignment Packet Grading System is a form of choice-based learning that may be a valuable strategy to increase both motivation in students and their self-efficacy, which in return could result in higher levels of student achievement. The study was of an experimental design, carried out in Geometry classes at the high school level. Data were gathered regarding students’ mathematics self-efficacy and their academic achievement for two groups: one using the Assignment Packet Grading System and the other using a traditional classroom grading system.
The analysis of the data gathered in the study did not show a statistically significant difference between the self-efficacy of students who experienced the Assignment Packet Grading System versus students who experienced the traditional grading system. Furthermore, the analysis of the data gathered in the study did not show a statistically significant difference in the overall academic achievement between
vii
DEDICATION ... iv
ACKNOWLEDGEMENTS ... v
ABSTRACT ... vi
LIST OF TABLES ... ix
CHAPTER ONE: INTRODUCTION ... 1
CHAPTER TWO: LITERATURE REVIEW ... 5
Motivation and Self-Efficacy ... 5
Self-Efficacy and Mathematics ... 7
Influence of Choice-Based Learning on Attitude and Academic Achievement ... 9
Influence of Choice-Based Learning on Motivation ... 11
Influence of Choice-Based Learning on Academic Performance ... 12
Choice-Based Learning and the Need for Further Research ... 12
CHAPTER THREE: METHODOLOGY ... 14
Details of the Assignment Packet Grading System ... 14
Participants and the Experimental Conditions ... 16
Procedure and Data Analysis ... 19
CHAPTER FOUR: RESULTS ... 20
ATMI Survey ... 20
viii
Self-Efficacy ... 27
Academic Achievement ... 28
Implications... 29
Limitations ... 30
Recommendations for Further Research ... 31
REFERENCES ... 33
APPENDIX A ... 35
Attitude Toward Mathematics Inventory ... 35
APPENDIX B ... 38
ix
CHAPTER ONE: INTRODUCTION
“In preparing our youth for tomorrow, one of our preoccupations should be in helping them learn to make effective, responsible, intelligent choices” (Rice, 2005, p. 39). During my first years teaching mathematics at the high school level, I became more and more frustrated with the lack of motivation and ownership from some of my students in terms of completing assignments. Coupled with my frustration was the feeling of
disappointment when talking to parents about their child’s grade. It was irritating to hear parents come up with excuse after excuse for why their children were not doing daily assignments.
As educators at the high school level, it is our primary goal to prepare students to be college and career ready. We need to prepare them to be successful adults and
contributing citizens in the democratic society in which they are soon to be an integral part. It is our responsibility to teach them the importance of making meaningful choices that are not only in their best interest, but also in the best interest of the community.
My frustrations, beliefs about choice-based learning, and Kathie Nunley’s book (2003) led me to restructure my grading system. Nunley (2003), an educational
Curriculum idea to fit the structure of my classroom and designed what I now call the Assignment Packet Grading System. I established this grading system with the idea that giving students a choice in my class will allow them to take ownership of their grade and therefore increase internal motivation and self-regulation. I wanted my students to be responsible for monitoring their own progress. I also hoped to see my students’ grades increase and experience more pleasant parent-teacher conferences as a side effect.
Listening to students talk about the Assignment Packet Grading System, I started to realize another factor that seemed to influence the success of the grading system: self-efficacy. Self-efficacy is one’s beliefs about the capability of succeeding on specific tasks. Students showed more positive thinking and attitudes with the Assignment Packet Grading System. I suspected that it was because they no longer had the stress or the fear of receiving bad grades on the daily assignments that are supposed to be “practice” problems. Because the Assignment Packets are not graded based on the number of correct answers, students could complete assignments without becoming overwhelmed by
feelings of failure. The assignments started becoming positive learning experiences rather than bad experiences. The Assignment Packet Grading System may allow students an opportunity to build self-efficacy on specific tasks without the risk of earning bad grades; increased self-efficacy may lead to increased effort. The Assignment Packet Grading System follows the ideas of researchers that building on past performance plays an integral role in success on future tasks.
1. What impact does the Assignment Packet Grading System have on the self-efficacy of Geometry students?
CHAPTER TWO: LITERATURE REVIEW
Students develop a commitment to their own learning when they are allowed to participate in determining aspects of their education (Gutmann, 1987). Gutmann also noted that students generally learn best when they have a prior commitment to what they are required to learn. A participatory approach may be considered more democratic than a disciplinary approach by building on students’ interests and by eliciting their
commitment to learning. According to Gutmann (1987), “Participatory approaches aim to increase students’ commitment to learning by building upon and extending their existing interests in intellectually productive ways” (p. 89).
This literature review is a compilation of mostly primary sources in relation to choice-based learning and self-efficacy in the classroom. The studies involved
participants at both high school and college levels in a variety of subject areas, and were designed to determine the impact of choice-based learning and self-efficacy on attitude, motivation, and academic achievement and performance.
Motivation and Self-Efficacy
make choices based on personal interests. To be successful upon graduation, students need to be taught how to deal with situations in which their input and decisions affect outcomes (Hayward & Lewis, 2003). Choice-based learning may be a better, more motivating option for students. Choice-based learning can involve different types of academic choices such as: goal choices, assignment choices, choice of instructional support within assignments, and reward choices (von Mizener & Williams, 2009).
The research summarized in this section addressed the question of whether choice-based learning is a strategy that increases both motivation in students and their self-efficacy, which, in turn, could impact student achievement, with an emphasis on mathematics. The research presented is focused on assignment choices in which students are given the opportunity to select a task of their choice from an offered set of tasks provided by the teacher.
Motivation and self-efficacy are the driving forces behind choice-based learning. If students are motivated, they are naturally going to show higher levels of interest, which may lead to higher achievement. Self-efficacy is one’s beliefs about the capability of succeeding on specific tasks. Students’ self-efficacy is a strong influence on motivation and behavior (Kranzler & Pajares, 1995). When students experience success they develop higher self-efficacy and believe in their abilities, whereas students with low self-efficacy perceive themselves as having limited abilities and being unsuccessful (Hunt &
Schunk and Pajares (2009) also note that when students associate their capabilities with negative thoughts and fears, those emotions lower self-efficacy and trigger additional stress that warrant the poor performance they fear; hence, reducing these negative
emotional states is one way to raise self-efficacy. In new learning situations, students are prone to possess lower levels of self-efficacy because they initially lack the skills to perform certain tasks, but as they successfully acquire the skills specific to the task their self-efficacy should increase (Schunk & Pajares, 2009). According to Kranzler and Pajares (1995), “a high sense of efficacy may serve students well when solving math problems, not because it ‘causes’ them to be better problem solvers, but because it engenders greater interest in and attention to working the problems, increased effort, and greater perseverance in the face of adversity” (p. 427).
Self-efficacy, attitude, and motivation are the unifying themes among the research of choice-based learning and student achievement. Most of the research calls for the need of more research to better relate the themes of self-efficacy, attitude, motivation, and behavior to student achievement. The research is not exclusively conducted in mathematical settings, but rather conducted in a variety of subject areas and settings. Most of the research implies that the specific subject area in which the research was conducted is not the deciding factor in the validity of the results across other subjects; the researchers suggest that the results would apply to most subject areas and levels of
instructional settings.
Self-Efficacy and Mathematics
levels of self-efficacy and motivation may, in turn, lead to higher student achievement. Furthermore, Betz and Hackett (1989) state that “mathematics self-efficacy can be distinguished from other measures of attitudes toward mathematics in that mathematics self-efficacy is a situational or problem-specific assessment of an individual’s confidence in her or his ability to successfully perform or accomplish a particular task or problem”(p. 262). Choice-based assignments could give those students the opportunity to have initial confidence in a task because they are able to choose one in which they feel the ability to succeed. According to the research of Schunk and Pajares (2009), students naturally have initial low levels of self-efficacy with new tasks.
Past performances on tasks also play a key role in students’ beliefs about the capability of succeeding on future tasks. Future academic success can be predicted by self-efficacy perception, perceptions that are created based on the students’ reflections of past performances and ability (Kranzler & Pajares, 1995). For low-efficacy students, having control of their environment is one factor in raising their levels of self-efficacy and confidence, which potentially leads to increased motivation (Hunt & Wiseman, 2008). Lent and Lopez (1992) conducted a study of 50 juniors to determine the sources of mathematics self-efficacy at the high school level. They found that past performance accomplishments were the most influential source of mathematics self-efficacy among high school children and that high school students’ mathematics self-efficacy is largely drawn upon past math-related performance (Lent & Lopez, 1992).
related to performance. Overall, they found indication of a moderately strong positive relationship between self-efficacy and performance, although not as large as they hypothesized (Betz & Hackett, 1989). In the study by Lent and Lopez (1992) of high school math students, it was found that mathematics self-efficacy related significantly to actual math course grades. Kranzler and Pajares (1995) conducted research that focused on determining whether or not academic performance in mathematics relies solely on general mental ability or if mathematics self-efficacy also effects academic performance. The study consisted of a total of 329 high school students in grades 9 through 12. Their results showed that students’ mathematics self-efficacy had strong direct effects on problem-solving performance even when general mental ability was controlled (Kranzler & Pajares, 1995). The characteristics of choice-based learning are common to the
characteristics of high self-efficacy and self-efficacy is a definite predictor of mathematical performance.
Influence of Choice-Based Learning on Attitude and Academic Achievement Some research of students and education, mathematics specific or not, addressed the correlation of attitude and motivation to student achievement. Although Betz and Hackett’s (1989) study of undergraduate university students found a slightly stronger relationship between mathematics attitudes and mathematics self-efficacy than between mathematics attitudes and performance, a positive correlation between attitude and
(1996) proposes an interactive relationship between empowerment and learning. The more empowered students feel, the more they learn and vice-versa. Empowerment directly affects attitude because it produces feelings for students that what they are doing is worthwhile and important (Frymier, 1996).
Salk, Glaessner, and Stodolsky (1991) researched student views about learning math and social studies. A total of 60 fifth-grade students were interviewed over a two-year period. Concerning mathematics, the students expressed strong feelings about learning and their own competence; they characterized bad math experiences by anxiety, shame, and inadequacy (Salk et al., 1991). In the interviews students described typical mathematics classroom activity as everyone doing practice problems from the textbook in the form of seat-work (Salk et al., 1991). The student interviews showed consistency in how students felt at times when they disliked mathematics: feelings of difficulty, failure, frustration, and anxiety (Salk et al., 1991).
interpret mathematics in terms of their ability to do it; positive experiences are largely characterized by success (Salk et al., 1991).
Influence of Choice-Based Learning on Motivation
According to Hunt and Wiseman (2008), “motivation is an internal state that arouses students to action, directs them to certain behaviors, and assists them in
Influence of Choice-Based Learning on Academic Performance Further research by Stenhoff, Davey, and Lignugaris-Kraft (2008) focused on linking choice-based learning to academic performance. Their study involved a 15-year-old male student that had been identified as having a learning disability. The study took place in a resource biology class in which all of the students in the class had learning disabilities or behavior disorders (Stenhoff et al., 2008). Again, data were collected during both choice and no-choice conditions. In the choice condition, the student’s productivity and performance levels were substantially higher and he showed an increase in academic achievement (Stenhoff et al., 2008).
Although the previous research study involved a student with a learning disability, in von Mizener and Williams’ (2009) review of research concerning the effects of student choice on academic performance, they found that most studies included general education students. On the contrary, they do question the generalization of the success rate for choice-based learning to include general education students; only 12% of general education students showed a positive correlation between choice-based learning and academic performance, whereas 80% of special needs students showed a positive
correlation. von Mizener and Williams (2009) also found that of four studies that reported greater student satisfaction with choice-based learning, only one study actually showed increased student performance.
Choice-Based Learning and the Need for Further Research
In conclusion, research is beginning to focus on a correlation between choice-based learning and student achievement, and some evidence does show a positive
of choice-based learning and student achievement concerning self-efficacy, attitude and motivation: the continual call for more research to fill in the gaps of the current research. von Mizener and Williams (2009) found in their review of research concerning these areas that the effect of choice-based learning on high-stakes outcomes has never actually been evaluated. Stenhoff et al. (2008) suggested the need for replications of their study with a wider variety of subjects and in different settings before assuming similar
outcomes across the board. Betz and Hackett (1989) imply that further research needs to focus on the exact nature of the correspondence between mathematics self-efficacy and mathematics performance.
The research described here was designed to help close the research gap,
CHAPTER THREE: METHODOLOGY
Details of the Assignment Packet Grading System
The Assignment Packet Grading System is a form of choice-based learning. In a choice-based learning model, students are free to choose from given academic choices. The Assignment Packet Grading System is designed to determine student grades on one or two parts, depending on the option that they choose. It is on a chapter-to-chapter basis, so a student could choose one option for one chapter and the other option for the next. The daily format of my class resembles a traditional mathematics classroom; I teach the lesson, I give an assignment, students have the rest of the class time to work on the assignment, what is not finished should be taken home as homework, and assignments are corrected at the beginning of class the following day. The difference is that each student has the choice of whether or not to complete the daily assignment. If they complete the assignment, they are responsible for correcting their own assignment the next day. They are also responsible for asking questions on problems missed to ensure understanding.
Rather than turning the assignments in to me each day as in a traditional
the chapter test. Overall grades for those students who turned in an Assignment Packet are calculated as the average of their Assignment Packet grade and their test grade. The packets are graded based on the completion of each problem assigned, not on correct or incorrect answers. If students show their work and give an honest effort on every problem assigned, whether correct or not, they will receive full points for the Assignment Packet. This ideally eliminates the temptation to cheat when grading their own assignments because students can still receive full points on the Assignment Packet without getting all, or any, of the problems correct. Overall grades for those students who chose not to complete or to turn in an Assignment Packet are calculated as the grade they received on the chapter test. When grades are calculated after each chapter test, I give each student a grade summary, showing each individual student how his choice of either turning in an Assignment Packet or not affected his grade. The summary also shows students what their grade would have been if they had chosen the other option, whether that was to turn in a packet or not.
Ideally educators, me included, would like to believe that students, if given the opportunity, would make choices that would positively impact their academic
achievement and/or their grade. Realistically, and in practice, there are some high school students that, in fact, may not be motivated by grades and/or academic achievement. If given the choice, they will choose to do nothing, with no regard to the impact this choice has on their learning and/or grade. For these cases, I created a “safety net” in the
whether or not to turn in Assignment Packets until they have raised their grade back above a 70%. For these students, I call the parents and explain the situation in hopes of working jointly at encouraging the student to raise their grade. I also more closely
monitor these students on a daily basis until they raise their grade above a 70%. Once the student raises their course grade back above a 70%, the student is again granted the choice of whether or not to turn in Assignment Packets.
Participants and the Experimental Conditions
This study was designed to examine the effects of the use of the Assignment Packet Grading System on students’ mathematics self-efficacy and academic
achievement in Geometry at a rural high school in Idaho, which will be referred to as Bruce High School. The Geometry classes were chosen because of scheduling convenience between the researching instructor and the cooperating control group instructor. The study was that of a quasi-experimental design. The sampling procedure was one of convenience and only random in the respect that the researching instructor, also the scheduled instructor for the course, did not choose which students would be in the Geometry classes; students were assigned to Geometry classes by the school counselors.
lecture-based strategy. Both instructors covered the same concepts and gave the same assignments, worksheets, and chapter tests.
The treatment group consisted of 9 students, 2 male and 7 female, out of a class of 30 students total, in a Geometry course taught by the researching instructor. Mean scores from the curriculum-based post-test were used to compare the treatment class as a whole to the research participants in the treatment group; according to the means, the treatment group research participants were academically similar to the treatment class as a whole. To additionally determine if the research participants represented the treatment class as a whole, percentages of the number of students who turned in an assignment packet were compared between the treatment class as a whole and the specific group of research participants within the treatment class; the percentages of turned in packets show that the specific group of research participants consistently turned in their packets at a higher percentage rate across the three chapters of the study than the treatment class as a whole. Furthermore, these participants also consistently turned in complete assignment packets at a higher percentage rate than the treatment class as a whole for all three chapters of the study. Therefore, the research participants in the treatment group represented the more high achieving and motivated students within the treatment class as a whole.
representative of the control class as a whole. The research participants in the control group represented the more high achieving students within the control class as a whole.
Students’ mathematics self-efficacy was measured using the Attitude Toward Mathematics Inventory. Developed to measure students’ attitudes about mathematics, Tapia and Marsh (2000) found the Psychometric properties of the survey sound and recommended the survey for use in the investigation of students’ attitudes toward mathematics with a reliability coefficient of 0.95. The ATMI survey and an objective curriculum-based assessment were given to both the control and treatment groups the first week of school and then again after the completion of the third chapter of the textbook, fifteen weeks into the semester. The pre-test was a multiple-choice objective curriculum-based assessment that addressed concepts to be taught during the data collection period. The post-test was also a multiple choice objective curriculum-based assessment, but it addressed the concepts taught during the data collection period in more depth than that of the pre-test. Both groups were given the same tests on the same days throughout the data collection period.
This experiment measured students’ self-efficacy and academic achievement in Geometry using the ATMI and objective curriculum-based assessments at the beginning of the school year and again at the conclusion of Chapter 3 to compare scores between those students who experienced the Assignment Packet Grading System and those who experienced the traditional grading system. The data were analyzed to answer the posed research questions:
2. What impact did the Assignment Packet Grading System have on student achievement in Geometry?
Procedure and Data Analysis
The independent variable, or intervention, was the Assignment Packet Grading System and the dependent variable was the performance on the pre-test and post-test of both the Attitude Toward Mathematics Inventory (ATMI) survey and the objective curriculum-based assessment. The control comparison group was a traditionally structured mathematics classroom grading system. Using a quantitative research approach, both the ATMI survey and the objective curriculum-based assessments were scored: a one to five Likert scale for the ATMI and traditional point scoring method for the curriculum-based assessments. Means, standard deviations, and two-tailed
homoscedastic t-tests of means were used to analyze the data to determine if exposure to the Assignment Packet Grading System had an impact on students’ mathematics self-efficacy and academic achievement in Geometry.
CHAPTER FOUR: RESULTS
The experiment was completed within the first semester at Bruce High School. There were no class changes during the data collection period for the participants from which data was collected. All data used in this experiment was paired; each participant had a score from the initial ATMI, final ATMI, objective curriculum-based pre-test, and objective curriculum-based post-test. Neither the control group nor treatment group had any special qualifications above the normal pre-requisites for placement into a general education Geometry course, meaning each of the classes should be relatively similar to general education Geometry classes in other rural school districts in Idaho. Data gathered from the experiment were analyzed in order to answer the following questions:
1. What impact did the Assignment Packet Grading System have on the self-efficacy of Geometry students?
2. What impact did the Assignment Packet Grading System have on student achievement in Geometry?
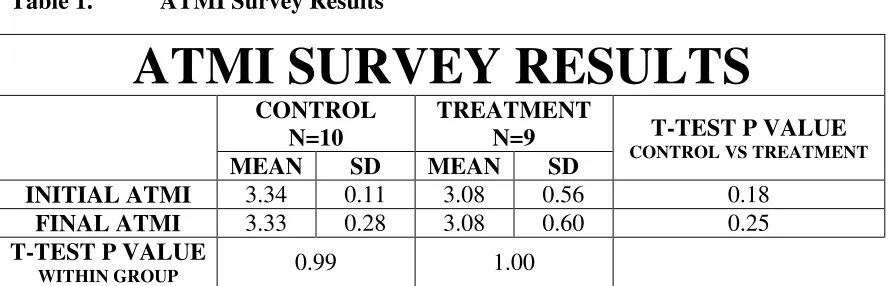
ATMI Survey
standard deviations and t-tests were calculated. The following table shows those calculated values.
Table 1. ATMI Survey Results
ATMI SURVEY RESULTS
CONTROL N=10
TREATMENT
N=9 T-TEST P VALUE
CONTROL VS TREATMENT
MEAN SD MEAN SD
INITIAL ATMI 3.34 0.11 3.08 0.56 0.18
FINAL ATMI 3.33 0.28 3.08 0.60 0.25
T-TEST P VALUE
WITHIN GROUP 0.99 1.00
The ATMI was scored using a Likert scale where 1=Strongly Disagree and 5=Strongly Agree
Results of the t-test of means from the initial ATMI survey indicate no
statistically significant difference between the control group and the treatment group, concluding that the students in the two groups had equivalent self-efficacy toward mathematics at the beginning of the experiment. Even though the treatment group had a lower mean score on the initial ATMI than the control group, with such small numbers of participants this difference is not statistically significant.
The mean of the control group’s final ATMI is 0.01 less than the mean of the initial ATMI. With a t-test p value of 0.99, this difference is not statistically significant at the p<.05 level. The mean of the treatment group’s final ATMI is equal to the mean of the initial ATMI, which is obviously insignificant and results in a t-test p value of 1.00. When comparing the mean between the two groups on the final ATMI, the p value from the t-test of means is 0.25, which is also statistically insignificant at the p<.05 level. Even though the research participants in both groups were among the higher achieving
System did not harm or improve the attitudes toward mathematics of students in the treatment group.
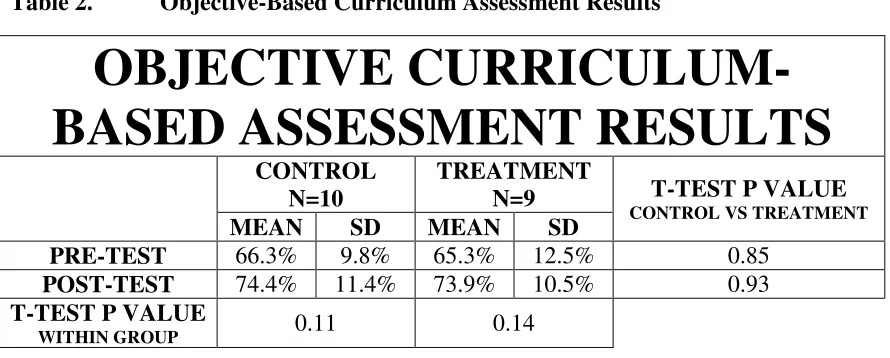
Objective Curriculum-Based Assessments
The objective curriculum-based pre-test was given to both the control group and treatment group the first week of school. The post-test was given after the completion of the third chapter of the textbook, at the end of the data collection period. The means, standard deviations, and t-tests were calculated using Microsoft Excel. The following table shows those calculated values.
Table 2. Objective-Based Curriculum Assessment Results
OBJECTIVE
CURRICULUM-BASED ASSESSMENT RESULTS
CONTROL N=10
TREATMENT
N=9 T-TEST P VALUE
CONTROL VS TREATMENT
MEAN SD MEAN SD
PRE-TEST 66.3% 9.8% 65.3% 12.5% 0.85
POST-TEST 74.4% 11.4% 73.9% 10.5% 0.93
T-TEST P VALUE
WITHIN GROUP 0.11 0.14
Within the control group, the mean of the objective curriculum-based post-test was 8.1% higher than the mean of the pre-test. With a t-test p value of 0.11, this difference is not statistically significant at the p<.05 level. Within the treatment group, the mean of the objective curriculum-based post-test was 8.6% higher than the mean of the pre-test. With a t-test p value of 0.14, this difference is also not statistically significant at the p<.05 level. When comparing the means between the two groups on the post-test, the p value from the t-test of means is 0.93, which is again statistically insignificant. Again, it should be noted that both groups had a small number of research participants, which directly affects results of data analysis. Even with a small number of research participants, overall, the results of the curriculum-based tests showed neither a positive or negative impact on students’ academic achievement. So experiencing the Assignment Packet Grading System did not harm the academic achievement of students in the treatment group.
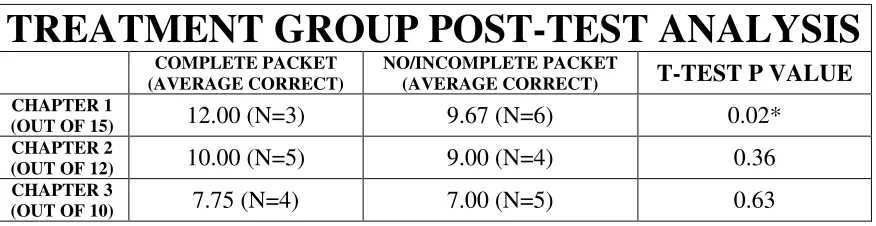
Additional analyses were used within the treatment group to determine the impact of the Assignment Packet Grading System on achievement for each of the content areas covered, coinciding with each chapter. The t-test of means was calculated within the treatment group for each individual chapter of content on the objective curriculum-based post-test for those students who chose to complete an Assignment Packet versus those students who chose not to do so.
was also categorized by chapter for this analysis; fifteen questions from Chapter One, twelve questions from Chapter Two, and ten questions from Chapter Three.
Of the 30 students in the treatment class, 19 students turned in an assignment packet for Chapter One, 14 students turned in an assignment packet for Chapter Two, and 18 students turned in an assignment packet for Chapter Three. With t-test p values of 0.16, 0.23, and 0.20 for Chapter One, Chapter Two, and Chapter Three, respectively, there was no statistical significance at the p<.05 level between the number of correct problems on the objective curriculum-based post-test correlating to each chapter for students in the treatment group who chose to turn in the assignment packet and those students who did not for each chapter. The research participants accounted for 7 of the 19 Chapter One assignment packets turned in, 6 of the 14 Chapter Two assignment packets turned in, and 6 of the 18 Chapter Three assignment packets turned in.
packet at all for Chapter One and averaged 9.67 questions correct out of 15 questions that correlated to Chapter One content.
Table 3. Treatment Group Post-Test Analysis
TREATMENT GROUP POST-TEST ANALYSIS
COMPLETE PACKET (AVERAGE CORRECT)
NO/INCOMPLETE PACKET
(AVERAGE CORRECT) T-TEST P VALUE
CHAPTER 1
(OUT OF 15) 12.00 (N=3) 9.67 (N=6) 0.02*
CHAPTER 2
(OUT OF 12) 10.00 (N=5) 9.00 (N=4) 0.36
CHAPTER 3
(OUT OF 10) 7.75 (N=4) 7.00 (N=5) 0.63
*Statistically significant at the p<.05 level.
The only statistically significant difference was with the average number of correct responses on the post-test that correlated with Chapter One. The t-test p value for the Chapter One comparison was 0.02, which is significant at the p<.05 level. It should be noted that of the total number of complete assignment packets turned in within the treatment class as a whole, 3 of the 10 complete assignment packets for Chapter One were from the research participants, 5 of the 10 complete assignment packets for Chapter Two were from the research participants, and 4 of the 7 complete assignment packets for Chapter Three were from the research participants. The research participants turned in complete assignment packets at a higher percentage rate than the treatment class as a whole, except in the case of Chapter One, where the percentage rate of complete
assignment packets turned in was equivalent between those students that participated in the research and those that did not.
CHAPTER FIVE: DISCUSSION
Self-Efficacy
Although the analysis showed there was no statistically significant difference found between the self-efficacy of the treatment group and the control group at Bruce High School, as an experienced teacher who has used both systems I still believe the Assignment Packet Grading System impacts students’ self-efficacy on some level. As a teacher who prefers the Assignment Packet Grading System over traditional grading, I am pleased to know that my system does not negatively impact students’ self-efficacy and academic achievement. From my experiences as a teacher and my knowledge as a researcher, the need for further research is evident to me. It would be valuable to gather not only more quantitative data but also to gather qualitative data from students that experience the Assignment Packet Grading System. In talking with students in my classes, this qualitative data would be necessary to enhance further research.
they really are because of this system; some have realized that they need to complete the assignments in a structured fashion like a packet in order to make sure they have
mastered the content, while other students realize that they do not need to do all of the suggested problems to be able to master the content. This system is a great way for students to discover what type of learner they are without too much of a risk, and then make future academic choices based on that gained knowledge about themselves as a student. My experiences resonate with what Hunt and Wiseman (2008) found in their research, that allowing students to have control raises their self-efficacy and confidence.
Academic Achievement
not impair their academic achievement. Again, as researching instructor, I believe it would be beneficial to conduct further research with larger groups, using longer
timelines, and across a variety of mathematics curriculums. With such a small number of research participants, it is difficult to derive definitive conclusions about the effects of this particular method of choice-based learning on academic achievement. Either way, this form of choice-based learning is a participatory approach that, according to Gutmann (1987), may be considered more democratic than a disciplinary approach by building on students’ interests and by eliciting their commitment to learning.
Implications
As an experienced teacher and researching instructor who developed the Assignment Packet Grading System, I do not believe that one grading system fits the needs of all students and teachers, especially across various subjects. Although this study does not show an overall positive impact on students’ self-efficacy and academic
achievement when students experience the Assignment Packet Grading System, it does not show a negative impact either, meaning this grading system is as valid as the
traditional grading system. Since the Assignment Packet Grading System is a method that does not harm students, it is a method teachers can use to help students discover their learning style. The Assignment Packet Grading System is an alternative grading system that teachers can use without worry.
The system also allows teachers to use classroom time more efficiently because there is not that never-ending pile of daily assignments that need to be passed back to students. As a teacher that uses this system, I enjoy watching and helping students complete mathematics problems because they are trying to master the content rather than just simply doing the problems on the assignment because they are required to do so. Furthermore, as a teacher that has used this system for several years, I also treasure the power this method can have to help students and parents clearly see the direct
relationship between completing assignments and higher test scores. When conferencing with students and parents, this method makes it easier to look down the progress report and see that relationship. This system is a powerful method to help students realize, on their own, the importance of practicing mathematics problems to achieve mastery of content.
Limitations
Another limitation of this experiment was the length of the data collection period. Data was collected over the course of one semester, but collecting over the course of a full academic school year would have provided more quantitative data to analyze and possibly provided a more conclusive analysis of self-efficacy and academic achievement. Extending the data collection period would have also provided the chance to see more fluctuations in student scores throughout the year and therefore get a better representation of how students perform with this system. It may also have been valuable to collect data from students enrolled in other mathematics courses, but again not as feasible in
educational research. In any event, using more measures for data collection may have resulted in more conclusive data.
Recommendations for Further Research
In future research, attempting to link forms of choice-based learning to students’ mathematics self-efficacy and academic achievement, a combination of both quantitative and qualitative methods would be beneficial and possibly provide more useful results. As the classroom teacher, it is important to hear the students express their opinions about the Assignment Packet Grading System and whether they feel it impacts their learning and motivation. Adding this qualitative aspect to a research study attempting to link choice-based learning to mathematics self-efficacy would be essential.
qualitative instrument of measurement for parents could be valuable in assessing effects of choice-based learning with high school students.
Since the foundation of choice-based learning is to democratically help our students become successful and contributing citizens who understand the influence of making positive choices it would prove beneficial to evaluate whether or not using choice-based learning in high school carries over to the success of a student after graduation. This would require a long-term study that follows particular students
throughout high school and then into their college career or into the work force. This type of study would be time-consuming and intricate, involving both qualitative and
REFERENCES
Betz, N. E., & Hackett, G. (1989). An exploration of the mathematics
self-efficacy/mathematics performance correspondence. Journal for Research in Mathematics Education, 20(3), 261-273.
Deci, E.L, & Ryan, R.M. (2009). Promoting self-determined school engagement: motivation, learning, and well-being. In K. R. Wentzel & A. Wigfield (Eds.).
Handbook of motivation at school. New York: Routledge.
Frymier, A. B. (1996). The development of a learner empowerment measure.
Communication Education, 45(3), 181-99.
Gutmann, A. (1987). Democratic education. Princeton, N.J: Princeton University Press.
Hayward, P. A., & Lewis, L. K. (2003). Choice-based learning: student reactions in an undergraduate organizational communication course. Communication Education, 52(2), 148.
Hunt, G., & Wiseman, D. (2008). Best practice in motivation and management in the classroom. Springfield, Ill: Charles C. Thomas.
Kranzler, J., & Pajares, F. (1995). Self-efficacy beliefs and general mental ability in mathematical problem-solving. Contemporary Educational Psychology, 20(4), 426-443.
Nunley, K. F. (2003). A student's brain: The parent/teacher manual. South Jordan, UT: Brains.org.
Rice, J. (2005). Whose education is it anyway? Adolescents and choice. Education Canada, 45(2), 39.
Salk, S., Glaessner, B., & Stodolsky, S. S. (1991). Student views about learning math and social studies. American Educational Research Journal, 28(1), 89-116.
Schunk, D.H. & Pajares, F. (2009). Self-efficacy theory. In K. R. Wentzel & A. Wigfield (Eds.). Handbook of motivation at school. New York: Routledge.
Stenhoff, D. M., Davey, B. J., & Lignugaris-Kraft, B. (2008). The effects of choice on assignment completion and percent correct by a high school student with a learning
disability. Retrieved from The Free Library. http://www.thefreelibrary.com/The effects of choice on assignment completion and percent correct by ...-a0179048724 Tapia, M., & Marsh, G. E., II. (2000, November). Attitudes toward mathematics
instrument: An investigation with middle school students. Paper presented at the Annual Meeting of the Mid-South Educational Research Association, Bowling Green, KY. Retrieved from http://eric.edu.gov (ED449045)
APPENDIX A
ATTITUDE TOWARD MATHEMATICS INVENTORY
Directions: This inventory consists of statements about your attitude toward mathematics. There are no correct or incorrect responses. Read each item carefully.
Please think about how you feel about each item. Place an X in the box that most closely corresponds to how the statements best describes your feelings. Use the following response scale to respond to each item.
PLEASE USE THESE RESPONSE CODES: A – Strongly Disagree B – Disagree
C – Neutral D – Agree
E – Strongly Agree
A B C D E
1. Mathematics is a very worthwhile and necessary subject. 2. I want to develop my mathematical skills.
3. I get a great deal of satisfaction out of solving a mathematics problem. 4. Mathematics helps develop the mind and teaches a person to think. 5. Mathematics is important in everyday life.
6. Mathematics is one of the most important subjects for people to study. 7. High school math courses would be very helpful no matter what I decide to study.
8. I can think of many ways that I use math outside of school. 9. Mathematics is one of my most dreaded subjects.
10. My mind goes blank and I am unable to think clearly when working with mathematics.
11. Studying mathematics makes me feel nervous. 12. Mathematics makes me feel uncomfortable. 13. I am always under a terrible strain in a math class.
14. When I hear the word mathematics, I have a feeling of dislike.
15. It makes me nervous to even think about having to do a mathematics problem. 16. Mathematics does not scare me at all.
17. I have a lot of self-confidence when it comes to mathematics
18. I am able to solve mathematics problems without too much difficulty. 19. I expect to do fairly well in any math class I take.
20. I am always confused in my mathematics class.
21. I feel a sense of insecurity when attempting mathematics. 22. I learn mathematics easily.
23. I am confident that I could learn advanced mathematics. 24. I have usually enjoyed studying mathematics in school. 25. Mathematics is dull and boring.
26. I like to solve new problems in mathematics.
28. I would like to avoid using mathematics in college. 29. I really like mathematics.
30. I am happier in a math class than in any other class. 31. Mathematics is a very interesting subject.
32. I am willing to take more than the required amount of mathematics. 33. I plan to take as much mathematics as I can during my education. 34. The challenge of math appeals to me.
35. I think studying advanced mathematics is useful.
36. I believe studying math helps me with problem solving in other areas. 37. I am comfortable expressing my own ideas on how to look for solutions to a difficult problem in math.
38. I am comfortable answering questions in math class.
39. A strong math background could help me in my professional life. 40. I believe I am good at solving math problems.
APPENDIX B
Multiple Choice
Identify the letter of the choice that best completes the statement or answers the question.
1. Based on the pattern, what are the next two terms of the sequence? 9, 15, 21, 27, . . .
a. 33, 972 b.
2. Based on the pattern, what is the next figure in the sequence?
a. b.
3. Find a counterexample to show that the conjecture is false. Conjecture: Any number that is divisible by 4 is also divisible a. 24 b.
4. Alfred is practicing typing. The first time he tested himself, he could type 23 words per minute. After practicing for a week, he could type 26 words per minute. After two weeks he could type 29 words per minute. Based
able to type after 4 weeks of practice. a. 39 words per minute
b. 29 words per minute
5. Are O, N, and P collinear? If so, name the line on which they lie.
a. No, the three points are not collinear. b. Yes, they lie on the line
c. Yes, they lie on the line d. Yes, they lie on the line
M N O P GEOMETRY PRE-TEST
Identify the letter of the choice that best completes the statement or answers the question.
Based on the pattern, what are the next two terms of the sequence? 39, 45 c. 162, 972 d. 33, 39 Based on the pattern, what is the next figure in the sequence?
c. d.
Find a counterexample to show that the conjecture is false.
Conjecture: Any number that is divisible by 4 is also divisible by 8. 40 c. 12 d. 26
Alfred is practicing typing. The first time he tested himself, he could type 23 words per minute. After practicing for a week, he could type 26 words per minute. After two weeks he could type 29 words per minute. Based on this pattern, predict how fast Alfred will be able to type after 4 weeks of practice.
c. 35 words per minute d. 32 words per minute collinear? If so, name the line on which they lie.
No, the three points are not collinear. Yes, they lie on the line MP.
Yes, they lie on the line NP. Yes, they lie on the line MO.
Identify the letter of the choice that best completes the statement or answers the question.
33, 39
Alfred is practicing typing. The first time he tested himself, he could type 23 words per minute. After practicing for a week, he could type 26 words per minute. After two weeks
6. Name the plane represented by the front of the box.
a. FBC b.
7. Name the ray that is opposite
a. b.
8. Name the three labeled segments that are parallel to
a. , , b.
9. Find AC.
a. 14 b.
10. Which point is the midpoint of
a. D b.
A B C D –3 –4 –5 –6 –7 –8 –9 –10 A 0 1 0 –1 –2 –3 –4 –5 –6 –7 –8
A B C D
Name the plane represented by the front of the box.
BAD c. FEC d. FKG
Name the ray that is opposite
c. d.
Name the three labeled segments that are parallel to
, , c. , , , d.
15 c. 12 d. 4 Which point is the midpoint of ?
B c. not B, C, or D d. C
0 1 2 3 4 5 6 7 8 9 10
0 –1 –2 –3
B C D
1 2 3 4 5 6 7 8
E D
FKG
11. If and is not to scale.
a. 64 b.
12. Jose wants to put a fence around his rectangular garden. His garden measures 33 feet by 39 feet. The garden has a
does Jose need to enclose the garden and path? a. 120 ft b.
13. Find the area of a rectangle with base 2 yd and height 5 ft. a. 10 yd b.
14. The figure is formed from rectangles. Find the total area. The diagram is not to scale.
a. 104 b. 15. Find
a. 37 b.
8 ft 2 ft
10 ft
1 2 3 4
Drawing not to scale
and , then what is the measure of
12 c. 52 d. 76
Jose wants to put a fence around his rectangular garden. His garden measures 33 feet by 39 feet. The garden has a path around it that is 3 feet wide. How much fencing material does Jose need to enclose the garden and path?
156 ft c. 168 ft d. 84 ft Find the area of a rectangle with base 2 yd and height 5 ft.
30 ft c. 10 ft d. 30 yd
The figure is formed from rectangles. Find the total area. The diagram is not to scale.
36 c. 80 d. 68
143 c. 27 d. 153
2 ft
Drawing not to scale
The diagram
Jose wants to put a fence around his rectangular garden. His garden measures 33 feet by path around it that is 3 feet wide. How much fencing material
84 ft
30 yd
The figure is formed from rectangles. Find the total area. The diagram is not to scale.
16. Find the value of k. The diagram is not to scale.
a. 17 b. 73 c. 118 d. 107
62°
GEOMETRY POST-TEST
Multiple Choice
Identify the letter of the choice that best completes the statement or answers the question.
1. Based on the pattern, what are the next two terms of the sequence? 4, 8, 12, 16, . . .
a. 20, 24 b. 24, 28 c. 20, 256 d. 64, 256
2. May’s Internet Services designs websites. May noticed an increase in her customers over a period of 5 consecutive weeks. Based on the pattern shown in the graph, make a conjecture about the number of customers May will have in the seventh week.
a. May will have 7 customers. c. May will have 11 customers. b. May will have 9 customers. d. May will have 13 customers.
3. Are points B, J, and C collinear or noncollinear?
a. collinear b. Noncollinear c. impossible to tell
N u m b e r o f C u st o m e rs Week
1 2 3 4 5 6 7 8 9 10 x
4. What is the intersection of plane
a. b.
5. Name the ray in the figure.
a. b.
6. Which plane is parallel to plane
a. plane ABDC b.
7. If
drawing is not to scale.
a. x =10, EF = 8, FG = 15 b. x =3, EF = –6, FG = –6
A
E F
What is the intersection of plane TUYX and plane VUYZ?
c. d.
Name the ray in the figure.
c. d.
Which plane is parallel to plane EFHG?
plane ACGE c. plane CDHG d. plane find the values of x, EF, and drawing is not to scale.
= 15 c. x =10, EF = 32, FG = 45 6 d. x =3, EF = 8, FG = 15
B
G
plane BDHF
8. If T is the midpoint of
a. x = 5, ST = 45 b. x = 5, ST = 60
9. If then what are
a. , b. ,
10. bisects
diagram is not to scale.
a. 61 b.
11. Find the distance between points a. 11 b.
12. Find the coordinates of the midpoint of the segment whose endpoints are 10).
a. (7, 6) b.
13. Patrick wants to put a fence around his rectangular garden. His garden measures 31 feet by 43 feet. The garden
material does Patrick need to enclose the garden and path? a. 172 ft b.
S T
9x 4x + 25
is the midpoint of find the values of x and ST. The diagram is not to scale.
c. x = 10, ST = 60 d. x = 10, ST = 45
then what are and The diagram is not to scale.
c. , d. ,
, , . Find diagram is not to scale.
45.75 c. 91.5 d. 66 Find the distance between points P(8, 2) and Q(3, 8) to the nearest tenth.
7.8 c. 61 d. 14.9 Find the coordinates of the midpoint of the segment whose endpoints are
(1, 4) c. (14, 12) d. (2, 8)
Patrick wants to put a fence around his rectangular garden. His garden measures 31 feet by 43 feet. The garden has a path around it that is 3 feet wide. How much fencing material does Patrick need to enclose the garden and path?
124 ft c. 160 ft d. 86 ft
U
4x + 25
. The diagram is not to scale.
The diagram is not to scale.
. The
(3, 8) to the nearest tenth. 14.9
Find the coordinates of the midpoint of the segment whose endpoints are H(8, 2) and K(6, (2, 8)
Patrick wants to put a fence around his rectangular garden. His garden measures 31 feet has a path around it that is 3 feet wide. How much fencing
14. Find the circumference of the circle in terms of π.
a. 156π in. b. 39π in. c. 1521π in. d. 78π in.
15. Find the area of the circle in terms of π.
a. 30π in.2 b. 900π in.2 c. 60π in.2 d. 225π in.2
16. Identify the hypothesis and conclusion of this conditional statement: If two lines intersect at right angles, then the two lines are perpendicular.
a. Hypothesis: The two lines are perpendicular. Conclusion: Two lines intersect at right angles.
b. Hypothesis: Two lines intersect at right angles. Conclusion: The two lines are perpendicular.
c. Hypothesis: The two lines are not perpendicular. Conclusion: Two lines intersect at right angles.
d. Hypothesis: Two lines intersect at right angles. Conclusion: The two lines are not perpendicular.
17. Which choice shows a true conditional with the hypothesis and conclusion identified correctly?
a. Yesterday was Monday if tomorrow is Thursday. Hypothesis: Tomorrow is Thursday.
Conclusion: Yesterday was Monday.
b. If tomorrow is Thursday, then yesterday was Tuesday. Hypothesis: Yesterday was Tuesday.
Conclusion: Tomorrow is not Thursday.
c. If tomorrow is Thursday, then yesterday was Tuesday. Hypothesis: Yesterday was Tuesday.
Conclusion: Tomorrow is Thursday.
d. Yesterday was Tuesday if tomorrow is Thursday. Hypothesis: Tomorrow is Thursday.
Conclusion: Yesterday was Tuesday.
39 in.
18. What is the converse of the following conditional?
If a point is in the first quadrant, then its coordinates are positive. a. If a point is in the first quadrant, then its coordinates are positive.
b. If a point is not in the first quadrant, then the coordinates of the point are not positive. c. If the coordinates of a point are positive, then the point is in the first quadrant. d. If the coordinates of a point are not positive, then the point is not in the first quadrant. 19. Determine whether the conditional and its converse are both true. If both are true,
combine them as a biconditional. If either is false, give a counterexample. If two lines are parallel, they do not intersect.
If two lines do not intersect, they are parallel.
a. One statement is false. If two lines do not intersect, they could be skew.. b. One statement is false. If two lines are parallel, they may intersect twice.
c. Both statements are true. Two lines are parallel if and only if they do not intersect. d. Both statements are true. Two lines are not parallel if and only if they do not intersect. 20. Use the Law of Detachment to draw a conclusion from the two given statements. If two angles are congruent, then they have equal measures.
and are congruent.
a. + = 90 c. is the complement of . b. = d.
21. Use the Law of Syllogism to draw a conclusion from the two given statements. If a number is a multiple of 64,then it is a multiple of 8.
If a number is a multiple of 8, then it is a multiple of 2. a. If a number is a multiple of 64, then it is a multiple of 2. b. The number is a multiple of 2.
c. The number is a multiple of 8.
d. If a number is not a multiple of 2, then the number is not a multiple of 64.
22. Use the Law of Detachment and the Law of Syllogism to draw a conclusion from the three given statements.
If an elephant weighs more than 2,000 pounds, then it weighs more than Jill’s car. If something weighs more than Jill’s car, then it is too heavy for the bridge. Smiley the Elephant weighs 2,150 pounds.
a. Smiley is too heavy for the bridge. b. Smiley weighs more than Jill’s car.
23. Name an angle supplementary to
a. b.
24. The complement of an angle is 25°. What is the measure of the angle? a. 75° b.
25. and are supplementary angles. measure of each angle.
a. b.
26. Find the value of x.
a. –19 b.
(7x – 8)°
(6x + 11)°
Drawing not to scale
Name an angle supplementary to
c. d. The complement of an angle is 25°. What is the measure of the angle?
155° c. 65° d. 165° are supplementary angles. , and
c. d.
.
125 c. 19 d. 55
Drawing not to scale
165°
27. Find the values of x
a. x = 15, y = 17 b. x = 112, y = 68
28. Which angles are corresponding angles?
a. b.
29. Which statement is true?
a. are same b. are same
c. are alternate interior angles. d. are alternate interior angles.
112° 4y°
7x + 7°
Drawing not to scale
x and y.
c. x = 68, y = 112 d. x = 17, y = 15 Which angles are corresponding angles?
c.
d. none of these
Which statement is true?
are same-side angles. are same-side angles.
30. Line r is parallel to line t. Find m 5. The diagram is not to scale.
a. 45 b. 35 c. 135 d. 145
31. Find the value of the variable if and The diagram is not to scale.
a. 1 b. 2 c. 3 d. –2
32. Which lines, if any, can you conclude are parallel given that ? Justify your conclusion with a theorem or postulate.
a. , by the Converse of the Same-Side Interior Angles Theorem b. , by the Converse of the Alternate Interior Angles Theorem c. , by the Converse of the Alternate Interior Angles Theorem d. , by the Converse of the Same-Side Interior Angles Theorem
r
t
7
1 3
2
6 5 4 135°
1 2
3 4
5 6
7 8
l
m
j k
1 2
g
33. Find the values of x, y, and z. The diagram is not to scale.
a. c.
b. d.
34. Classify ABC by its angles, when m A = 32, m B = 85, and m C = 63. a. right b. straight c. obtuse d. acute 35. Find the value of x. The diagram is not to scale.
a. 33 b. 162 c. 147 d. 75 36. Find the missing angle measures. The diagram is not to scale.
a. x = 124, y = 125 c. x = 114, y = 56 b. x = 56, y = 114 d. x = 56, y = 124
38°
56°
19°
x° z° y°
105°
72°
x°
x° y°
124° 65°
37. Find . The diagram is not to scale.
a. 107 b. 117 c. 63 d. 73
A
96°
115° 118°