Study of temperature–growth interactions
of entomopathogenic fungi with potential for control
of
Varroa destructor
(Acari: Mesostigmata) using a
nonlinear model of poikilotherm development
G. Davidson
1, K. Phelps
1, K.D. Sunderland
1, J.K. Pell
2, B.V. Ball
2, K.E. Shaw
2and D. Chandler
1 1Horticulture Research International, Wellesbourne, Warwick, UK, and2IACR Rothamsted, Harpenden, Herts, UK2002⁄302: received 29 July 2002, revised 20 November 2002 and accepted 29 November 2002
A B S T R A C T
G . D A V I D S O N , K . P H E L P S , K . D . S U N D E R L A N D , J . K . P E L L , B . V . B A L L , K . E . S H A W A N D D . C H A N D L E R . 2003.
Aims:
To investigate the thermal biology of entomopathogenic fungi being examined as potential microbial control
agents of
Varroa destructor
, an ectoparasite of the European honey bee
Apis mellifera
.
Methods and Results:
Colony extension rates were measured at three temperatures (20, 30 and 35
C) for 41
isolates of entomopathogenic fungi. All of the isolates grew at 20 and 30
C but only 11 isolates grew at 35
C.
Twenty-two isolates were then selected on the basis of appreciable growth at 30–35
C (the temperature range found
within honey bee colonies) and/or infectivity to
V. destructor
, and their colony extension rates were measured at 10
temperatures (12
Æ
5–35
C). This data were then fitted to Schoolfield
et al
. [J Theor Biol (1981)88:719–731]
re-formulation of the Sharpe and DeMichele [J Theor Biol (1977)64:649–670] model of poikilotherm development.
Overall, this model accounted for 87
Æ
6–93
Æ
9% of the data variance. Eleven isolates exhibited growth above 35
C.
The optimum temperatures for extension rate ranged from 22
Æ
9 to 31
Æ
2
C. Only three isolates exhibited temperature
optima above 30
C. The super-optimum temperatures (temperature above the optimum at which the colony
extension rate was 10% of the maximum rate) ranged from 31
Æ
9 to 43
Æ
2
C.
Conclusions:
The thermal requirements of the isolates examined against
V. destructor
are well matched to the
temperatures in the broodless areas of honey bee colonies, and a proportion of isolates, should also be able to
function within drone brood areas.
Significance and Impact of the Study:
Potential exists for the control of
V. destructor
with entomopathogenic
fungi in honey bee colonies. The methods employed in this study could be utilized in the selection of isolates
for microbial control prior to screening for infectivity and could help in predicting the activity of a fungal control
agent of
V. destructor
under fluctuating temperature conditions.
Keywords:
fungi, microbial control, Schoolfield
et al
. model, Sharpe and DeMichele model, temperature,
Varroa
destructor
, vegetative growth.
I N T R O D U C T I O N
The varroa mite,Varroa destructoris an important ectopar-asite of the European honey bee Apis mellifera(Sammataro
et al. 2000). Varroa destructor originated in Asia but has spread world-wide in recent years and is causing severe damage toA. melliferapopulations. Adult femaleV. destruc-tor feed on the haemolymph of adult bees and pupae and reproduction takes place within sealed brood. During feeding, mites can activate and transmit viral diseases which reduce the life expectancy of the bees and cause the colony
to decline, particularly over winter (Ball 1994a,b). Varroa destructorhas had a major impact in all countries where it has become established. The overwintering mortality of man-aged honey bee colonies in 1996, for example, was estimated to be equivalent to a quarter of the global commercial bee population (Sanford 1996).
At present, V. destructor is controlled with chemical pesticides, but resistance has already been recorded (Hillesheim et al. 1996; Thomas 1997; Elzen et al. 1998; Milani 1999; Anon. 2001) and so there is a need for alternative, sustainable forms of management, including biological control (Chandler et al. 2001). Entomopatho-genic fungi are important natural enemies of Acari (Chandleret al. 2000) and have been shown to be virulent to V. destructor in laboratory experiments with negligible effect on honey bees (Shaw et al. 2002). In laboratory bioassays at 25C/100% R.H., 40 isolates of fungi from six genera (Verticillium, Hirsutella, Paecilomyces, Beauveria, Metarhizium and Tolypocladium) were pathogenic to V. destructor, and some of these may be suitable for development as mycopesticides (Shaw et al. 2002). Low humidity, which is normally a major constraint to fungal infectivity, does not appear to be a limiting factor in this case (Shaw et al. 2002). However, the high temperatures maintained within some areas of the honey bee colony could have a significant impact on mycopesticide activity, because most isolates of entomopathogenic fungi require moderate temperatures (20–30C) for optimum growth and development (Ferron 1978; Burges 1981; Fargues et al. 1997; Vidal et al. 1997).
The temperature relations within honey bee colonies are complex, as honey bees thermoregulate their colonies according to the season and the presence or absence of brood (Seeley and Heinrich 1981). Varroa destructor preferentially reproduces on drone brood, which is located on the periphery of the brood nest and is maintained at 32Æ5–33Æ4C (Le Conte et al. 1990). Temperatures within broodless areas of the colony are around 25C, but vary with ambient conditions (Simpson 1961). If ambient temperatures drop below 18C, honey bees cluster together to reduce heat loss and generate warmth through increased metabolism (Simpson 1961; Seeley and Heinrich 1981; Winston 1987). In temperate regions, the tempera-ture within a broodless winter cluster is normally 20– 30C, with a daily fluctuation of about 5C (Free and Spencer-Booth 1959; Simpson 1961; Butler 1974; Winston 1987). The effectiveness of a cluster increases with its size, and a colony of at least 2000 bees is needed to survive low temperatures (Free and Spencer-Booth 1959; Southwick 1984). For this reason, colonies reduced in size by V. destructor and its associated viral diseases are particularly vulnerable to cold weather. A mycopesticide of V. destructor is therefore likely to be most valuable
when used to control viral incidence in bee stocks prior to overwintering. This would probably entail applications in late summer, as applications in the autumn and winter run the risk of disturbing the honey bee cluster and are best avoided. A thorough understanding of the effects of high temperature on fungal development is therefore necessary to ascertain whether a mycopesticide can be used in the summer.
This paper describes investigations of the thermal biology of isolates of entomopathogenic fungi that are being examined as potential microbial control agents of V. destructor. The objective was to assess the ability of candidate isolates to operate under the temperature conditions in a honey bee colony. This information could be used then to inform the selection of isolates for microbial control. The effect of temperature on fungal development was studied by measuring colony extension on a solid medium at different temperatures. The data were analysed using Sharpe and DeMichele’s (1977) mechanistic model of poikilotherm development [re-parameterized by Schoolfield et al. (1981)].
M A T E R I A L S A N D M E T H O D S
Fungal isolates
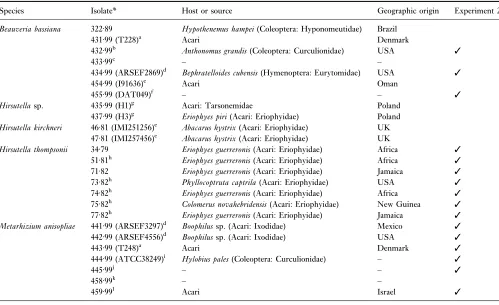
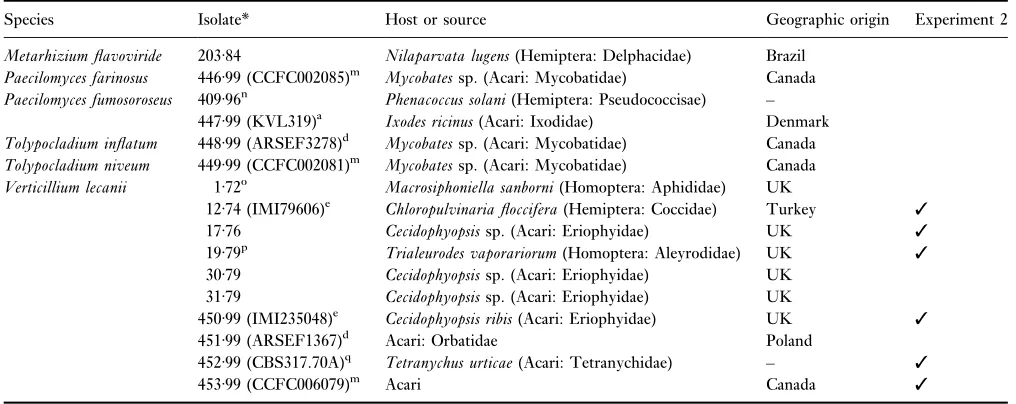
Forty-one isolates of fungi from six genera were used in the study: Beauveria (seven isolates), Hirsutella (11 isolates), Metarhizium (eight isolates), Paecilomyces (three isolates), Tolypocladium (two isolates) and Verticillium (10 isolates) (Table 1). Thirty-four of the isolates have been examined as potential microbial control agents of V. destructor (Shaw et al. 2002), whilst the remainder are awaiting assessment. Stock cultures of the isolates were stored in liquid nitrogen vapour (Chandler 1994). Laboratory cultures were grown on Sabouraud dextrose agar (SDA) slopes and maintained in a refrigerator at 4C for up to 6 months. Subcultures for laboratory experi-ments were prepared on SDA from the slope cultures and incubated at 23 ± 1C for 10–12 days in the dark. Conidia for colony extension experiments were harvested in sterile 0Æ05% Triton X-100 and enumerated using an improved Neubauer haemacytometer. Aliquots (10 ml) were prepared at a concentration of 1·107 ml)1.
Effect of temperature on the colony extension of fungal isolates
appreciable growth at 35 or 30C and/or infectivity to V. destructor (Shaw et al. 2002). The rates of colony extension of these isolates were then measured at 10 temperatures from 12Æ5 to 35C. The method used to measure colony extension was the same for both experi-ments. For each isolate, 100ll of conidial suspension was spread evenly over SDA (15 ml) in Petri dishes (90 mm diameter, triple vented) and incubated in the dark at 23C for 48 h. Plugs (6 mm) cut from these cultures with a flame-sterilized cork borer were then placed upside down in the centre of fresh SDA (15 ml) in Petri dishes (90 mm diameter, triple vented), one plug per dish. The dishes were sealed in polyethylene bags and incubated for 28 days in darkness at the test temperature (incubator temperatures were monitored throughout using data loggers) with two dishes for each isolate·temperature combination. Colony diameters were measured with a ruler every 3–4 days for the duration of the experiment. Experiment 1 was repeated six times and experiment 2 was repeated three times.
Data analysis
The rate of increase of fungal colony radiusrwas used as an indicator of the specific biomass accumulation rate l,
according to dr/dt ¼ lw(Trinci 1971; Cooke and Whipps 1993), wherewrepresents the width of the peripheral growth zone. On a defined medium,wis constant and unaffected by changes in temperature (Trinci 1971; Inch and Trinci 1987) and hence dr/dt can be used to investigate the effect of temperature on l. Mean colony radius was plotted against time for each isolate, temperature and replicate, and colony extension rate was calculated during the linear phase (Fargues et al.1992). Colony extension rates from experiment 1 were compared by ANOVAANOVA(Genstat 2000). In experiment 2, the colony extension rates were averaged across the three replicates and plotted against temperature. The resulting curves were described using the Schoolfield et al. (1981) re-formulation of the Sharpe and DeMichele (1977) model of poikilotherm development. This model was chosen because it has a physical basis and was developed to describe growth processes. The model is based on the hypothesis of Johnson and Lewin (1946) and is derived from the following assump-tions: (1) at all temperatures, the development rate of the organism is determined by a single hypothetical rate-control-ling enzyme, (2) development rate is proportional to the product of the concentration of the active enzyme and its rate constant and (3) the rate-controlling enzyme is reversibly inactivated at high and low temperatures, but a constant total concentration (active + inactive) is maintained independent
Table 1 Fungal isolates used in the study. All isolates were examined in experiment 1 and selected isolates only in experiment 2
Species Isolate* Host or source Geographic origin Experiment 2
Beauveria bassiana 322Æ89 Hypothenemus hampei(Coleoptera: Hyponomeutidae) Brazil
431Æ99 (T228)a Acari Denmark
432Æ99b Anthonomus grandis(Coleoptera: Curculionidae) USA 3
433Æ99c – –
434Æ99 (ARSEF2869)d Bephratelloides cubensis(Hymenoptera: Eurytomidae) USA 3
454Æ99 (I91636)e Acari Oman
455Æ99 (DAT049)f – – 3
Hirsutellasp. 435Æ99 (H1)g Acari: Tarsonemidae Poland
437Æ99 (H3)g Eriophyes piri(Acari: Eriophyidae) Poland Hirsutella kirchneri 46Æ81 (IMI251256)e Abacarus hystrix(Acari: Eriophyidae) UK
47Æ81 (IMI257456)e Abacarus hystrix(Acari: Eriophyidae) UK
Hirsutella thompsonii 34Æ79 Eriophyes guerreronis(Acari: Eriophyidae) Africa 3
51Æ81h Eriophyes guerreronis(Acari: Eriophyidae) Africa 3 71Æ82 Eriophyes guerreronis(Acari: Eriophyidae) Jamaica 3
73Æ82h Phyllocoptruta captrila(Acari: Eriophyidae) USA 3
74Æ82h Eriophyes guerreronis(Acari: Eriophyidae) Africa 3
75Æ82h Colomerus novahebridensis(Acari: Eriophyidae) New Guinea 3
77Æ82h Eriophyes guerreronis(Acari: Eriophyidae) Jamaica 3
Metarhizium anisopliae 441Æ99 (ARSEF3297)d Boophilussp. (Acari: Ixodidae) Mexico 3
442Æ99 (ARSEF4556)d Boophilussp. (Acari: Ixodidae) USA 3
443Æ99 (T248)a Acari Denmark 3
444Æ99 (ATCC38249)i Hylobius pales(Coleoptera: Curculionidae) – 3
445Æ99j – – 3
458Æ99k – –
of temperature. The model consists of a thermodynamic description of the rate-limiting enzymic reaction using Eyring’s (1935) theory combined with terms to describe the inhibitory effects of high and low temperatures (Johnson and Lewin 1946; Hultin 1955). Although the original nomencla-ture is retained, no attempt is made to interpret the coefficients in terms of the reaction processes that determine fungal growth.
The Schoolfieldet al.(1981) model was modified by us to accommodate higher optimum temperatures (303 K: equiva-lent to 30C) than the original (298 K: equivalent to 25C). Following inspection of Arrhenius plots, the model was modified further to exclude low temperature inactivation and to include some coefficients which were specific to isolatei. All coefficients were species-specific. The model for any isolate of a given species that we used is as follows: Table 1 (Contd.)
Species Isolate* Host or source Geographic origin Experiment 2
Metarhizium flavoviride 203Æ84 Nilaparvata lugens(Hemiptera: Delphacidae) Brazil Paecilomyces farinosus 446Æ99 (CCFC002085)m Mycobatessp. (Acari: Mycobatidae) Canada Paecilomyces fumosoroseus 409Æ96n Phenacoccus solani(Hemiptera: Pseudococcisae) –
447Æ99 (KVL319)a Ixodes ricinus(Acari: Ixodidae) Denmark Tolypocladium inflatum 448Æ99 (ARSEF3278)d Mycobatessp. (Acari: Mycobatidae) Canada Tolypocladium niveum 449Æ99 (CCFC002081)m Mycobatessp. (Acari: Mycobatidae) Canada Verticillium lecanii 1Æ72o Macrosiphoniella sanborni(Homoptera: Aphididae) UK
12Æ74 (IMI79606)e Chloropulvinaria floccifera(Hemiptera: Coccidae) Turkey 3
17Æ76 Cecidophyopsissp. (Acari: Eriophyidae) UK 3
19Æ79p Trialeurodes vaporariorum(Homoptera: Aleyrodidae) UK 3
30Æ79 Cecidophyopsissp. (Acari: Eriophyidae) UK 31Æ79 Cecidophyopsissp. (Acari: Eriophyidae) UK
450Æ99 (IMI235048)e Cecidophyopsis ribis(Acari: Eriophyidae) UK 3
451Æ99 (ARSEF1367)d Acari: Orbatidae Poland
452Æ99 (CBS317.70A)q Tetranychus urticae(Acari: Tetranychidae) – 3
453Æ99 (CCFC006079)m Acari Canada 3
All isolates have been tested againstV. destructor(Shawet al.2002), with the exception ofB. bassiana322Æ89, 454Æ99, 455Æ99,M. anisopliae458Æ99, 459Æ99,M. flavoviride203Æ84 andV. lecanii12Æ74.
*Isolate number in the Horticulture Research International culture collection (isolate number from culture collection of origin). aKindly supplied by T. Steenberg, Danish Pest Infestation Laboratory, Skovbrynet 14, DK-2800, Lyngby, Denmark.
bIsolate forms the active ingredient in the proprietary mycopesticideBotaniGard(Emerald BioAgriculture Corporation, 3125 Sovereign Dr, Lansing, MI 48911-4240).
cIsolate forms the active ingredient in the proprietary mycopesticide
Naturalis(Troy Biosciences Inc., 113 South 47th Avenue, Phoenix, AZ 850433, USA).
dKindly supplied by the USDA-ARS Collection of Entomopathogenic Fungal Cultures (ARSEF), USDA-ARS Plant Protection Research Unit, U.S.
Plant, Soil and Nutrition Laboratory, Tower Road, Ithaca, NY, 14853-2901, USA.
eObtained from the CAB International Mycological Institute, Bakeham Lane, Egham, Surrey, UK.
fKindly supplied by Biocare Technology Pty Ltd, RMB 1084 Pacific Highway, Somersby, NSW 2250, Australia.
gKindly supplied by C. Tkaczuk, University of Podlasie, Department of Plant Protection, ul. Prusa 14, 08110 Siedlce, Poland.
hKindly supplied by C.W. McCoy, University of Florida, CREC, 700 Experiment Station Road, Lake Alfred, FL 33850, USA.
iObtained from the American Type Culture Collection, 10801 University Boulevard, Manassas, VA, 20110-2209, USA.
jIsolate forms the active ingredient in the proprietary mycopesticide
Bio-Blast(Eco-Science Corporation, 17 Christopher Way, Eatontown, NJ 07724, USA).
kIsolate forms the active ingredient in the proprietary mycopesticide
Bio1020(Bayer AG, Werk Leverkusen, 51368 Leverkusen, Germany). lKindly supplied by M. Samish, Division of Parasitology, Kimron Veterinary Institute, Bet Dagan 50250, PO Box 12, Israel.
mObtained from the Canadian Collection of Fungal Cultures, ECORC Room 1015, K.W. Neatby building, C.E.F. Ottawa, Ontario, Canada.
nIsolate forms the active ingredient in the proprietary mycopesticidePFR97(Thermo-Trilogy Corporation, 9145 Guildford Road, Suite 175, Columbia, MD 21046, USA).
oIsolate forms the active ingredient in the proprietary mycopesticide
Vertalec(Koppert Biological Systems, PO Box 155, 2650 AD Berkel en Rodenrijs, The Netherlands).
pIsolate forms the active ingredient in the proprietary mycopesticide
Mycotal(Koppert Biological Systems, PO Box 155, 2650 AD Berkel en Rodenrijs, The Netherlands).
riðTÞ ¼
qið303 KÞ303T exp DHA6¼
R 3031 1
T
h i
1þexp DHHi
R T1=12Hi
1
T
ð1Þ
where ri(T) is the growth rate of isolate i at temperature
T(K), qi(303 K) is the development rate of isolate i at the standard reference temperature of 303 K assuming no enzyme inactivation, R is the universal gas constant (8Æ314 J K)1mol)1),DHA6¼ is the (species-specific) enthalpy of activation of the reaction that is catalysed by the enzyme (J mol)1), DHHi is the change in enthalpy associated with
high temperature inactivation of the enzyme (J mol)1) in isolatei,T1/2Hiis the temperature (K) at which the enzyme is 1/2 active and 1/2 high temperature inactive in isolatei.
A non-linear model like eqn (1) needs accurate starting values for the model-fitting procedure to converge. Starting values were required for the following parameters: DHA6¼, qi(303 K), DHHi and T1/2Hi. These starting values were
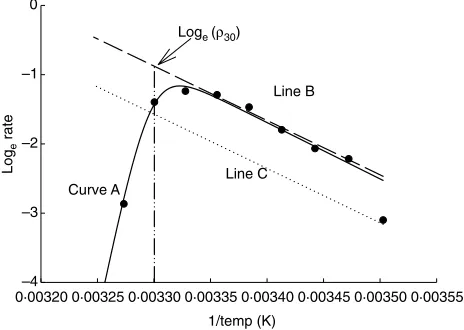
obtained from Arrhenius plots as recommended by School-fieldet al. (1981). Figure 1 illustrates how the Schoolfield et al.(1981) recommendation for choosing parameter starting values was implemented for an individual isolate. First of all a best fit curve, line A, was drawn by eye. The linear portion of curve A was then extended towards the vertical axis (line B). Line B represents the behaviour of the isolate under the assumption of no enzyme inactivation and has a slope of DHA6¼/R. Next, a vertical line was drawn corresponding to a temperature of 303 K (30C). This line intersects line B at qi(303 K), the rate of development at 303 K. The slope of curve A at the upper temperature range
is approx. (DHHi DH
6¼
A)/R. The most important starting value isT1/2Hi, the temperature (K) at which the enzyme is
1/2 active and 1/2 high-temperature inactive. To calculate this, line C was drawn with values one half of line B, obtained by subtracting loge2 from line B. T1/2Hi
corres-ponds to the point of intersection of lines A and C. The model was fitted simultaneously to all isolates of a species so that a common value of DHA6¼ could be established. Maximum likelihood estimation was performed using the FITNONLINEAR command of Genstat (Genstat 2000) with starting values read from the Arrhenius plots (Schoolfieldet al.1981). The temperature response of each isolate was summarized by its maximum achievable colony extension rate, its optimum temperature and its super-optimum temperature. The super-optimum temperature was the temperature of the maximum colony extension rate. The super-optimum temperature was defined as the temperature above the optimum at which the colony extension rate was 10% of the maximum rate. These temperatures were estimated by function minimization in Genstat (Genstat 2000). All calculations were performed using the thermo-dynamic temperature (K), but for ease of interpretation, optimum and super-optimum temperatures are reported as Celsius temperature (hC/C ¼ T/K) 273).
R E S U L T S
Experiment 1: measurement of rates of colony extension at 20, 30 and 35C.
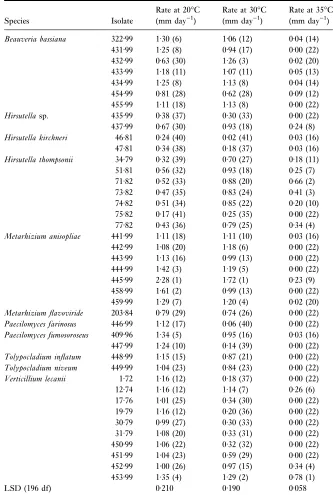
All the fungal isolates grew at 20 and 30C (Table 2). Colony extension rates at 20C varied from 0Æ17 mm day)1 (Hirsutella thompsonii75Æ82) to 2Æ28 mm day)1(Metarhizium anisopliae 445Æ99). Colony extension rates at 30C varied from 0Æ02 mm day)1 (Hirsutella kirchneri 46Æ81) to 1Æ72 mm day)1(M. anisopliae445Æ99). The slowest growing fungi at 20 and 30C tended to be isolates ofHirsutellaspp. Only 11 fungal isolates grew at 35C. Of these, seven isolates were Hirsutella spp., three were V. lecanii and one was M. anisopliae.
Experiment 2: modelling the colony extension response of selected isolates at 12
Æ
5–35CIn the Arrhenius plots, slopes below the optimum were similar for all the isolates (data not shown) and although there was evidence of low temperature inactivation for some isolates, there were insufficient data to estimate low temperature parameters. This was not unexpected, because most of the isolates studied in this experiment were pre-selected for their ability to grow at the higher temperature range. Equation (1) was formulated therefore to exclude low temperature inactivation as described previously.
1/temp (K)
Log
e
rate
0·00320 0·00325 0·00330 0·00335 0·00340 0·00345 0·00350 0·00355 –4
–3 –2 –1 0
Line B
Line C Curve A
Loge (ρ30)
Fig. 1 Arrhenius plot of colony extension rate ofHirsutella thompsonii (75Æ82) on SDA.dIndicates observed mean extension rates at 10
The interaction between temperature and fungal colony extension conformed closely to eqn (1). Overall, 87Æ6–93Æ9% of data variance could be accounted for by this model. The standard errors (S.E.S.E.s) of the mean colony extension rates were less than 10% of the mean rates in 80% of cases. Because of this high degree of precision,S.E.S.E.s were omitted from all graphs and statistical analyses were based on unweighted mean rates.
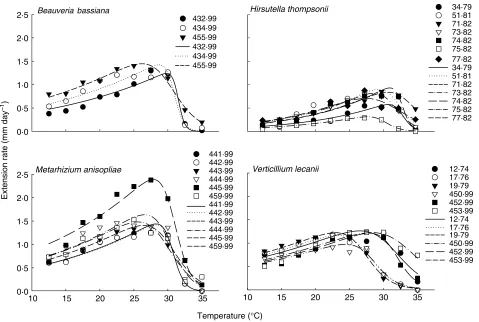
The temperature responses of all the isolates were asymmetric, with rapid inactivation at temperatures above
the optimum, the rate of which differed amongst isolates (Fig. 2). When Arrhenius plots were drawn for all isolates (not shown), it was apparent that line B had a very similar slope for all the isolates of a species. Hence it was appropriate to constrainDHA6¼to be the same for all isolates of a species. Thus starting values for DH6¼A were estimated by eye from Arrhenius plots corresponding to Fig. 1.
The species-specific temperature response, DHA6¼, indicated that, amongst the isolates tested, isolates of H. thompsonii were more sensitive to sub-optimal Table 2 Extension rates of 41 isolates of
entomopathogenic fungi at 20, 30 and 35C. Data points are the mean extension rates of six replicates. Isolates with no detectable growth were omitted from the analysis. Numbers in parenthesis represent their rank at the tem-perature examined
Species Isolate
Rate at 20C (mm day)1)
Rate at 30C (mm day)1)
Rate at 35C (mm day)1)
Beauveria bassiana 322Æ99 1Æ30 (6) 1Æ06 (12) 0Æ04 (14) 431Æ99 1Æ25 (8) 0Æ94 (17) 0Æ00 (22) 432Æ99 0Æ63 (30) 1Æ26 (3) 0Æ02 (20) 433Æ99 1Æ18 (11) 1Æ07 (11) 0Æ05 (13) 434Æ99 1Æ25 (8) 1Æ13 (8) 0Æ04 (14) 454Æ99 0Æ81 (28) 0Æ62 (28) 0Æ09 (12) 455Æ99 1Æ11 (18) 1Æ13 (8) 0Æ00 (22) Hirsutellasp. 435Æ99 0Æ38 (37) 0Æ30 (33) 0Æ00 (22) 437Æ99 0Æ67 (30) 0Æ93 (18) 0Æ24 (8) Hirsutella kirchneri 46Æ81 0Æ24 (40) 0Æ02 (41) 0Æ03 (16)
47Æ81 0Æ34 (38) 0Æ18 (37) 0Æ03 (16) Hirsutella thompsonii 34Æ79 0Æ32 (39) 0Æ70 (27) 0Æ18 (11) 51Æ81 0Æ56 (32) 0Æ93 (18) 0Æ25 (7) 71Æ82 0Æ52 (33) 0Æ88 (20) 0Æ66 (2) 73Æ82 0Æ47 (35) 0Æ83 (24) 0Æ41 (3) 74Æ82 0Æ51 (34) 0Æ85 (22) 0Æ20 (10) 75Æ82 0Æ17 (41) 0Æ25 (35) 0Æ00 (22) 77Æ82 0Æ43 (36) 0Æ79 (25) 0Æ34 (4) Metarhizium anisopliae 441Æ99 1Æ11 (18) 1Æ11 (10) 0Æ03 (16)
442Æ99 1Æ08 (20) 1Æ18 (6) 0Æ00 (22) 443Æ99 1Æ13 (16) 0Æ99 (13) 0Æ00 (22) 444Æ99 1Æ42 (3) 1Æ19 (5) 0Æ00 (22) 445Æ99 2Æ28 (1) 1Æ72 (1) 0Æ23 (9) 458Æ99 1Æ61 (2) 0Æ99 (13) 0Æ00 (22) 459Æ99 1Æ29 (7) 1Æ20 (4) 0Æ02 (20) Metarhizium flavoviride 203Æ84 0Æ79 (29) 0Æ74 (26) 0Æ00 (22) Paecilomyces farinosus 446Æ99 1Æ12 (17) 0Æ06 (40) 0Æ00 (22) Paecilomyces fumosoroseus 409Æ96 1Æ34 (5) 0Æ95 (16) 0Æ03 (16) 447Æ99 1Æ24 (10) 0Æ14 (39) 0Æ00 (22) Tolypocladium inflatum 448Æ99 1Æ15 (15) 0Æ87 (21) 0Æ00 (22) Tolypocladium niveum 449Æ99 1Æ04 (23) 0Æ84 (23) 0Æ00 (22) Verticillium lecanii 1Æ72 1Æ16 (12) 0Æ18 (37) 0Æ00 (22) 12Æ74 1Æ16 (12) 1Æ14 (7) 0Æ26 (6) 17Æ76 1Æ01 (25) 0Æ34 (30) 0Æ00 (22) 19Æ79 1Æ16 (12) 0Æ20 (36) 0Æ00 (22) 30Æ79 0Æ99 (27) 0Æ30 (33) 0Æ00 (22) 31Æ79 1Æ08 (20) 0Æ33 (31) 0Æ00 (22) 450Æ99 1Æ06 (22) 0Æ32 (32) 0Æ00 (22) 451Æ99 1Æ04 (23) 0Æ59 (29) 0Æ00 (22) 452Æ99 1Æ00 (26) 0Æ97 (15) 0Æ34 (4) 453Æ99 1Æ35 (4) 1Æ29 (2) 0Æ78 (1)
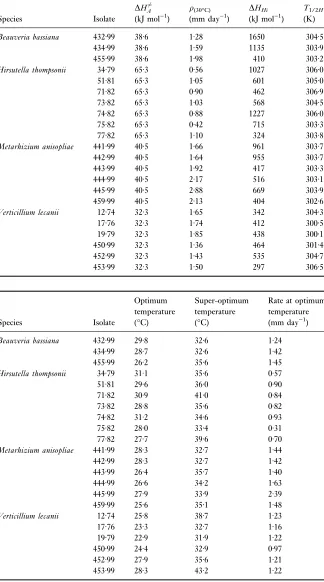
temperatures than isolates ofB. bassiana,M. anisopliaeand V. lecanii (Table 3). Although the parameter estimates presented in Table 3 are useful for fitting further models, and possibly for classifying new isolates, they are difficult to interpret in terms of fungal biology. Table 4 provides a summary that can be related to fungal thermal biology. The optimum temperatures for the isolates ranged from 22Æ9C (V. lecanii19Æ79) to 31Æ1C (H. thompsonii 34Æ79) (Table 4). Only three isolates exhibited temperature optima above 30C and these were all H. thompsonii (isolates 34Æ79, 71Æ82 and 74Æ82) originating from the cassava green mite, Eriophyes guerreronis, in Africa. The super-optimum temperatures for the isolates ranged from 31Æ9C (V. lecanii19Æ79) to 43Æ2C (V. lecanii 453Æ99). Super-optimum temperatures above 40C were observed for two isolates (H. thompsonii 71Æ82 and V. lecanii 453Æ99) and super-optimum temperatures above 35C were observed for 11 isolates (B. bassiana 455Æ99; H. thompsonii 34Æ79, 51Æ81, 71Æ82, 73Æ82 and 77Æ82; M. anisopliae443Æ99 and 459Æ99;V. lecanii12Æ74, 452Æ99 and 453Æ99).
D I S C U S S I O N
Self-evidently, a fungal control agent of V. destructor will have to function under the physical conditions of a honey bee colony (Chandleret al.2001). This paper was concerned primarily with measuring the response of fungal isolates to the high temperatures that are likely to be encountered in the brood nest area of honey bee colonies. The colony extension technique employed here is used widely to estimate the cardinal temperatures for fungal growth and is a valuable tool for screening entomopathogenic fungi prior to studies of their thermal requirements for infectivity (Fargues et al. 1992; Mietkiewski et al. 1994; Vidal et al. 1997). The response of fungi to temperature is a character-istic bell-shaped curve, skewed to the lower temperatures (Xu 1996). However, non-linear approaches to analysing entomopathogenic fungus–temperature interactions are not yet used routinely. In invertebrate mycopathology, the Sharpe and DeMichele (1977) model of poikilotherm development has been used to analyse the effect of
Extension rate (mm day
–1)
Beauveria bassiana
0·0 0·5 1·0 1·5 2·0
2·5 432·99
434·99 455·99 432·99 434·99 455·99
Hirsutella thompsonii 34·79
51·81 71·82 73·82 74·82 75·82 77·82 34·79 51·81 71·82 73·82 74·82 75·82 77·82
Metarhizium anisopliae
0·0 0·5 1·0 1·5 2·0 2·5
441·99 442·99 443·99 444·99 445·99 459·99 441·99 442·99 443·99 444·99 445·99 459·99
Verticillium lecanii
10 15 20 25 30 35
10 15 20 25 30 35
Temperature (°C)
12·74 17·76 19·79 450·99 452·99 453·99 12·74 17·76 19·79 450·99 452·99 453·99
temperature on the mortality rate of twospotted spider mites,Tetranychus urticae, infected with the entomophtho-ralean fungusNeozygites floridana(Smitleyet al.1986), and
to predict the rate of development ofLagenidium giganteum (Chromista, Oomycetes) in its mosquito host (Patel et al. 1991). A non-linear regression procedure (in SPSS for Table 3 Parameter estimates for the effect
of temperature on the extension rates of colonies of entomopathogenic fungi (22 isolates from four genera). Estimations were based on the modified Sharpe and DeMichele (1977) model described in the text
Species Isolate
DHA6¼ (kJ mol)1)
q(30C) (mm day)1)
DHHi
(kJ mol)1)
T1/2H
(K)
Beauveria bassiana 432Æ99 38Æ6 1Æ28 1650 304Æ5 434Æ99 38Æ6 1Æ59 1135 303Æ9 455Æ99 38Æ6 1Æ98 410 303Æ2 Hirsutella thompsonii 34Æ79 65Æ3 0Æ56 1027 306Æ0 51Æ81 65Æ3 1Æ05 601 305Æ0 71Æ82 65Æ3 0Æ90 462 306Æ9 73Æ82 65Æ3 1Æ03 568 304Æ5 74Æ82 65Æ3 0Æ88 1227 306Æ0 75Æ82 65Æ3 0Æ42 715 303Æ3 77Æ82 65Æ3 1Æ10 324 303Æ8 Metarhizium anisopliae 441Æ99 40Æ5 1Æ66 961 303Æ7 442Æ99 40Æ5 1Æ64 955 303Æ7 443Æ99 40Æ5 1Æ92 417 303Æ3 444Æ99 40Æ5 2Æ17 516 303Æ1 445Æ99 40Æ5 2Æ88 669 303Æ9 459Æ99 40Æ5 2Æ13 404 302Æ6 Verticillium lecanii 12Æ74 32Æ3 1Æ65 342 304Æ3 17Æ76 32Æ3 1Æ74 412 300Æ5 19Æ79 32Æ3 1Æ85 438 300Æ1 450Æ99 32Æ3 1Æ36 464 301Æ4 452Æ99 32Æ3 1Æ43 535 304Æ7 453Æ99 32Æ3 1Æ50 297 306Æ5
Table 4 Temperature responses of entomopathogenic fungi (22 isolates from four genera). Values are the estimates obtained using the modified Sharpe and DeMichele (1977) model described in the text
Species Isolate
Optimum temperature (C)
Super-optimum temperature (C)
Rate at optimum temperature (mm day)1)
Windows 6.1; SPSS, Inc., Chicago, IL, USA) has also been used to estimate the optimum temperature for colony extension of M. flavoviride (M. anisopliae var. acridum) isolates used as microbial control agents of locusts and grasshoppers (Thomas and Jenkins 1997).
The thermal requirements of the fungal isolates being examined against V. destructor are well matched to the temperatures in the broodless areas of honey bee colonies in temperate regions in the summer (ca.25C) (Simpson 1961). Our results indicate that a proportion of the isolates will also be able to function under the temperature conditions within drone brood areas on the periphery of the brood nest, where mites preferentially reproduce (32Æ5–33Æ4C) (Le Conte et al.1990). However, there are doubts about the ability of these isolates to operate in central areas of the brood nest where temperatures range from 33 to 36C (Southwick and Heldmaier 1987). In general, isolates of H. thompsonii showed the best growth responses to high temperatures, although some isolates from the other species compared favourably, for example V. lecanii 453Æ99. In all cases, however, small increases in temperature above the optimum had a disproportionate effect on fungal development. With this in mind, the most valuable isolates are likely to be those not only with high temperature optima, but also with small values of (DHHi DH
6¼
A) (i.e. shallow slopes at the upper temperature range). Our studies have focused on honey bee colony conditions in the summer, but the results show also that temperature conditions within winter colonies are unlikely to impair fungal activity.
There is merit in widening the search for isolates that are capable of killingV. destructor at temperature conditions in the centre of the brood nest. Of the fungal isolates examined in our study, those of Hirsutella spp. exhibited the most favourable temperature profiles, although other genera should also be included in future screening programmes. For example, an isolate of M. flavoviride, originating from Madagascar, grew best at 34C and had a maximum temperature for growth of 38C (Wellinget al.1994), while isolates ofM. anisopliaehave been described that germinated rapidly at 37C (McCammon and Rath 1994) or grew at 40C (Hallsworth and Magan 1999). The relationship between geographic origin and thermal biology did not form part of this study, however, entomopathogenic fungi exhibit adap-tations to their thermal environments, which become more apparent towards the upper and lower thresholds (Fargues et al. 1992; Thomas and Jenkins 1997), and hence high temperature isolates are more likely to be found in hot environments. Isolates ofPaecilomyces fumosoroseusfrom the tropics or subtropics, for example, tolerated high (32 and 35C) temperatures better than isolates from European temperate zones (Vidalet al.1997). Conversely, in Canada, cold active isolates ofM. anisopliaewere associated with more northerly latitudes (Amritha De Croos and Bidochka 1999).
The methods described in this paper provide valuable information on the thermal biology of fungi being tes-ted against V. destructor. The Schoolfield et al. (1981) re-formulation of the Sharpe and DeMichele (1977) model described the data well and undoubtedly has wider appli-cations in mycology. Xu (1996) has emphasized the importance of non-linear models in understanding and predicting fungal development at fluctuating temperatures, and in particular, the phenomenon whereby the develop-ment rate at fluctuating temperatures differs from the rate at a constant temperature, corresponding to the average of the fluctuating temperatures (which can be explained simply by the mathematical properties of nonlinear functions, the so-called Kauffman effect). For our work, the model could possibly help in predicting the activity of a microbial control agent against V. destructor at the fluctuating temperatures that would be experienced by a fungus carried in different areas of a colony. However, further research is required to determine the effects of temperature on fungal infectivity to V. destructor, and the persistence of conidia within honey bee colonies. Screening isolates for favourable temperature responses should now be easier, as the use of a species-specific coefficient DHA6¼ enables thermal behaviour to be described fully, using only a small number of temperatures around the optimum.
A C K N O W L E D G E M E N T S
This work was funded by the UK Department for Environment, Food and Rural Affairs. IACR-Rothamsted receives grant-aided support from the Biotechnology and Biological Sciences Research Council of the UK. The authors wish to thank Prof. Mark Tatchell, Prof. John Whipps, Dr Rosemary Collier and Dr Xiangming Xu for critically evaluating the manuscript.
R E F E R E N C E S
Amritha De Croos, J.N. and Bidochka, M.J. (1999) Effects of low temperature on growth parameters in the entomopathogenic fungus Metarhizium anisopliae.Canadian Journal of Microbiology45, 1055– 1061.
Anon. (2001) Resistant Varroa mites found in bee hives in the UK.Bee Craft83, 6–8.
Ball, B.V. (1994a) The development of control strategies forVarroa jacobsoniin colonies ofApis mellifera.Proceedings of the Brighton Crop Protection Conference – Pests and Diseases 19942, 569–576. Ball, B.V. (1994b) Host-parasite-pathogen interactions. In New
Perspectives on Varroa ed. Matheson, A. pp. 5–11. Cardiff, UK: International Bee Research Association.
Chandler, D. (1994) Cryopreservation of fungal spores using porous beads.Mycological Research98, 525–526.
Chandler, D., Davidson, G., Pell, J.K., Ball, B.V., Shaw, K. and Sunderland, K.D. (2000) Fungal biocontrol of Acari. Biocontrol Science and Technology10, 357–384.
Chandler, D., Sunderland, K.D., Ball, B.V. and Davidson, G. (2001) Prospective biological control agents ofVarroa destructorn. sp., an important pest of the European honey bee,Apis mellifera.Biocontrol Science and Technology11, 429–448.
Cooke, R.C. and Whipps, J.M. (1993)Ecophysiology of Fungi. Oxford: Blackwell Scientific Publications.
Elzen, P.J., Eischen, F.A., Baxter, J.B., Pettis, J., Elzen, G.W. and Wilson, W.T. (1998) Fluvalinate resistance inVarroa jacobsonifrom several geographic locations.American Bee Journal138, 674–676. Eyring, H. (1935) The activated complex in chemical reactions.Journal
of Chemical Physics3, 107–115.
Fargues, J., Maniania, N.K., Delmas, J.C. and Smits, N. (1992) Influence de la temperature sur la croissancein vitrod’hyphomycetes entomopathogenes.Agronomie12, 557–564.
Fargues, J., Goettel, M.S., Smits, N., Oudraogo, A. and Rougier, M. (1997) Effect of temperature on vegetative growth of Beauveria bassianaisolates from different origins.Mycologia89, 383–392. Ferron, P. (1978) Biological control of insect pests by entomogenous
fungi.Annual Review of Entomology23, 409–442.
Free, J.B. and Spencer-Booth, Y. (1959) Temperature regulation by honeybees.Bee World40, 173–177.
Genstat. (2000)Genstat for Windows. Release 4.2., 5th edn. Oxford: VSN International Ltd.
Hallsworth, J.E. and Magan, N. (1999) Water and temperature relations of growth of the entomogenous fungiBeauveria bassiana, Metarhizium anisopliaeandPaecilomyces farinosus.Journal of Inver-tebrate Pathology74, 261–266.
Hillesheim, E., Ritter, W. and Bassand, D. (1996) First data on resistance mechanisms of Varroa jacobsoni (Oud.) against tau-fluvalinate.Experimental and Applied Acarology20, 283–296. Hultin, E. (1955) The influence of temperature on the rate of enzymic
processes.Acta Chemica Scandinavica9, 1700–1710.
Inch, J.M. and Trinci, A.P.J. (1987) Effects of water activity on growth and sporulation ofPaecilomyces farinosusin liquid and solid media. Journal of General Microbiology133, 247–252.
Johnson, F.H. and Lewin, I. (1946) The growth rate of E. coli in relation to temperature, quinone and coenzyme.Journal of Cellular and Comparative Physiology28, 47–75.
Le Conte, Y., Arnold, G. and Desenfant, P.H. (1990) Influence of brood temperature and hygrometry variations on the development of the honey bee ectoparasiteVarroa jacobsoni(Mesostigmata: Varroi-dae).Environmental Entomology19, 1780–1785.
McCammon, S.A. and Rath, A.C. (1994) Separation ofMetarhizium anisopliae strains by temperature dependent germination rates. Mycological Research98, 1253–1257.
Milani, N. (1999) The resistance ofVarroa jacobsoniOud. to acaricides. Apidologie30, 229–234.
Mietkiewski, R., Tkaczuk, C., Zurek, M. and Van Der Geest, L.P.S. (1994) Temperature requirements of four entomopathogenic fungi. Acta Mycologica29, 109–120.
Patel, K.J., Rueda, L.M., Axtell, R.C. and Stinner, R.E. (1991) Temperature-dependent development of the fungal pathogen
Lagenidium giganteum (Oomycetes: Lagendiales) in larvae ofCulex quinquefasciatus(Diptera: Culicidae).Journal of Medical Entomology
28, 95–100.
Sammataro, D., Gerson, U. and Needham, G. (2000) Parasitic mites of honey bees: life history, implications, and impact.Annual Review of Entomology45, 519–548.
Sanford, T. (1996) World winter varroa kill. APIS (Apicultural Information and Issues from IFAS/University of Florida Department of Entomology and Nematology) 14 (WWW document). URLhttp:// www.ifas.ufl.edu/mts/apishtm/apis96/apjun96.htm#8
Schoolfield, R.M., Sharpe, P.J.H. and Magnuson, C.E. (1981) Non linear regression of biological temperature-dependent rate models based on absolute reaction-rate theory.Journal of Theoretical Biology
88, 719–731.
Seeley, T. and Heinrich, B. (1981) Regulation of temperature in the nests of social insects. InInsect Thermoregulationed. Heinrich, B. pp. 160–234. New York: John Wiley & Sons Inc.
Sharpe, P.J.H. and DeMichele, D.W. (1977) Reaction kinetics of poikilotherm development.Journal of Theoretical Biology64, 649–670. Shaw, K.E., Davidson, G., Clark, S.J., Ball, B.V., Pell, J.K., Chandler, D. and Sunderland, K. (2002) Laboratory bioassays to assess the pathogenicity of mitosporic fungi to Varroa destructor (sp. nov) (Acari: Mesostigmata), an ectoparasitic mite of the honey bee,Apis melliferaL.Biological Control24, 266–276.
Simpson, J. (1961) Nest climate regulation in honey bee colonies. Science133, 1327–1333.
Smitley, D.R., Brooks, W.M. and Kennedy, G.G. (1986) Environ-mental effects on production of primary and secondary conidia, infection, and pathogenesis ofNeozygites floridana, a pathogen of the twospotted spider mite,Tetranychus urticae.Journal of Invertebrate Pathology47, 325–332.
Southwick, E.E. (1984) Metabolismus von Honigbienen: Einfluss der Traubengrosse bei niedrigen Temperaturen.Apidologie15, 267–269. Southwick, E.E. and Heldmaier, G. (1987) Temperature control in
honey bee colonies.Bioscience37, 395–399.
Thomas, H.U. (1997) Practical aspects of alternative Varroacontrol methods. In Varroa: fight the mite. ed. Munn, P. and Jones, R. pp 22–30. Cardiff, UK: International Bee Research Association. Thomas, M.B. and Jenkins, N.E. (1997) Effects of temperature on
growth of Metarhizium flavovirideand virulence to the variegated grasshopper,Zonocerus variegatus.Mycological Research101, 1469– 1474.
Trinci, A.P.J. (1971) Influence of the peripheral growth zone on the radial growth rate of fungal colonies.Journal of General Microbiology
67, 325–334.
Vidal, C., Fargues, J. and Lacey, L.A. (1997) Intraspecific variability of Paecilomyces fumosoroseus: effect of temperature on vegetative growth.Journal of Invertebrate Pathology70, 18–26.
Welling, M., Nachtigall, G. and Zimmerman, G. (1994)Metarhizium spp. isolates from Madagascar: morphology and effect of high temperature on growth and infectivity to the migratory locust, Locusta migratoria.Entomophaga39, 351–361.
Winston, M. (1987) The Biology of the Honeybee. Cambridge, USA: Harvard University Press.