Patron: Her Majesty The Queen Rothamsted Research Harpenden, Herts, AL5 2JQ
Telephone: +44 (0)1582 763133 Web: http://www.rothamsted.ac.uk/
Rothamsted Research is a Company Limited by Guarantee Registered Office: as above. Registered in England No. 2393175. Registered Charity No. 802038. VAT No. 197 4201 51. Founded in 1843 by John Bennet Lawes.
Rothamsted Repository Download
A - Papers appearing in refereed journals
Gudelj, I., Fitt, B. D. L. and Van Den Bosch, F. 2004. Evolution of sibling
fungal plant pathogens in relation to host specialization. Phytopathology.
94 (7), pp. 789-795.
The publisher's version can be accessed at:
•
https://dx.doi.org/https://doi.org/10.1094/PHYTO.2004.94.7.789
The output can be accessed at:
https://repository.rothamsted.ac.uk/item/89327/evolution-of-sibling-fungal-plant-pathogens-in-relation-to-host-specialization.
© Please contact [email protected] for copyright queries.
Analytical and Theoretical Plant Pathology
Evolution of Sibling Fungal Plant Pathogens
in Relation to Host Specialization
I. Gudelj, B. D. L. Fitt, and F. van den Bosch
Rothamsted Research, Harpenden, Herts AL5 2JQ, UK. Accepted for publication 30 January 2004.
ABSTRACT
Gudelj, I., Fitt, B. D. L., and van den Bosch, F. 2004. Evolution of sibling fungal plant pathogens in relation to host specialization. Phytopathology 94:789-795.
Sibling plant pathogens can be grouped according to their host ranges into the following groups: group 1, sibling pathogens with nonoverlap-ping host ranges; group 2, sibling pathogens with both overlapnonoverlap-ping and nonoverlapping host ranges; and group 3, sibling pathogens with overlap-ping host ranges. Using the adaptive dynamics methodology, we investi-gated the evolution of sibling pathogens in relation to host specialization
for groups 1 to 3. In particular, we focused on the role of multiple host niches and a trade-off in infectivity of pathogens to these hosts on the evolutionary outcome. We have shown that this ecological mechanism can explain only the evolution of sibling pathogens in group 1 and that other ecological and epidemiological mechanisms must be responsible for the evolution of sibling pathogens in the other two groups.
Additional keywords: mathematical model, phenotype, simulation, trade-off relationship.
There are numerous examples of fungal morphospecies (mor-phologically indistinguishable organisms) within which partially or totally reproductively isolated subgroups have been identified (for summary [5]). Their discovery dates back to the report of formae speciales in Puccinia graminis (15). In this paper, the term sibling pathogens will broadly be used to denote these fun-gal subgroups, presumed to be closely related, including sub-species, true sibling sub-species, varieties, and formae speciales.
The evolution of sibling fungal plant pathogens is not well understood but morphological and genetic similarities between individuals suggest that they have evolved from a common ances-tor. Elucidation of the ecological and epidemiological mecha-nisms that lead to evolutionary divergence in fungal pathogens has received little attention. However, fungal pathogens provide a good model for scientific studies of evolution because changes can occur over relatively short time scales, measured in years or decades (5). Furthermore, understanding the effects of disease management practices on fungal evolution could provide new or improved strategies for the control of emerging or reemerging diseases.
The requirements for fungal speciation have been discussed by Rayner et al. (47). According to post-Darwinian evolutionary theory, the elements contributing to speciation are an interbreed-ing population, natural selection, reproductive isolation, and the genetic system. The importance and role of the first three ele-ments in fungal speciation have been investigated by Brasier (5), while the role of the mating system was examined by Carlile (8) and Caten (10). This paper focuses on the role that host-defined niches have in the evolution of sibling plant pathogens.
It has been suggested that the initiation of speciation in the same geographical region (sympatric speciation) occurs when an ancestral population is exposed to two or more ecological niches (29,39,41). There is some evidence for this supposition in fungal
pathogens. For example, the powdery mildew Blumeria graminis
occurs as two partially or totally reproductively isolated formae speciales (tritici and hordei). These subspecific taxa could have evolved through pathogen divergence in response to relatively narrow host-defined ecological niches (5). Sibling pathogens ex-hibiting both broad and narrow host ranges can also be found in some fungal pathogens. For example, it has been suggested (5) that Botrytis cinerea, which exhibits a broad host range, repre-sents the ancestral form of those related Botrytis species that are adapted to one or a few host species.
In this paper, the ability of a pathogen to infect a particular host-defined niche is referred to as its infectivity. Combining the concept of ecological niches and the relative success that a patho-gen has in occupying them, we develop a mathematical model to investigate the role of multiple host species and variations in in-fectivity to these hosts in the evolution of sibling plant pathogens. There are two main approaches to modeling evolution of host and pathogen populations (1,46). The first approach deals explic-itly with the genetic structure of the population, which often makes it difficult to incorporate ecological mechanisms (21,36). A second approach focuses on the density dependence and epidemi-ology of the interactions between hosts and pathogens, focusing on phenotypes without explicit reference to genetics (4,12,14,22, 23,40,44). Such models investigate how epidemiological param-eters evolve in response to the selective pressure exerted by trade-off relationships between host and pathogen populations.
Adopting the second approach, our model considers a simple pathosystem of two hosts and a pathogen. It investigates the evo-lution of the pathogen with respect to its differential infectivity to the two hosts, and it assumes that an increase in infectivity to one host carries a cost in terms of infectivity to the other host. Ex-amples of sibling fungal pathogens that occupy different types of ecological niches are discussed in the first part of the paper. Niches range from different hosts to different tissues or organs within the same host. The second part of the paper formulates the mathematical model, and the results of evolutionary simulations are discussed in the context of the examples.
Host range of sibling pathogens. The importance of ecologi-cal niches in fungal speciation (5) is discussed in relation to
spe-Corresponding author: I. Gudelj; E-mail address: [email protected]
Publication no. P-2004-0427-02R
cific examples summarized in Table 1. The examples are divided into three groups: group 1, sibling pathogens with nonoverlapping host ranges; group 2, sibling pathogens with both overlapping and nonoverlapping host ranges; and group 3, sibling pathogens with overlapping host ranges. One example from each group is de-scribed below in more detail and other examples are summarized in Table 1.
Nonoverlapping host ranges. There are numerous examples of sibling pathogens that exhibit distinct host ranges. One exam-ple is Phytophthora megasperma, which has long been referred to as a single species, despite the evident subspecific variations (16). Based on host specificity, three formae speciales have been distin-guished. Phytophthora megasperma f. sp. glycina, medicaginis, and trifolii are primarily infective to soybean, alfalfa, and clover, respectively (16,34). Examining variations at the DNA level showed that Phytophthora megasperma f. sp. glycina (19) is not closely related to the other two formae speciales, which were sub-sequently recognized as separate sibling species: Phytophthora medicaginis and Phytophthora trifolii (27).
Phytophthora trifolii infects the clover species Trifolium agrarium, T. incarnatum, T. repens, T. subterraneum, and T. vesi-culosum (16). Phytophthora medicaginis is a pathogen of Medi-cago sativa, Onobrychis viciifolia, Cicer arietinum, and Prunus mahaleb (16). Both pathogens cause root rot in plants on continu-ously wet soil and both pathogens are restricted to North America. Thus, Phytophthora trifolii and Phytophthora medicaginis repre-sent a set of closely related sibling plant pathogen species that exist sympatrically and cause similar diseases under similar
en-vironmental conditions; the two species have, however, com-pletely separate host ranges.
Partly shared and partly nonoverlapping host ranges.
Within the genus Botrytis, there are species that exhibit broad or narrow host ranges. Botrytis cinerea (teleomorph Botryotinia fuckeliana) was first described in the seventeenth century (32). There are now some 23 Botrytis species recognized and most of them were originally distinguished from Botrytis cinerea by their specificity to a single host (32). Frequently, host-specific Botrytis
species are more pathogenic to their specific host than is Botrytis cinerea, which is nevertheless infective to all the hosts of host-specific Botrytis species. Botrytis cinerea is one of the most ubiqui-tous of plant pathogens, being infective to over 200 host species (32). The host-specific Botrytis species are almost all pathogens of bulbous monocotyledons (e.g., Botrytis gladiolorum, Botryo-tinia draytonii, and Botrytis tulipae). All Botrytis species have a worldwide distribution, occurring wherever their host plants are grown (32), with most records being from cool-temperate and warm-temperate zones. In summary, there are more than 20 closely related sibling species of Botrytis, with one (Botrytis cinerea) having a wide host range and the others confined to one or a few closely related host species.
Shared host ranges. An example in which sibling pathogens are infective to the same host is with Leptosphaeria species (cause of Phoma stem canker on oilseed rape). Leptosphaeria is divided into groups including L. maculans (A group), which is highly parasitic (slowly growing in vitro), and L. biglobosa (B group), which is weakly parasitic (rapidly growing in vitro)
TABLE 1. Examples of sibling fungal plant pathogens that have nonoverlapping host range, both broad and narrow host ranges, and share a host range
Genus teleomorph/anamorph Subspecies or subspecific group Hosts Refs.
Group 1
Phytophthora P. trifolii Hop clover, crimson clover, white clover,
subterranean clover, and arrow clover (16)
P. medicaginis Alfalfa, sainfoin, chickpea, and cherry
Puccinia P. graminis f. sp. tritici Wheat (2,6,25,33)
P. graminis f. sp. avenae Oats
P. graminis f. sp. secalis Rye
Blumeria B. graminis f. sp. tritici Wheat (9,37,43)
B. graminis f. sp. hordei Barley (51)
Heterobasidion P. annosum Pine (59)
P. parviporum Spruce
P. parviporum Fir
Group 2
Botrytis (teleomorph Botryotinia for some species)
Botrytis cinerea (B. fuckeliana) Wide range including all hosts of specialized
species (30)
B. fabae Faba beans, Vicia sativa
B. allii Onion, shallot, and garlic
B. convoluta Iris
(10 other species) Specialized to specific bulb species
Stagonospora avenae (anamorph Septoria Stagonospora avenae f. sp. triticea Oats, wheat, and triticale (55) avenae) Stagonospora avenae f. sp. avenae Oats
Group 3
Leptosphaeria (anamorph Phoma lingam) L. maculans (A group)
L. biglobosa (B group)
Wild and cultivated cruciferae, especially Brassica species (oilseed rape, cabbage, and turnip, etc.), Sinapis alba,and
Raphanus species (58)
Tapesia (anamorph Pseudocercosporella herpotrichoides)
T. yallundae
(W-type; P. herpotrichoides var. herpotrichoides)
Cereals, including wheat, barley, rye, and
many grass species (3,38,48) T. acuformis
(R-type; P. herpotrichoides var. acuformis) Mycosphaerella (anamorph
Pseudocercospora)
M. fijiensis (also var. difformis)
Bananas and plantains (20,56)
M. musicola
Mycosphaerella (Pseudocercosporella) M. brassicicola (no anamorph found) M. capsellae (P. capsellae)
Brassica and cruciferous species including
oilseed rape (31)
a Group 1, sibling pathogens host specialized; group 2, some sibling pathogens host specialized, another with a wide host range; and group 3, sibling pathogens
(42,50). These species have been discriminated based on conidial germ tube growth, cultural characteristics, pigment production in the culture medium, toxin production (Tox+ and Tox0), soluble
protein profiles, electrophoretic karyotype, and DNA polymor-phisms. Both L. maculans and L. biglobosa infect a wide range of wild and cultivated cruciferae, especially Brassica species (oil-seed rape, cabbage, and turnip, etc.), Sinapis alba, and Raphanus
species. L. maculans is associated with large, pale beige leaf le-sions, whereas L. biglobosa is associated with small, dark leaf lesions (57). L. maculans is particularly associated with damaging
stem base cankers, whereas L. biglobosa is more commonly
associated with less damaging lesions higher up stems.
Both L. maculans and L. biglobosa have a worldwide distribu-tion on brassicas in temperate climates (57). However, while there are mixed populations of both species in Western Europe and North America, there is evidence that only L. maculans occurs in Australia, and only L. biglobosa in parts of Eastern Europe and in
Asian Countries such as China. In summary, L. maculans and
L. biglobosa represent closely related sibling species with a similar host range.
THEORY AND APPROACHES
Evolutionary dynamics. Consider the situation where the resi-dent pathogen population is monomorphic. The pathogen is infec-tive to a range of host species. The offspring of the pathogen are phenotypically identical to their parents, unless a change in pheno-type occurs due to a mutation or any other change in the offspring DNA. The offspring with a phenotype different from the parent is called the invader phenotype. At this stage, we assume that changes in phenotype are small so that an invader phenotype is close to the phenotype of its parent (this assumption will be relaxed later). Once present in the population, the invader pheno-type can, if successful, increase in density and coexist with the resident phenotype or completely replace it. If unsuccessful, the invader phenotype decreases in density and dies out. A succession of appearances of new phenotypes that subsequently invade causes a directional change in the phenotype of the pathogen population. This sequence of invasions constitutes the evolution-ary process.
The following qualitatively different evolutionary cases are of a particular interest to the present study. In the first case, the pheno-type of the population can gradually change in a certain direction and converge to a population consisting of one particular pheno-type only. In the second case, after a gradual change in a certain direction, the pathogen population splits into two (or more) groups, each having a different phenotype. Such evolutionary splitting into two or more phenotypes produces the sibling patho-gen groups that are the subject of this study.
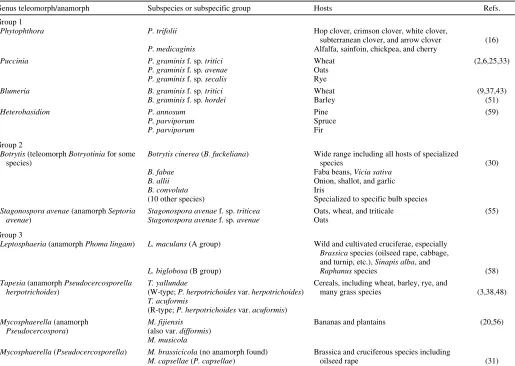
Trade-off relationships. An important component of evolu-tionary dynamics is a trade-off relationship between the costs and benefits associated with a change in phenotype. In this paper, the evolving phenotype is the pathogen infectivity to two hosts, and we impose a trade-off relationship in which an increase in the in-fectivity to host 1 carries a cost in the form of reduced inin-fectivity to host 2 and vice versa. The trade-off relationship can be illus-trated by plotting the infectivity to host 1 against the infectivity to host 2 (Fig. 1). Each of the two curves represents a possible trade-off relationship of a pathogen. The trade-trade-off curve allows consid-eration of the evolutionary changes in infectivity to one host only, and here we choose infectivity to host 1. The infectivity to host 2 can subsequently be determined from the trade-off curve.
The shapes of trade-off curves are difficult to measure, and so far there have been few attempts to quantify these relationships for plant–pathogen systems. However, detailed knowledge of the infection and resistance mechanisms in a particular host–patho-gen system could enable the shape of the trade-off curve to be deduced. For example, consider a pathogen that is infective only
to one host, e.g., host 2 (note that a similar argument is applicable to the case in which a given pathogen is only infective to host 1 and is analogous to the one we are about to give). Due to the na-ture of trade-off, there is a cost incurred with a change of infectiv-ity to host 1, namely reduced infectivinfectiv-ity to host 2. In a convex trade-off relationship (Fig. 1), an ε increase in infectivity to host 1 decreases the infectivity to host 2 by an amount that is larger than
ε. Such a costly change could, for example, relate to evolutionary changes in plant–pathogen gene-for-gene relationships (11). In a concave trade-off relationship (Fig. 1), an ε increase in infectivity to host 1 decreases the infectivity to host 2 by an amount that is smaller than ε. Such a relatively inexpensive change could relate to evolutionary changes in pathogen enzymes that facilitate the biochemical interactions involved in the pathogen infection proc-ess (52).
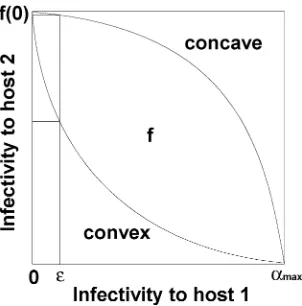
Evolutionary dynamics and trade-offs in relation to sibling pathogen groups. Figure 2 illustrates a connection between the three groups of sibling pathogens discussed in the previous sec-tion and evolusec-tionary dynamics with trade-offs. The trade-off relationships are given in Figure 2A to C. The corresponding evo-lutionary dynamics, in which the infectivity to host 1 is plotted on the x axis and the evolutionary time is plotted on the y axis, are presented in Figure 2D to F. The evolutionary process starts at time 0 with a monomorphic ancestor population with infectivity to host 1 at α0. During the course of evolution, the population
evolves as a monomorphic population until it reaches a point in which it becomes dimorphic.
Pathogens that are completely host specialized (as in group 1) are infective only to the host on which they specialize (Fig. 2A,
U represents the pathogen infective only to host 2 and c repre-sents the pathogen infective only to host 1). Figure 2D illustrates branching of the evolutionary tree in which the evolutionary end-point is two pathogen subgroups, one with infectivity on host 1 at 0 and the other with infectivity on host 1 at αmax. The trade-off
relationship f (Fig. 1) gives the corresponding value of infectivity on host 2, namely f(0) > 0 and f(αmax)= 0.
Pathogens in which some sibling subgroups are completely host specialized while others have a wide host range (as in group 2) are illustrated in Figure 2B. Here, one pathogen is infective to both hosts (represented by U), while the other is infective only to one of them (represented by c). Figure 2E represents the branch-ing of the evolutionary tree where at the evolutionary end-point the nonspecialized pathogen subgroup has αU infectivity on host
1 and the other pathogen subgroup is specialized to host 1 with infectivity αmax. The trade-off relationship f gives the
correspond-ing value of infectivity on host 2, namely f(αU) > 0 and f(αmax)= 0.
Finally, pathogen subgroups that share a host range (as in group 3) have nonzero infectivity on both hosts (Fig. 2C). Figure 2F illustrates branching of the evolutionary tree, and the end-point of
evolution is two pathogen subgroups, one with αUas the
infectiv-ity on host 1 and the other with αc as the infectivity on host 1. Consequently, the trade-off relationship gives f(αU) and f(αc) as
the corresponding infectivities on host 2.
The model. Consider a system of two host species with a com-mon pathogen. For simplicity, we assume that the host is either healthy or infective, omitting the latent period. Hi(t) denotes the
density of healthy tissue of host i at time t where I = 1,2. Both H1
and H2 increase in time due to planting and growth and decrease
in time due to harvesting and disease. P denotes the density of in-fected plant tissue from both hosts, and implicitly serves as a meas-ure of pathogen density. P increases in time due to infection and decreases due to harvest, disease-induced death, and death due to disease control. This gives the governing equations of the form:
− = − − = − − = death and Harvest 2 and 1 host of Infection 2 and 1 host infected of density of change of Rate 2 host of Infection 2 host of Harvest 2 host of growth and Planting 2 host healthy of density of change of Rate 1 host of Infection 1 host of Harvest 1 host of growth and Planting 1 host healthy of density of change of Rate (1)
A constant planting rate, ri, is assumed for each host population, i.
Both host populations are bound by a constant upper limit, Ki,
which represents an equilibrium density of population i in the absence of the pathogen. Therefore, the growth term of host i is represented by ri(1 – Hi(t)/Ki), which includes healthy tissue loss
due to harvest.
The pathogen produces ε spores per time unit per amount of in-fected tissue. Consequently, εP denotes the number of spores produced per time unit per unit area. The amount of healthy tissue of host i present in the flight trajectory of the spore is given by
dHi. In modeling host–parasitoid or predator–prey systems, d is
often known as the area of discovery (28). Once a spore has landed on healthy tissue, there is a constant probability, pi, that
the healthy tissue of host i will become infected. The infection term [infection of host i] can thus be represented as αiHi(t)P(t),
where αi = εdpi and I = 1,2. The constant αi represents the
infec-tivity of the pathogen to host i. Note that the trade-off relationship as introduced in the previous section is a trade-off between α1 and
α2.
The density of infected hosts decreases due to harvest and death with rate Γ. Thus, the [harvest and death] term in equation 1 is given by ΓP(t). Substituting the above terms into equation 1, we arrive at
) ( ) ( ) ( 1 ) ( 1 1 1 1 1 1 t H t P K t H r dt t
dH −α
− = ) ( ) ( ) ( 1 ) ( 2 2 2 2 2
2 PtH t
K t H r dt t
dH −α
−
= (2)
() 1P(t)H1(t) 2P(t)H2(t) P(t) dt t dP Γ − α + α =
A list of the parameters used in the model is given in Table 2. The range of the parameter values is chosen to reflect the range of values used in modeling host–pathogen interactions (7,24,26,54).
Evolutionary algorithm. The evolutionary process is simu-lated using the following algorithm. As explained in the previous section, the evolving phenotype is the infectivity of the pathogen to host 1, ranging from 0 to αmax. This continuous interval of
in-fectivities is divided into a finite number of equal compartments, where all values belonging to a particular compartment are con-sidered a single phenotype. Therefore, the larger the number of compartments the greater the accuracy of the simulation.
We assume that the initial pathogen population is monomor-phic and resides in a randomly chosen compartment. The position of pathogen offspring is determined according to the following rules. If, during reproduction, there is no change in phenotype, the offspring will have the same phenotypic characteristic as its parent and is placed in the same compartment.
If a change in phenotype occurs, an invader phenotype devel-ops and there are two possible outcomes regarding the compart-ment in which this individual with the new phenotype is placed. In the first outcome, the new phenotype is close to the phenotype of the parent. In this case, the offspring is placed in a neighboring compartment with equal probability of being on the left or on the right of the compartment of the parent. Such small changes in phenotype could occur due to changes in biochemical interactions between plants and pathogens. For example, a large number of biochemical reactions between plant and pathogens are involved in the infection process and are facilitated by pathogen enzymes (52). A change in the structure of an enzyme can result in a small change in the biochemistry of the infection process, resulting in a small change in infectivity.
In the second outcome, the offspring is phenotypically very dif-ferent from its parent and is placed in a random compartment distant from the parent. Such large changes in phenotype can, for example, arise in gene-for-gene relationships where a change in a particular genotype can result in a dramatic change in infectivity (11).
We also assume that changes in the phenotype occur suffi-ciently infrequently that the population has reached its steady-state before a new phenotype is introduced. Though this assump-tion is central to the framework of adaptive dynamics (12,22,44) used in this paper, the results of additional simulations show that the outcome of the evolutionary process is not sensitive to this assumption.
RESULTS
Our simulations indicate that the shape of the trade-off relation-ships determines the outcome of the evolutionary process. There are two qualitatively different outcomes.
Convex trade-off. Figure 3A and B shows the results of simulations for a convex trade-off. Figure 3A shows that, when only small changes in phenotype occur, the initially monomor-phic pathogen population with a certain infectivity to host 1 is, through a sequence of evolutionary steps, replaced by a pheno-type of different infectivity to host 1 until the neighborhood of some critical infectivity to host 1 is reached. At that point, the pathogen population splits into two subgroups, each with a differ-ent infectivity. These subgroups diverge in time and the residdiffer-ent phenotype is, at every evolutionary step, replaced by a phenotype with an infectivity to host 1 closer to the boundary of the pheno-typic interval [0, αmax]. At the boundary, the subgroups are
com-pletely host specialized and one subgroup infects only host 1 while the other infects only host 2. The same evolutionary out-come is observed in simulations where both large and small changes in phenotype are present (Fig. 3B).
In summary, the presence of multiple hosts and a convex trade-off between respective infectivities explains the branching of a
monomorphic population, initially infective to two hosts, into two host-specialized subgroups. This evolutionary outcome thus corresponds to sibling pathogens in group 1.
Concave trade-off. Figure 3C shows the results of simulations for a concave trade-off. In this case, an initially monomorphic pathogen population with a particular infectivity to host 1 will, at each evolutionary step, be replaced by another monomorphic population whose infectivity to host 1 approaches some critical infectivity, which represents the evolutionary end-point. Hence, a concave trade-off relationship between pathogen infectivity to different hosts is insufficient to explain evolutionary branching and occurrence of closely related sibling plant pathogens. In this case, a monomorphic population remains monomorphic and re-tains the capability to infect both hosts with pathogen infectivities evolving to intermediate values.
We have done simulations for a wide range of model parame-ters and results were qualitatively similar to those described previously.
DISCUSSION
In this study, the ideas of adaptive dynamics (12,22,44) are, for the first time, applied to the evolution of plant pathogens, focus-ing on identification of the ecological and epidemiological mechanisms influencing the evolution of sibling plant pathogens. The adaptive dynamic methods have proved valuable in the study of the evolution of animal and human diseases (13) and such studies provide an insight into the ecological and epidemiological mechanisms influencing pathogen evolution. The recent studies on the evolutionary responses of the pathogen to disease manage-ment and control (13) are of particular relevance to plant diseases. It is therefore expected that applying the adaptive dynamics method to plant diseases will provide insight into the relationship between plant disease management and evolution of plant patho-gens. In this paper, we have made a first step in demonstrating the
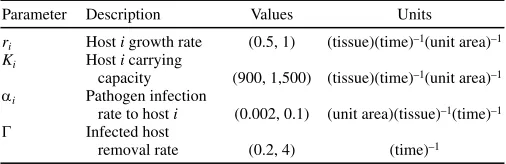
TABLE 2. Model parameters
Parameter Description Values Units
ri Host i growth rate (0.5, 1) (tissue)(time)–1(unit area)–1
Ki Host i carrying
capacity (900, 1,500) (tissue)(time)–1(unit area)–1
αi Pathogen infection
rate to host i (0.002, 0.1) (unit area)(tissue)–1(time)–1
Γ Infected host
removal rate (0.2, 4) (time)–1
Fig. 3.Simulations of the evolutionary dynamics of the infectivity of the pathogen to host 1 (x axis) in time (y axis). Note that using the trade-off relationship (Fig. 1), the infectivity of the pathogen to host 2 is given for each value of the infectivity of the pathogen to host 1. Initially, all pathogens have the same infectivity on host 1, α1 = 0.06 (and therefore the same infectivity to
host 2, α2= f(0.06)). Phenotypic changes result in changes in infectivity to
the hosts resulting in the evolution of this phenotypic trait. When the trade-off function has a convex shape (A and B), evolutionarily branching occurs and produces a dimorphic state where one pathogen is infective only to host 1 while the other pathogen is infective only to host 2. A,Only small changes in phenotype around the parent phenotype occur, whereas in B,small and large phenotypic changes can occur. In contrast, if the trade-off function has a concave shape (C), the pathogen population remains monomorphic with a single phenotype evolving to an evolutionarily stable strategy. The model parameters are r1 = 1, r2 = 1, K1 = K2 = 1,000, Γ = 0.1, and f(x) = B(x –
value of the adaptive dynamics methodology in the study of plant disease evolution. Using simple computer simulations, we have applied this methodology to a specific problem, providing an in-sight into the evolution of sibling plant pathogens.
The approaches to modeling evolution can be broadly catego-rized into population genetic models and epidemiological models (of which adaptive dynamics is one example). The population genetics approach has been used successfully in the study of plant pathogens, providing much insight into the evolution of fungicide resistance (35,45,49). Both the population genetic and the adap-tive dynamics methods have their limitations. Population genetic models usually consider only gene frequencies, omitting ecologi-cal interactions, which are often presented as a function of population densities. Such density dependencies at the population level can be incorporated into population genetic models, and including such interactions can greatly change the outcome of the evolutionary process (18). However, by including detailed eco-logical mechanisms such models quickly lose tractability. On the other hand, adaptive dynamics starts at the other end of the spec-trum, omitting any explicit reference to genetics. Although this could be viewed as a weakness, it allows one to focus on the eco-logical interactions within the system, considering the changes in the phenotype of the populations involved. The advantage of this approach is that more realistic aspects of the ecological inter-actions can be taken into account without jeopardizing the tracta-bility of the models. Therefore, the adaptive dynamics method can be viewed as a useful addition to the range of modeling ap-proaches adopted in plant pathology.
In this study, we show that sibling plant pathogens can be grouped on the basis of relative host specialization: a group in which the sibling pathogens are completely host specialized (group 1); a group in which some of the sibling pathogens are host specialized while others have a wide host range including the hosts of the specialized sibling pathogen (group 2); and a group of sibling pathogens that coexist on the same host or share a host range (group 3). This paper has examined the role of different host niches and a trade-off in infectivity to these hosts on the evo-lution of sibling plant pathogens. The assumptions regarding the model simulations were based on the adaptive dynamics method-ology, and the results obtained indicate that the evolutionary out-come depends on the shape of the trade-off curve.
If the trade-off curve follows a convex shape (Fig. 1), an ini-tially monomorphic pathogen population infective to both hosts will split during the course of evolution into two closely related subgroups that will become completely host specialized. How-ever, if the trade-off curve follows a concave shape (Fig. 1), an initially monomorphic pathogen population remains monomor-phic and branching does not occur.
These results are based on the assumption that new phenotypes arising in the population can have a phenotype that is either very close to or some distance away from the phenotype of the parent. This latter assumption reflects the observation for plant pathogens that large changes in infectivity to hosts can occur within one evolutionary generation. The resistance of cultivars is usually over-come by the pathogen with a limited number of genetic changes; a sequence of phenotypes gradually increasing in infectivity to the cultivar is an exception. If changes in phenotype lead to offspring that differ from the parental phenotype (44) by a small amount, a convex trade-off curve does not always lead to evolu-tionary branching (I. Gudelj, unpublished data). Instead, a morphic population will, under certain conditions, remain mono-morphic andbecome completely specialized on one of the hosts. We did not consider this case explicitly, because in practice, larger changes in infectivity are a common attribute of plant pathogen biology.
We conclude that the presence of multiple hosts and a convex trade-off relationship between pathogen infectivities on these hosts can explain the evolution of sibling pathogens that are
com-pletely host specialized (group 1). However, it cannot explain the presence of sibling pathogens represented in groups 2 and 3. Hence, other ecological mechanisms must be responsible for their occurrence. For example, a trade-off relationship between the amounts of rain-dispersed and wind-dispersed spores produced by a pathogen could be one such mechanism. Differences in the proportion of wind- or rain-dispersed spores produced have been observed among variants of Mycosphaerella spp. (Table 1, group 3), which are pathogenic on bananas and cause Sigatoka diseases. The more damaging Mycosphaerella fijiensis produces a larger number of ascospores (the wind-dispersed spores), whereas the less damaging Mycosphaerella musicola produces a larger num-ber of conidia (the rain-dispersed spores) (53). However, it is only conjecture that these differences are mechanistically associated. Another mechanism might be the seasonality of spore production in the case of monocyclic diseases. For example, a time
differ-ence between the appearance of symptoms of L. maculans and
L. biglobosa (Table 1, group 3) has been observed with the more damaging L. maculans occurring earlier in the growing season than the less damaging L. biglobosa. These and other possible ecological mechanisms influencing the evolution of sibling plant pathogens warrant further investigation.
Crop management and disease management practices put evo-lutionary pressure on plant pathogens. The evoevo-lutionary response of plant pathogens to develop resistance against a fungicide is one important example. Other types of evolutionary changes in plant pathogens under the influence of crop and disease management are less well studied, although they can have considerable effects on the epidemiology of the pathogen. For example, Ewald (17) studied the virulence of viroid-induced plant diseases in relation to disease transmission. He showed that the virulence of the viroid is correlated with the frequency of disease transmission by agri-cultural equipment (such as grafting and pruning, etc.) and argued that this mode of disease transmission promotes high virulence. To improve crop and disease management methods, it is important to understand the evolutionary consequences of human actions. Both population genetics and adaptive dynamics approaches are important modeling tools for doing this.
ACKNOWLEDGMENTS
Rothamsted Research receives grant-aided support from the UK Bio-technology and Biological Sciences Research Council. We thank I. Crute for helpful discussions.
LITERATURE CITED
1. Anderson, R. M., and May, R. M. 1982. Coevolution of hosts and para-sites. Parasitology85:411-426.
2. Baum, B. R., and Savile, B. O. 1985. Rust (Uredinales) of Triticeae: Evo-lution and extent of coevoEvo-lution, a cladistic analysis. Bot. J. Linn. Soc. 91:367-394.
3. Bierman, S. M., Fitt, B. D. L., van den Bosch, F., Bateman, G. L., Jenkyn, J. F., and Welham, S. J. 2002. Changes in populations of Tapesia yallun-dae and Tapesia acuformis (eyespot) under different fungicide regimes in successive crops of winter wheat, 1984–2000. Plant Pathol. 51:191-201. 4. Bowers, R. G., Boots, M., and Begon, M. 1994. Life-history trade-offs
and the evolution of pathogen resistance: Competition between host strains. Proc. R. Soc. Lon. B 257:247-253.
5. Brasier, C. M. 1987. The dynamics of fungal speciation. Pages 231-260 in: Evolutionary Biology of the Fungi. A. D. M. Rayner, C. M. Brasier, and D. Moore, eds. Cambridge University Press, Cambridge.
6. Bushnell, W. R., and Roelfs, A. P., eds. 1984. The Cereal Rusts. Academic Press, New York.
7. Campbell, C. L., and Madden, L.V. 1990. Introduction to Plant Disease Epidemiology.John Wiley & Sons, New York.
8. Carlile, M. J. 1987. Genetic exchange and gene flow: Their promotion and prevention. Pages 203-214 in: Evolutionary Biology of the Fungi. A. D. M. Rayner, C. M. Brasier, and D. Moore, eds. Cambridge University Press, Cambridge.
de-velopment within colonies of oat mildew. Physiol. Mol. Plant Pathol. 58:209-228.
10. Caten, C. E. 1987. The genetic integration of fungal life style. Pages 215-229 in: Evolutionary Biology of the Fungi. A. D. M. Rayner, C. M. Brasier, and D. Moore, eds. Cambridge University Press, Cambridge. 11. Crute, I. R. 1994. Gene-for-gene recognition in plant–pathogen
interac-tions. Philos. Trans. R. Soc. Lon. B 346:345-349.
12. Dieckmann, U. 1997. Can adaptive dynamics invade? Trends Ecol. Evol. 12:128-130.
13. Dieckmann, U., Metz, J. A. J., Sabelis, M. W., and Sigmund, K., eds. 2002. Adaptive Dynamics of Infectious Diseases. Cambridge University Press, Cambridge.
14. Doebeli, M., and Dieckmann, U. 2000. Evolutionary branching and sym-patric speciation caused by different types of ecological mechanisms. Am. Nat. 156(suppl.S):S77-S101.
15. Eriksson, J., and Henning, E. 1896. Die Getreideroste. Norstedt, Stockholm.
16. Erwin, D. C., and Ribeiro, O. K., eds. 1996. Phytophthora: Diseases Worldwide. The American Phytopathological Society, St. Paul, MN. 17. Ewald, P. W. 1988. Cultural vectors, virulence, and the emergence of
evolutionary epidemiology. Oxf. Surv. Evol. Biol. 5:215-245.
18. Fiers, M., van den Bosch, F., Debets, F., and Hoekstra, R. F. 1999. The dynamics of a senescence plasmid in fungal populations. Gen. Res. 74:13-22.
19. Förster, H., Oudemans, P., and Coffey, M. D. 1990. Mitochondrial and nuclear DNA diversity within six species of Phytophthora. Exp. Mycol. 14:18-31.
20. Fullerton, R. A., and Stover, R. H., eds. 1990. Sigatoka leaf spot diseases of banana: Proc. Int. Conf. Sigatoka Leaf Spot Disease of Banana, INIBAP, France.
21. Gandon, S., van Baalen, M., and Jansen, V. A. A. 2002. The evolution of parasite virulence, superinfection, and host resistance. Am. Nat. 159:658-669.
22. Geritz, S. H. A., Kisdi, E., Meszena, G., and Metz, J. A. J. 1998. Evo-lutionary singular strategies and the adaptive growth and branching of the evolutionary tree. Evol. Ecol. 12:35-57.
23. Geritz, S. H. A., Metz, J. A. J., Kisdi, E., and Meszena, G. 1997. The dynamics of adaptation and evolutionary branching. Physic. Rev. Letts. 78:2024-2027.
24. Gilligan, C. A., Gubbins, S., and Simons, S. A. 1997. Analysis and fitting of an SIR model with host response to infection load for a plant disease. Philos. Trans. R. Soc. Lon. B 352:353-364.
25. Green, G. J. 1971. Hybridization between Puccinia graminis tritici and Puccinia graminis secalis and its evolutionary implications. Can. J. Bot. 49:2089-2095.
26. Gubbins, S., and Gilligan, C. A. 1997. Biological control in a disturbed environment. Philos. Trans. R. Soc. Lon. B 352:1935-1949.
27. Hansen, E. M., and Maxwell, D. P. 1991. Species of the Phytophthora megasperma complex. Mycologia 83:376-381.
28. Hassell, M. P. 1976. The Dynamics of Competition and Predation. Edward Arnold, London.
29. Heath, M. C. 1987. Evolution of parasitism in the Fungi. Pages 149-160 in: Evolutionary Biology of the Fungi. A. D. M. Rayner, C. M. Brasier, and D. Moore, eds. Cambridge University Press, Cambridge.
30. Holliday, P. 1989. A Dictionary of Plant Pathology. Cambridge University Press, Cambridge.
31. Inman, A. J., Sivanesan, A., Fitt, B. D. L., and Evans, R. L. 1991. The biology of Mycosphaerella capsellae sp. nov., the teleomorph of Pseudo-cercosporella capsellae, cause of white leaf spot of oilseed rape. Mycol. Res. 95:1334-13342.
32. Jarvis, W. R. 1977. Botryotinia and Botrytis Species: Taxonomy, Physiol-ogy, and Pathogenicity; A Guide to the Literature. Tech. Rep. Res. Branch, Can. Dep. Agric. Monog. No. 15.
33. Johnston, T. 1933. Proceedings of the world’s grain exhibition and conference. Canadian Grain Commission, Canada.
34. Kuan, T. L., and Erwin, D. C. 1980. Differentiation of soybean and alfalfa isolates of Phytophthora megasperma. Phytopathology 70:333-338. 35. Leonard, K. L. 1977. Selection pressures and plant pathogens. Ann. N.Y.
Acad. Sci. 287:207-222.
36. Levin, S. A. 1983. Some approaches to the modeling of coevolutionary interactions. Pages 21-65 in: Coevolution. M. H. Nitecki, ed. University of Chicago Press, Chicago.
37. Limpert, E., Godet, F., and Müller, K. 1999. Dispersal of cereal mildews across Europe. Agric. For. Meteorol. 97:293-308.
38. Lucas, J. A., Dyer, P. S., and Murray, T. D. 2000. Pathogenicity, host-specificity and population biology of Tapesia spp., causal agents of eyespot disease of cereals. Adv. Bot. Res. 33:226-258.
39. Mather, K. 1955. Polymorphism as an outcome of disruptive selection. Evolution 9:52-61.
40. May, R. M., and Anderson, R. M. 1983. Epidemiology and genetics in the coevolution of parasites and hosts. Proc. R. Soc. Lon. B. 219:281-313. 41. Maynard Smith, J. 1966. Sympatric speciation. Am. Nat. 100:637-650. 42. Mendes-Pereira, E., Balesdent, M. H., Brun, H., and Rouxel, T. 2003.
Molecular phylogeny of the Leptosphaeria maculans and L. biglobosa species complex. Mycol. Res. 107:1287-1304.
43. Menzies, J. G., and MacNeill, B. H. 1989. Infection of species of the gramineae by Erysiphe graminis f. sp. hordei and Erysiphe graminis f. sp. tritici. Can. Plant Dis. Surv. 69:105-108.
44. Metz, J. A. J., Geritz, S. H. A., Meszena, G., Jacobs, F. J. A., and van Heerwaarden, J. S. 1996. Adaptive dynamics: A geometrical study of the consequences of nearly faithful reproduction. Pages 183-231 in: Stochastic and Spatial Structures of Dynamical Systems. S. J. Van Strien and S. M. Verduyn Lunel, eds. North-Holland, Amsterdam.
45. Milgroom, M. G. 1990. A stochastic model for the initial occurrence and development of fungicide resistance in plant pathogen populations. Phytopathology 80:410-416.
46. Milgroom, M. G., and Peever, T. L. 2003. Population biology of plant pathogens. Plant Dis. 87:608-617.
47. Rayner, A. D. M., Brasier, C. M., and Moore, D., eds. 1987. Evolutionary Biology of the Fungi. Cambridge University Press, Cambridge.
48. Robbertse, B., Campbell, G. F., and Crous, P. W. 1995. Revision of Pseudocercosporella-like species causing eyespot disease of wheat. South African J. Bot. 61:43-48.
49. Shaw, M. W. 2000. Model of the effects of dose heterogeneity and escape on selection pressure for pesticide resistance. Phytopathology 90:333-339. 50. Shoemaker, R. A., and Brun, H. 2001. The teleomorph of the weakly
ag-gressive segregate of Leptosphaeria maculans. Can. J. Bot. 79:412-419. 51. Spencer, D. M., ed. 1978. The Powdery Mildews. Academic Press,
London.
52. Stahl, E. A., and Bishop, J. G. 2000. Plant-pathogen arms races at the molecular level. Curr. Opin. Plant Biol. 3:299-304.
53. Stover, R. H. 1980. Sigatoka leaf spots on bananas and plantains. Plant Dis. 64:750-756.
54. van den Bosch, F., Frinking, H. D., Metz, J. A. J., and Zadoks, J. C. 1988. Focus expansion in plant disease. III. Two experimental examples. Phytopathology 78:919-925.
55. van Ginkel, M., McNab, A., and Krupinsky, J., eds. 1999. Septoria and Stagonospora Diseases of Cereals: A Compilation of Global Research. CIMMYT, Mexico.
56. Wardlaw, C. W., ed. 1972. Banana Diseases. Longman, London. 57. West, J. S., Kharbanda, P. D., Barbetti, M. J., and Fitt, B. D. L. 2001.
Epidemiology and management of Leptosphaeria maculans (phoma stem canker) on oilseed rape in Australia, Canada and Europe. Plant Pathol. 50:10-27.
58. Williams, R. H., and Fitt, B. D. L. 1999. Differentiating A and B. groups of Leptosphaeria maculans causal agent of stem canker (blackleg) of oilseed rape. Plant Pathol. 48:161-175.