Issues
ISSN: 2146-4138
available at http: www.econjournals.com
International Journal of Economics and Financial Issues, 2017, 7(4), 433-447.
International Financial Reporting Standards Convergence and
Quality of Accounting Information: Evidence from Indonesia
Hasyyati Yusrina
1, Mukhtaruddin Mukhtaruddin
2*, Luk Luk Fuadah
3, Zunaidah Sulong
41Faculty of Economics, University of Sriwijaya, Palembang, Indonesia, 2Faculty of Economics, University of Sriwijaya, Palembang,
Indonesia, 3Faculty of Economics, University of Sriwijaya, Palembang, Indonesia, 4Faculty of Economics, Accounting and
Management Science, Universiti Sultan Zainal Abidin, Kuala Terengganu Malaysia. *Email: yuditz@yahoo.com
ABSTRACT
The International Financial Reporting Standards (IFRS) initiated by International Accounting Standard Board are principle-based standard that require extensive disclosure of financial statements and accounting information as compared to prior standard that is the generally accepted accounting principles to better reflect the overall quality of company’s performance. Therefore, the IFRS convergence is expected to improve the reliability of financial reporting by limiting opportunistic managerial discretion. The conjecture is the mandatory adoption of IFRS will reduce the managerial discretionary behaviors to engage in earnings management practices, thus improving earnings quality and value relevance of accounting quality information. High quality of accounting information in terms of earnings quality and value relevance can stimulate investors’ behavior in the stock market exchange. This study utilises a sample of 110 manufacturing sector companies for the years 2009-2014, to include pre-IFRS (2009-2011) and post-IFRS period (2012-2014). The data is analyzed using multiple regression technique by using the pooled least square mesthod. The results of earnings management model of the study indicate that there are significantly positive relationship between size and leverage on earnings management. Whereas, the level of gross fixed assets is found to have a significant negative effect on earnings management. While, value relevance model the result shows there are significantly positive relationship between earnings per share, book value per share and size. Whereas, the leverage is shows significantly negative effect to earnings management. Overall, this study provides evidence of effect of IFRS convergence on the quality of accounting information is increase in term of value relevance but decrease in term of earning management.
Keywords: International Financial Reporting Standards Adoption, Earning Quality, Earning Per Share, Book Value Per Share
JEL Classifications: M41, G11
1. INTRODUCTION
1.1. Background of the Study
Financial reporting landscape has undergone massive changes in 2005 when the companies in the world adopt International Financial Reporting Standards (IFRS) as the basis for the preparation of financial statements. In 2002, European Union (EU) has approved regulation obligate all EU companies listed on stock market (about 8000 Companies) to follow IFRS in the consolidated financial statements of the company in their respective jurisdiction (Deloitte, 2014). The adoption of IFRS has significant benefits in producing high-quality financial reporting in EU countries (Hibbard, 2012). However, the adoption of IFRS is judged to be a considerable challenge because it depends on the economic situation, the coherence
of the regulatory framework and infrastructure related institutions.
Indonesia as a member of the group of twenty (G20) has agreed to carry out the convergence of local accounting standards to IFRS. Convergence to IFRS is one agreement among G20 members agreed at G20 conference in Washington, DC, November 15, 2008. Besides, the high flows of investment to Southeast Asia region further motivate companies to attract the attention of global investors to the local stock market. Especially Indonesia as the highest recipient of Foreign Direct Investment flows in 2014 in Southeast Asia region based on reports issued by the United Nations Conference on Trade and Development.
Since 1994, Indonesia has made the process of harmonization with the IAS. Based on comparison of data carried out by Satrio (2007) shown Indonesia in 2007 has adopted 57 IAS/IFRS, 20 US generally accepted accounting principles (GAAP) and 1 accounting standards on Shariah based Accounting and Auditing Organization for Islamic Financial Institution. The process has continued with the convergence of IFRS, which began in 2008, all the standards that have been in the convergence of IFRS are expected to be implemented by companies listed on the Indonesian stock exchange in 2012.
Prior studies are conducted to determine the quality of the accounting information that can be reflected on the earnings quality. High earnings quality occurs when lower earnings management practices (Levitt, 1998). High earnings management practices indicate the disclosed financial statements have received certain treatment from the managers to accommodate manager interests to maximize bonuses and compensation (Dechow, 1995).Therefore, IASB has made IFRS to remove the allowable alternative accounting standards and requires accounting measurements that reflect the state of the economic position and performance of the company better. It makes the adoption of IFRS will significantly reduce the company the opportunity to engage in earnings management and improve the quality of information disclosed (Dimitropoulos, 2013).
Based on the research conducted by Chua et al. (2012) shown that companies that have converge to IFRS increase the quality of accounting, reduced earnings smoothing, more timely loss recognition and decreasing evidence of earnings management. Contrarily, it can also have the opposite effect which limits managerial discretion can eliminate the ability of the company to report accounting measures that better reflect company economic position and the performance, also when the application of this standard is still lax company can engage in income smoothing (Dimitropoulos, 2013). It is hoped that the findings of this study will bridge the gap in theoretical and empirical evidence related to the effect of IFRS convergence to quality of accounting information disclosed in the financial statements of manufacturecompanies listed on the Indonesian stock exchange market.
The case of corporate collapsed such as Enron in 2001 make investors more cautious in making investment decisions, especially regarding the earnings information (Li, 2010). Earnings which have been the primary source of information investors to determine the performance of the company became the main target window
dressing. As being explain by Dechow (1995) higher quality earnings provide more information about the features of a firm’s financial performance that is relevant to a specific decision made by a specific decision-maker”. Generally, earnings quality can be defined as earnings that provide information about the features in a financial statement of a company that is useful as an input in decision making process. IASB has created a standard that minimizes the gaps that have been used by managers in performing earnings management.
Yet, academic discussion on the effect on the quality of IFRS financial statements still show mixed results. The research used a sample of 327 companies 21 countries in year 1994-2003 showed that after the adoption of IFRS the company showed a decrease in earnings management significantly compared before adopting IFRS (Barth et al., 2008), another study also shows that IFRS had an impact on the variability and persistence of income and reduction of income distribution which of course will produce higher quality financial statements (Doukakis, 2010). Research on the effect of the implementation of IFRS on earnings management and value relevance indicates that the IFRS implementation proved to decrease the scope of earnings management, accelerated recognition of losses and higher value relevance (Iatridis, 2010).
On the contrary, Gordon (2010) has shown that there are no significant changes between the quality attributes of income (accrual quality, earnings persistence, cash flow persistence, earnings predictability, earning smoothness) on US GAAP and IFRS except value relevance. On top of that, previous research examined the impact of the adoption of IFRS by observing 1146 companies from Australia, France, and the UK from 2005 to 2006 and found no evidence that earnings management in these countries do not become lower, even rising to France (Jeanjean and Stolowy, 2008). Therefore, this study addresses the questions of how the IFRS convergence will effect on the quality of accounting information?
2. LITERATURE REVIEW
2.1. Agency Theory
Managers as corporate managers more aware of internal information and the company’s prospects in the future compared to the principal (shareholders). However, sometimes the information provided does not correspond to the actual condition of the company. This condition is known as asymmetric information. Asymmetry between the management (agent) with the owner (principal) gave an opportunity for managers to act opportunistically, e.g. personal gain. In terms of financial reporting, managers can conduct earnings management to mislead the owners (shareholders) of the company’s economic performance.
Jensen and Meckling (1976) stated that the financial statements prepared by the managerare expected to minimize conflicts among the parties concerned. With the financial statements prepared management, principals can assess the performance of management to report earnings corresponding personal interests. If earning management happen then it would result in lower earnings quality. Jensen also stated that agency theory broadened this risk-sharing literature to include the so-called agency problem that occurs when cooperating parties have different goals and division of labor (Jensen and Meckling, 1976).
The agency theory is focus on resolving two problems that arise that occurs in the agency-principal relationship. The first is the desirable goal of principal and agent conflict and the difficulties of the principal to verify that the agent has behavedappropriately. The second is the problem of risk sharing that arise and the different attitude of agent and principal towards risk. And because the principal and agent may have different attitude towards the risk preferences (Eisenhardt, 1989).
In addition, US GAAP gives flexibility principles to the company in selecting the accounting methods used in the preparation of financial statements. With these concessions, the company can produce different profit value through the selection of different accounting methods (e.g., ,FIFO and LIFO Inventory Method). Companies that choose straight-line methods depreciation will generate profits of different values compared to companies that use methods digit year or declining balance (Niemeier, 2008). This will be resulting in the lower earnings quality.
2.2. Signaling Theory
Signaling theory emphasizes the importance of information released by the company to investment decisions outside the company. Information is an important element for investors and businessmen because the information is essentially presenting the information, record or good overview of the state of the past, present and future circumstances for the survival of a company and how the market effect.
The complete, relevant, accurate and timely information is needed by investors in the capital market as an analytical tool to make investment decisions. The information published as an announcement will give a signal to investors in making investment decisions. If an announcement contains a positive value, it is expected that the market will react to the timing of the announcement is received by the market. At the time the information was announced, all market participants have received
the information, and then market participants beforehand interpret and analyze that information as positive signals or negative signal. If the announcement is contain of positive signal for investors, and then there is a change in the volume of stock trading. Announcement of Accounting information give signals that the company has good prospects in the future so that investor will be interested to trade their shares, thus the market will react, reflected through changes in the volume of stock trading.
Therefore, the relationship between the publication of information both financial statements, financial condition or socio-political to the fluctuations in the volume of stock trading can be seen in the efficiency of the market. One type of information released by the company that can be a signal for outside parties the company, especially for investors is the annual report. The information disclosed in the annual report may include accounting information that is information relating to the financial statements and non-accounting information that is information relating to the financial statements. The annual report should contain information that is relevant and revealing information that is considered important to be known by the user reports both the inside and outside. All investors need information to evaluate the relative risk of each company so that they can diversify their investment portfolio and the combination with the desired risk preferences. If a company wants its shares purchased by the investor, the company must make disclosure of financial statements in an open and transparent.
Signaling theory classifies the signal into two major groups, namely the direct signal and indirect signal. The direct signal is reflected in the disclosures in the financial statements. While the indirect signal is not directly related to the number of the sustained equity, quality audits, capital structure, dividend policy, the selection of accounting policies, and publications forecasting firm. Accounting standards in force in a country will influence the behavior of managers in sending a signal to investors. Scott (2009) states that a standard that encourages the establishment of uniformity in accounting would reduce the ability of the manager to send a signal to investors. On the other hand, the convergence of accounting standards towards an internationally accepted standard that will improve the comparability of the financial statements so that the signal received by investors reflects the actual economic value of the company. From the standpoint of the state, the establishment of accounting standards that ensure transparent disclosure is a signal of a commitment to provide better protection to the investor (Hope et al., 2006).
Signaling theory explains that the signal is done by managers to reduce asymmetry information. Managers provide information through the financial statements about the accounting policy they apply the accounting policy of conservatism to produces higher quality earnings because this principle prevents the company taking action to exaggerate profits and helps users of financial statements to present the earnings and assets not overstate.
more aware of the internal information and the company’s prospects in the future compared to external companies. The information for the provision of corporate bond ratings published is expected to be a signal of a particular company’s financial condition and illustrates the possibilities that occur related to debt held.
2.3. IFRS
The IFRS is IASs made by the IASB, which at the beginning of the formation called the IAS Committee (IASC). IASC was formed in London, England in 1973 at the time was a fundamental change in the rules relating to accounting. Natawidnyana (2008) states that most of the standards in IFRS were part of the IAS before it become IFRS. Previously there has been some research that indicates that the adoption of IFRS generally able to improve the quality of accounting standards in most countries(Chen et al., 2010). Research conducted by Ashbaugh and Pincus (2001) proved that superior IFRS compared to US GAAP and local GAAP of a country, in the perspective of the quality of financial statements that reflected in earnings quality.
This research distinguished between the adoption of IFRS and convergence IFRS. At the state level, adoption means that national accounting standards are directly replaced with IFRS. This position was taken by the member countries of the EU since 2005 to impose IFRS in full. Meanwhile, convergence is gradual mechanism conducted by a country to change its national accounting standards with IFRS. Convergence is found in developing countries (Kvaal and Nobes, 2010). Although not a full adoption, convergence showed minimal differences with IFRS. The difference is in terms of time or a bit of an exception in the application specific standard settings. Research in this study refers to the convergence of IFRS conducted in Indonesia.
2.4. Development of Accounting Standards in Indonesia
In the period 1973-1984, Indonesian Accounting Institute (IAI) has established a Committee on Accounting Principles Indonesia to set accounting standards, which became known as the Indonesian Accounting Principles (IAP). In 1986, IAP has made Indonesia accounting standard in accordance to US GAAP.
In the period 1984-1994, the committee IAP substantially revised in 1973 and then published the IAP in 1984. At the end of 1994, the
accounting standards committee embarked on a major revision of the principles of accounting Indonesia by announcing statements and issuing accounting standards additional interpretation of these standards. The revision resulted in 35 statement of financial accounting standards, are largely harmonized with IAS issued by the IASB.
In the period 1994-2004, there were changes in accounting reference from US GAAP to IFRS. It has become the policy of the Financial Accounting Standards Committee (FASC) to use IASs as a basis for establishing standards of financial accounting Indonesia. In 1995, IAI undertake major revisions to implement the new accounting standards, which is most consistent with the standard IAS. Severaladoptionsare made from US GAAP and the others made by IAI.
The convergence of IFRS in first phase started in 1995-2010. IFAScontinue to be revised on an ongoing basis, either improvement or addition of new standards (Figure 1). The revision process carried out 6 times that on October 1, 1995, June 1, 1999, April 1, 2002, October 1, 2004, June 1, 2006, September 1, 2007, and version 1 July 2009.
In 2006, X congress of IAI held in Jakarta to determine that full convergence of IFRS will be completed in 2008. The target when it is fully abiding by all IFRS standards in 2008. However, the journey was not easy. Until the end of 2008 the number of new IFRS adopted IFRS standards reached 10 out of total 33 standards. This issue force IAI to extendthe full convergence process until 2012.
IFRS convergence is one of the agreements the government of Indonesia as a member of the G20 forums, results of the meeting of leaders of G20 forum in Washington, DC, November 15 2008 as the principles of the G20 that was declared as to strengthening transparency and accountability, enhancingregulation, promoting integrity in financial markets, reinforcing international cooperation and reforming international financial institutions.
Indonesia’s approach to IFRS adoption is to maintain its national GAAP (Indonesian Financial Accounting Standards, IFAS) and converge it gradually with IFRSs as much as possible. Currently there is no plan for a full adoption of IFRS.Indonesia is striving
Figure 1: Indonesia first phased of convergence process
to minimize the significant differences between IFRSs and IFAS gradually. Since 2012, the local standards applied in Indonesia are based on those IFRS that were effective at 1 January 2009. However, some modifications were made. Indonesia will continue the convergence process by considering recent amendments, newer standards (e.g., IFRSs 9-13), and IFRS Exposure Drafts.
Currently, the FSAC is committed to maintain a 1 year difference with IFRS as issued by the IASB until Indonesia decides when it will go for full adoption. Therefore, the expectation to converge IFAS with IFRS as they stood on1 January 2014 as of 1 January 2015, with IFRSs as they stood on 1 January 2015 as of 1 January 2016 etc. unless there is a reason not to do so. For example, IFRS 9 will not be adopted piecemeal; Indonesia is waiting until all phases are completed before considering adopting the standard.
Indonesia will also consider results from the implementation of the first wave of standards resulting from the convergence process before new standards are developed. The jurisdiction will also provide for transition periods of 3-4 years for new standards, however, Indonesia is striving at the same time to keep the gaps between the effective dates of new IFRSs and new IFASs that are based on them as short as possible. Domestic listed companies do not have the option to fully comply with IFRS. But to fully comply with the IFAS that has been in line with IFRS.
Meanwhile, in the process to converge to IFRS there are some obstaclesfaced by IAI, such as (1) lack of resources in Indonesia Accounting Standards Board, (2) IFRS changing too fast so that when the process of adopting an IFRS standard is done, the IASB is already in the process of replacing the IFRS, (3) the language barriers, because each IFRS standard must be translated intoIndonesian and often is not easy, (4) infrastructure accounting profession who are not yet ready. To adopt IFRS many new accounting method that must be learned again by accountants, (5) readiness college educators and accountants to switch to IFRS, (6) SUPPORT the government to issue convergence, (7) meanwhile, there also some benefits of IFRS convergence in general are (a) facilitates an understanding of financial statements by the use of IFRS and to enhance the comparability of the local standard, (b) increase global investment flows through transparency, (c) lowering the cost of capital by fund raising opportunities through the global capital market, (d) creating efficiency of financial statements, and (e) improving the quality of financial reports, with among other things, reducing the chance to perform earnings management.
2.5. Earnings Quality
The main objective of the company is increasing the value of the company. The low quality of earnings will lead mistake in decision making process of the financial statement user such as investors and creditors, so that the value of the company will be reduced (Siallagan and Machfoedz, 2006). Bellovary et al. (2005) earnings quality is the ability of earnings to reflect the truth of the company’s profit and help reflect future earnings, taking into account the stability and persistence of earnings. The quality of financial statement will be doubtful when the profit as part of the financial statements do not present the actual facts about
the economic condition of a company. If such earnings are used by investors to establish the market value of the company, then profits cannot explain the actual market value of the company (Boediono, 2005).
According to SFAC No. 1, define earning quality as follows: “High-quality earnings provide more information about the features of a firm’s financial performance that is relevant to a specific decision made by a specific decision-maker”. In accounting research literature, there is different understanding of the quality of earnings in the usefulness perspective on decision making. Grouping constructs and earnings quality measurement based on the way determining the quality of earnings, which is based on: The nature of time-series of profit, qualitative characteristics the conceptual framework, relationship cash income-accrual and implementation decisions (Shipper, 2003). In this study earning quality will be measure based cash-income-accrual quality by measuring the discretional accrual which also use to measure earning management practice in the company. And also based on the qualitative characteristics the conceptual framework from financial accounting standard board by measuring value relevance of financial statement.
However, earnings quality is a multidimensional concept that can be viewed from different angles (Shipper, 2003). There is no definite size or precisely measure how much the quality of earnings of the financial statements, there is only an approximation used for the earnings quality proxies. Therefore, the measurement of earnings quality used by one researcher with the other researchers will be different. In this research, the measurement of earnings quality will be proxy by earning management and value relevance.
2.6. Earning Management
CEOs nearing retirement would tend to raise revenue to improve their bonus and if the poor performance of the company will maximize revenues in order not to be dismissed, (d) IPO. Profit information as a signal of the company’s value on IPO. This resulted that managers of companies that will go public did earnings management to raise the company’s stock price, and (e) The Importance of Providing Information to Investors. Information on the company’s performance must be delivered to the investor so that the earnings reporting needs to be presented so that investors still judge that the company is in a good performance.
Previously some previous research found that companies disclose financial statements by IFRS less engage in earnings management they are based in countries with developed equity markets, dispersed ownership structures, strong investor rights, and legal enforcement (Leuz et al., 2003). Barth et al. (2008) found that firms adopting IFRS experience improved accounting quality, including less evidence of earnings smoothing, less evidence of earnings management towards a target, more timely recognition of losses and a higher association with share prices. Ewert and Wagenhofer (2005) suggested that high-quality accounting standards reduces earnings management and improve the quality of reporting. Moreover, recent studies by Kabir et al. (2010) examined the discretionary accruals (DAC) New Zealand company adopts IFAS. They also found that absolute DAC were significantly higher under IFRS than under pre-NZ GAAP. On the other side, Van Tendeloo and Vanstraelen (2005) examined the DAC German company adopting IASs they found that companies IAS have more DAC and the lower correlation between accruals and cash flows.
2.7. Value Relevance
Barth et al. (2001) define accounting as value relevant if it has a predicted association with equity market values. When this study reconcile this to earnings, define the value relevance of earnings as the degree to which accounting earnings summarize information impounded in market prices (Brown, 2006). Further reconciliation reveals that a higher quality of earnings reflects better a firm’s underlying economics and is therefore more value relevant for users of the financial statements (Barth et al., 2001). One of the first value relevance studies was done by Miller and Modiglian, (1966) although these authors did not use the term value relevance, they were performing a study that used data on the market values of securities to identify drivers that influence prices or returns. Miller and Modiglian (1966) attempt to develop effective methods for inferring the cost of capital relevant for optimal investment decisions from data on the market value of securities.
Another well-known paper written at that time is the seminal paper of Ball and Brown (1968). In this paper Ball and Brown (1968) examine associations between accounting earnings and stock returns, but also did not use the notion “value relevance”. In contrast, Amir et al. (1993) were the first to use extensively the term “value relevance” for describing the association between accounting amounts and equity market values (Barth et al., 2001).
The previous study of value relevance and its relation to earning quality show mixed results. For example, studies of the change in value relevance for German firms electing to use IFRS as the basis
of financial reporting rather than German GAAP report evidence of declining, increasing, and no change in the relevance of earnings associated with voluntary IFRS adoption (Hung and Subramanyam, 2007). Bartov et al., (2005) test association for German firms that voluntarily adopted IFRS standards between 1998 and 2000. They report no significant improvement in the association between returns and earnings following the adoption. Among others, studies investigating the effect of changes in accounting standards have found that earnings quality is significantly affected by the change indicated in value relevance models.
Hung and Subramanyam (2007) using German firms switching from German GAAP to IFRS during the period 1998 and 2002 find that the value relevance of book value of equity is not significantly different between the two accounting systems, whereas earnings are more value relevant under German GAAP. However, Jermakowicz (2007) report an increase in the explanatory power of earnings and book value of equity after the voluntary adoption of IFRS for a sample of DAX-30 firms from 1995 to 2004. Using a Norwegian setting, Gjerde and Knivsflå (2008) find that book value of equity is more value relevant under IFRS, whereas earnings are more value relevant under Norwegian GAAP employing a price model.
2.8. Hypotheses Development
This research is conductedto empiricallyexamine about whether the IFRS adoption can truly see as uniform high-quality reporting standard by calculating total accrual using Kothari et al. (2005) model in pre-IFRS and post-IFRS. Previous study examined the accounting quality before and after the introduction of IFRS by using a sample of 327 companies in 21 countries that have adopted IAS voluntarily between 1994 and 2003 (Barth et al., 2008). Barth et al. (2008) found evidence that after the introduction of IFRS, increasing the quality of income, and more timely loss recognition, compared with the period before the transition in which the accounting is based on local GAAP. Ewert and Wagenhofer (2005) states that tightening accounting standards reduces earning management and leads to higher quality of information in financial statement. Based on prior study the first hypothesis as follow: H1: Accounting quality, in term of earnings management will be higher after IFRS convergence period (post-IFRS).
of value relevance will be higher after IFRS convergence period (post-IFRS).
2.9. Research Framework
The theoretical framework for this research is illustrated as in the Figure 2. The figure is construct following to the research question and research hypotheses stated in previous chapter. The research framework above suggests that earnings quality depends upon the standard use in the country. As seen from the Figure 2, this study initially intends to serve one main purpose to ascertain the increasing of accounting information after IFRS convergence. By, identifying to what extend IFRS convergence is influencing earning management level and also identifying the effect of IFRS convergence towards the value relevance. This study also intend to expand the previous works done by Wan Ismail et al. (2013), Barth et al. (2008), Dimitropoulos et al. (2013) and Masako (2011) by focusing the attention to the manufacturing companies on Indonesia Stock Exchange.
3. RESEARCH METHODOLOGY
3.1. Data Description and Sample Selection
In Indonesia, performance of national industry in 2011 was encouraging, non-oil-and-gas manufacturing sector grew significantly by 6.83%, higher than GDP growth around 6.5%. The growth of industry sector in 2011 was the highest growth since 2005. Manufacturing sector contributed 24.3% or much higher than agriculture, livestock, forestry, and fisheries (14.7%), as well as trade, hotels, and restaurants (13.8%). Non-oil-and-gas manufacturing sector in 2011 accounted for approximately 20.9%.
In this study researcher try to analyze the effect of IFRS convergence to earning quality in manufacture companies listed on Indonesia capital market. Because, in Indonesia stock exchange the number of manufacture companies has biggest population compare to another sector and has biggest influence to the country industrial performance. So, this study findings will able to reflect the condition of listed companies in Indonesia.
The sample is part of the population is taken through certain ways that have the specific characteristics, clear and complete that can be considered representative of the population. Given the relatively large number of the population, to the efficiency of research conducted sampling in order to obtain a representative sample in accordance with the specified criteria.
The sample selection of this study is listed companies in Indonesia in pre-IFRS convergence capture from 2009 to 2011 and post-IFRS convergence in year 2012-2014 (Table 1).
3.2. Variables Measurement
3.2.1. Earning management
Earnings management practices are measured to determine the quality of earnings at companies listed on the Indonesian stock exchange. Measurement of earning management using magnitude of performance-matched discretionary accrual. Using cross-sectional Jones (1991) model modified by Kothari et al. (2005) to extract the DAC following performance-matched approach. This model estimate discretionary accrual as a function of change in sales, level of property, plant and equipment, and the ratio of return on assets. According to Jones (1991), changes in revenue are included to control the economic circumstances of firms.
DAC are the difference between total accruals and non-DAC (NDAC) as shown below:
DACi,t = TACCi,t−NDACi,t (1a)
Where,
DAC = Discretionary accruals,
NDAC = Non-discretionary accruals,
TACC = Total accruals,
i,t = Company i year t.
Figure 2: Research framework
Table 1: Sample criteria
Sample criteria Total company in
The manufacturing sector company listed on Indonesia stock exchange during the period 2009-2014
150
The manufacturing sector company publish the complete financial statements in the period 2009-2014
122
The data use in this study is available in
DataStream 110
Chosen sample 110
×6 years observation 660 firm year
In order to get the value of DAC, the value of total accrual should be estimate as follows:
TACCi,t = NIi,t−OCFi,t (1b)
Where,
TACC = Total accruals,
NI = Net Income before extraordinary items,
OCF = Cash flows from operating activities,
i,t = Company i year t.
While, NDAC or normal accruals are estimated during the year is approximated as follows;
NDACi,t = α1(1/TAit-1)+α2(ΔSalesit/TAit-1) +α3PPEit/TAit-1+α4ROAit. (1c)
Where,
NDAC = Nondiscretionary accruals,
ΔSales = Change in sales,
PPE = Plant, property and equipment,
ROA = Return on assets,
TA = Total assets,
i,t = company i year t.
According to equation above the estimate value of DAC can be obtained as the residuals (ɛ/error term) of the following equation:
Where:
TACC = Total accruals (net income and cash flow from operation/ lagged total assets),
ΔSales = The change in net sales deflated by lagged total assets (Salesit - Salesit-1),
PPE = The level of property, plant and equipment for each year deflated by lagged total assets,
ROA = The end year return on assets estimated as net income over total assets,
TA = firm’s total assets at the end of fiscal year.
By deflating variables with total assets model provide additional control for heteroscedascity (Kothari et al., 2005). Additional profitability measure (ROA) is designed to enhance the effectiveness of the performance matching methodology. A constant term mitigate the problem rise in producing discretional accrual measure that are more symmetric, overcoming model misspecifications and making the power of the test comparisons more clear (Dimitropoulos, 2013).
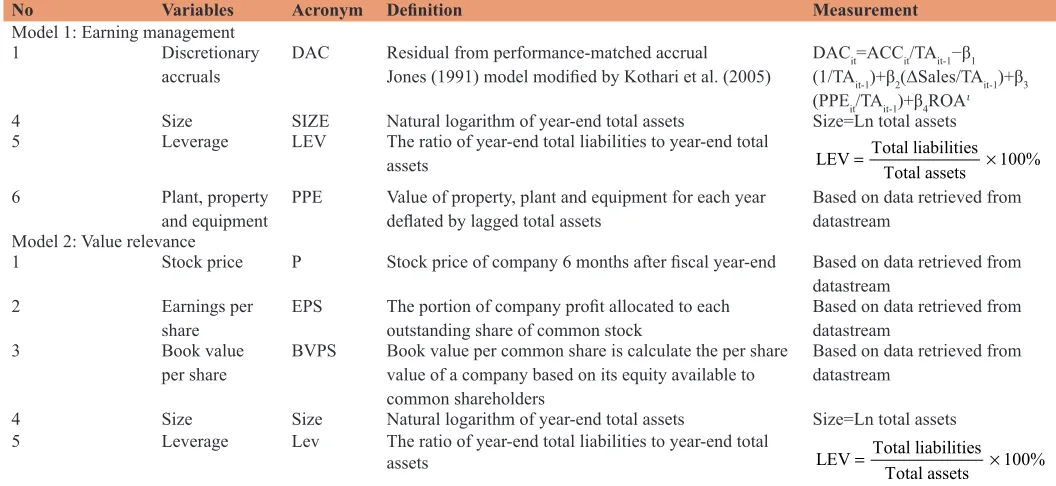
Table 2: Variables measurement summary
No Variables Acronym Definition Measurement
Model 1: Earning management
1 Discretionary
accruals DAC Residual from performance-matched accrual Jones (1991) model modified by Kothari et al. (2005) DAC(1/TAitit-1=ACC)+β2(ΔSales/TAit/TAit-1−β1 it-1)+β3 (PPEit/TAit-1)+β4ROAi
4 Size SIZE Natural logarithm of year-end total assets Size=Ln total assets
5 Leverage LEV The ratio of year-end total liabilities to year-end total
assets LEV= Total liabilitiesTotal assets 100%×
6 Plant, property
and equipment PPE Value of property, plant and equipment for each year deflated by lagged total assets Based on data retrieved from datastream Model 2: Value relevance
1 Stock price P Stock price of company 6 months after fiscal year-end Based on data retrieved from
datastream
2 Earnings per
share EPS The portion of company profit allocated to each outstanding share of common stock Based on data retrieved from datastream
3 Book value
per share BVPS Book value per common share is calculate the per share value of a company based on its equity available to common shareholders
Based on data retrieved from datastream
4 Size Size Natural logarithm of year-end total assets Size=Ln total assets
5 Leverage Lev The ratio of year-end total liabilities to year-end total
assets LEV Total liabilities 100%
Total assets
In order to capture the difference in earnings management before and after IFRS convergence the researcher included several variables that has been suggested in previous research as the influencing factor in earnings management practice. First, firm size measure as the natural logarithm of total assets (LnTA). Van Tendeloo and Vanstraelen (2005) and Watts and Zimmerman (1990) argue that larger firms are more likely to downward earnings management because the potential for government scrutiny increases as firms become larger and more profitable. Therefore, the researcher expects the negative relation between the firm size and absolute DAC. Beekes et al. (2004), and Vafeas et al. (1998) argue that earning should be more informative for smaller firms since there is less media information available compare to larger firms. But, on the other side larger firms draw more publicity and are more closely followed, thus their earnings quality is likely to be known with less uncertainty compared to smaller firms. Therefore, the investor may put a greater trust in larger firms’ whish more familiar and responsive to their financial reports. Yet, the mitigating role of firm size is remaining open empirical question.
Second, leverage (Lev). Leverage mostly affects the constrained firms’ external financing decisions. Higher leverage causes constrained firms to raise less external financing, invest less, and pay out less. Van Tendeloo and Vanstraelen (2005) predict that highly leveraged firms are more likely to engage in upward earnings management to avoid debt covenant violation and are associated with lower earnings management response coefficients. Therefore, in this study expect that leverage (debt to total assets ratio) will have a negative impact on the quality of accounting information.
For the last independent variables the researcher expects the positive relation between discretionary accrual towards the gross fixed assets or in this study as property, plant and equipment (PPE). This research is the first to examine the relation of both variables. And this study expects the positive relation between DAC and gross fixed assets.
Based on the explanation of the variables above, the final model on earnings quality to be tested in this study is obtained as follows:
DACi,t = α0+β1Size+β2Leverage+β3PPE+ɛi,t (2)
Where,
DAC = Discretionary accruals,
Size = Firm size measure by natural logarithm of total assets,
Leverage = Total debt to total assets ratio,
PPE = Property, plant and equipment,
α = Constant,
ɛ = Error term.
The regression model above will be run three times for full sample of observation period, pre-IFRS period and post-IFRS period in order to capture the effect of IFRS convergence. If H1 is true the researcher expects the lower value of R2 in post-IFRS period and
positive coefficient for size and PPE but negative relation with leverage.
3.2.2. Value relevance
To test the second hypotheses in this study the researcher compare the value relevance of earning during pre and post IFRS convergence in Indonesia. Using Ohlson (1995) model of price-earning model. Where, price is regressed on both price-earning and book value of equity. The general form of the regression model is:
Pit = α0+β1EPS+β2BVPS+β3Size+β4Leverage+ɛit
Where,
P = Stock price six month after fiscal year,
α = Constant,
EPS = Earnings per share,
BVPS = Book value of common equity per share,
SIZE = Natural logarithm of end year total assets,
Leverage = Ratio of end year total liabilities to total assets,
ɛ = Error term.
The value relevance of earnings and book value is represented by the coefficient of these variables. The coefficient of earnings depends on how well a firm’s earnings can explain stock prices. According to Ohlson and Zhang (1988), the ability of earnings to explain stock prices can be influenced by its ability to reflect future earnings. They explain that the relative weight of earnings as compared to book value may vary depending on the permanence of earnings. However, the combined weights of earnings and book value should remain unchanged, for different accounting methods unless the accounting choice has an economic impact.
The researcher also includes some variables capturing size and leverage ratio of the firms into consideration. Size is measure by natural logarithm of the end year total assets and leverage by the ratio of the end year total liabilities to total assets. The model will be run three times by full sample, pre-IFRS convergence (2009-2011) and post-IFRS convergence (2012-2014). If H2 is valid, net income and book value of equity will be higher value relevance in the post-IFRS convergence period, thus the researcher expect an increase in R2 during the post-IFRS convergence period compare
to pre-IFRS period.
3.2.3. Method of analysis
problem. In order to achieve the objectives of this research used regression analysis with ordinary least square (OLS) (Gujarati, 2003). Before the OLS regression analysis through the model is done, it must be tested first with classic assumption test to confirm whether the regression model used there is no problem normality, multicollinearity, heteroscedasticity, and autocorrelation. If the four classic assumption test has confirmed that the data has no problem with classic assumption, then a model worthy of analysis to be used.
3.2.4. Multiple regression testing
In simple linear regression, a criterion variable is predicted from one predictor variable. In multiple regressions, the criterion is predicted by two or more variables. In this study there are two model of multiple regressions as the proxy of earning quality. The first model is about earnings management. The second model is measure value relevance.
3.3. Hypotheses Testing
3.3.1. Panel data analysis
In panel data, individuals (persons, firms, cities...,) are observed at several points in time (days, years, before and after treatment...,). Panel data are most useful when we suspect that the outcome variable depends on explanatory variables which are not observable but correlated with the observed explanatory variables. If such omitted variables are constant over time, panel data estimators allow to consistently estimate the effect of the observed explanatory variables.
3.3.2. Pooled effect regression model (OLS)
In this study hypotheses testing is conduct using OLS by Carl Friedrich Gauss, in Ghozali (2007) said the core of OLS is to estimate a regression line by minimizing the sum of squared errors of each observation on the line. OLS in this study used two regression model used in this study. Namely to examine the effect of earnings per share (EPS), Book value per share (BVPS), size and leverage towards stock price reflects the value relevance of financial statements. And also to examine the effect of size, leverage and plant, property and equipment (PPE) to the value of DAC to examine its influence on earnings management.
3.3.3. Fixed effect regression model
Fixed effects model is a statistical model that represents the observed quantities in terms of explanatory variables that are treated as if the quantities were non-random. In the fixed-effect analysis we assume that the true effect size is the same in all studies, and the summary effect is our estimate of this common effect size.
3.3.4. Random effect regression model
Random effect model, also called a variance components model, is a kind of hierarchical linear model. It assumes that the dataset being analyzed consists of a hierarchy of different populations whose differences relate to that hierarchy. In econometrics, random effects models are used in the analysis of hierarchical or panel data when one assumes no fixed effects (it allows for individual effects).
3.3.5. Hausman test
Durbin-Hu-Hausman test is a statistical hypothesis test in econometrics named after James Durbin, De-Min Wu, and Jerry A. Hausman. The test evaluates the consistency of an estimator when compared to an alternative, less efficient, estimator which is already known to be consistent. It helps one evaluate if a statistical model corresponds to the data.
4. RESULT AND DISCUSSION
4.1. Hypotheses Testing
Hypothesis testing is the important part of this section it conducted to find out whether the hypothesis in this study can be accepted or rejected. The data used in this study categorized as panel data, consist of the data of multiple companies in multiple year. There are three regression techniques used to solve the model. The first technique is pooled OLS method. In statistics, OLS or linear least squares is a method for estimating the unknown parameters in a linear regression model, with the goal of minimizing the differences between the observed responses in some arbitrary dataset and the responses predicted by the linear approximation of the data (visually this is seen as the sum of the vertical distances between each data point in the set and the corresponding point on the regression line - the smaller the differences, the better the model fits the data).
The second method is random effect model. Random effect model, also called a variance components model, is a kind of hierarchical linear model. It assumes that the dataset being analyzed consists of a hierarchy of different populations whose differences relate to that hierarchy. In econometrics, random effects models are used in the analysis of hierarchical or panel data when one assumes no fixed effects. And the last model is fixed effect model. Fixed effects model is a statistical model that represents the observed quantities in terms of explanatory variables that are treated as if the quantities were non-random.
This is in contrast to random effects models and mixed models in which either all or some of the explanatory variables are treated as if they arise from random causes. In order to determine the best model between FEM and REM the Hausman test is required. In Hausman test random effects (RE) is preferred under the null hypothesis due to higher efficiency, while under the alternative fixed effects (FE) is at least consistent and thus preferred.
Table 3 presents the results of regression models for the full sample study on earnings management models. Based on the Hausman test obtained the value of Chi-square is 0.653 and P = 0.721 or more than significant level i.e., 0.05 (P > 0,05). It can be concluded that the best model suggested between FEM and REM is the random effect model.
Table 5 shows the results of regression models for the post-IFRS period study on earnings management models. On the results of Hausman test showed results above 5.523 for the value of Chi-square and 0.063 (P > 0.05) for the probability that we can conclude the best method is the random effect model.
Table 6 shows the results of regression models for the full sample study on value relevance models. On the results of Hausman test showed results above 23.453 for the value of Chi-square and 0.000 (P < 0.05) for the probability that we can conclude the best method is the fixed effect model.
Table 7 shows the results of regression models for the pre-IFRS period study on value relevance models. On the results of Hausman test showed results above 23.453 for the value of Chi-square and 0.000 (P < 0.05) for the probability that we can conclude the best method is the fixed effect model.
Table 8 shows the results of regression models for the post-IFRS study on value relevance models. On the results of Hausman test
showed results above 24.698 for the value of Chi-square and 0.000 (P < 0.05) for the probability that we can conclude the best method is the fixed effect model.
According to previous discussion, it expected that the value of DAC is decrease after IFRS convergence and there’s positive relation between DAC to size and PPE but negative to leverage. This will be depicted by an increase in (1) the value of R2 in first
model and (2) coefficient and significance of independent variables to dependent variables.
In Table 9 present the coefficient of size, leverage and PPE pre and post-IFRS convergence. It showed that after IFRS convergence there is negative relation between DAC to Size and PPE (−0.605 and −0.302 respectively) and positive relation to leverage (0.071). Thus, H1 is reject and verified by the increase of adjusted R2 up to 0.055 during post-IFRS from −0.02 during
pre-IFRS.
Table 3: Result summary for full sample in earning management model
Model DACi,t=α0+β1Size+β2Leverage+β3PPE+ɛi,t Variables Pooled OLS Random effect Fixed effect
C −2.757308
(−3.881307) −1.028261**(−0.566868) (−3.773588)−2.737740
Size −0.267053**
(−0.664829) − (0.993858)−0.989753* (−0.683035)−0.280164*
Lev −0.007694**
(−0.080111) 0.012474**(0.076797) −0.008045***(−0.082645)
PPE −0.203357*
(−2.257816) 0.172259**(0.551762) (−2.213448)−0.204560*
Observation 130 130 130
R2 0.050536 0.048930 0.395850
F-stat 2.235487** 2.160768** 1.105681***
Hausman test 0.653075
(0.721417)
*Significant at 1%, **significant at 5%, ***significant at 10%. PPE: Plant, property and equipment, OLS: Ordinary least square, DAC: Discretionary accruals
Table 4: Result summary for pre-IFRS period in earning management model
Model DACi,t=α0+β1Size+β2Leverage+β3PPE+ɛi,t
Variables Pooled OLS Random effect Fixed effect
C −3.242332*
(−2.726628) (−2.644481)−3.242332* −6.188116***(−1.545418)
Size 0.039823***
(0.059961) 0.039823***(0.058155) 1.288598***(0.586080)
Lev −0.046539***
(−0.308858) −0.046539***(−0.299553) −0.069873***(−0.257419)
PPE −0.152192***
(−1.144562) −0.152192***(−1.110079) −0.767752***(−1.187841)
Observation 59 59 59
R2 0.028496 0.028496 0.624437
F-stat 0.537758*** 0.537758*** 0.875090***
Hausman test 0.362833
(0.834088)
*Significant at 1%, **significant at 5%, ***significant at 10%. PPE: Plant, property and equipment, OLS: Ordinary least square, IFRS: International Financial Reporting Standard, DAC: Discretionary accruals
Table 5: Result summary for post-IFRS period in earning management model
Model DACi,t=α0+β1Size+β2Leverage+β3PPE+ɛi,t
Variables Pooled OLS Random effect Fixed effect
C −2.217347*
(−2.518756) −2.217347**(−2.679490) −8.201346**(−1.924006)
Size −0.605332***
(−1.204757) −0.605332***(−1.281638) 4.672533**(1.909811)
Lev 0.071771***
(0.517944) 0.071771***(0.550997) −0.116547***(−0.422527)
PPE −0.302654*
(−2.238727) (−2.381590)−0.302654* (2.946139)2.431227
Observation 71 71 71
R2 0.096366 0.096366 0.654392
F-stat 2.381689** 2.381689** 1.339271***
Hausman test 5.523715
(0.063174)
*Significant at 1%, **significant at 5%, ***significant at 10%. PPE: Plant, property and equipment, OLS: Ordinary least square, IFRS: International Financial Reporting Standard, DAC: Discretionary accruals
Table 6: Result summary for full sample in value relevance model
Model Pit=α0+β1EPS+β2BVPS+β3Size+β4Leverage+ɛit
Variables Pooled OLS Random effect Fixed effect
C 2.817452
(4.036258) (3.111241)2.379444 −0.191083***(−0.126089)
EPS 0.624392
(10.12036) (7.297759)0.421090 (2.643726)0.196180
BVPS 0.016341***
(0.226405) 0.127567***(1.427024) (2.402309)0.575168*
Size 0.543310***
(1.434553) 0.768685**(1.958123) 1.107942**(1.840009)
Lev 0.068367***
(0.762606) −0.010593***(−0.094764) −0.032140***(−0.124564)
Observation 134 134 134
R2 0.476466 0.350209 0.878956
F-stat 33.71580 18.58431 12.01247
Hausman test 23.45360
(0.0000)
This finding is verifies the previous research by Gassen and Sellborn (2006) and Iatridis (2010) found no evidence of an increase in quality of financial reporting, as measure by earning management after IFRS convergence in Indonesia.
In the second model of earnings quality in this research expected that value relevance of EPS and BVPS will be higher in post-IFRS convergence. The second hypothesis will be verified by (1) the value of R2, and (2) the coefficient and significant level of
Independent variable compare to pre-IFRS period.
Result in Table 10 show that coefficient of EPS is positive and significant relation between stock price and earning per share in post-IFRS period with the value of EPS coefficient 0.105. Coefficient of BVPS is 0.329030 in post-IFRS period, it’s
significant and show positive relation to stock price but decrease compare to pre-IFRS period. For size and leverage both experience decreasing value in post-IFRS period. It concludes that H2 is accepted with R2 = 94% during post-IFRS period compared to
pre-IFRS period of 81%.
This finding verifies the recent evidence by Jermakowicz (2007) report an increase in the explanatory power of earnings and book value of equity after the voluntary adoption of IFRS for a sample of DAX-30 firms from 1995 to 2004.
5. CONCLUSION AND REMARKS
5.1. Overview of the Study
This study is conduct to determine if there is an increase in the quality of financial reports after the convergence of IFRS in 2012 in Indonesia. Previously there were several previous studies that discuss the effect on the quality of their IFRS financial statements in measuring the quality of their earnings. Based on the research conducted by Chua et al. (2012) have shown that companies that converge to IFRS increase of the quality of accounting, reduced earnings smoothing, more timely loss recognition and decreasing
Table 7: Result summary for pre-IFRS period in value relevance model
Model Pit=α0+β1EPS+β2BVPS+β3Size+β4Leverage+ɛit
Variables Pooled OLS Random effect Fixed effect
C 2.817452
(4.036258) (3.111241)2.379444 −0.191083***(−0.126089)
EPS 0.624392
(10.12036) (7.297759)0.421090 (2.643726)0.196180
BVPS 0.016341***
(0.226405) 0.127567***(1.427024) (2.402309)0.575168*
Size 0.543310***
(1.434553) 0.768685**(1.958123) 1.107942**(1.840009)
Lev 0.068367***
(0.762606) −0.010593***(−0.094764) −0.032140***(−0.124564)
Observation 134 134 134
R2 0.511110 0.365586 0.894407
F-stat 33.71580 18.58431 12.01247
Hausman test 23.45360
(0.0000)
*Significant at 1%, **significant at 5%, ***significant at 10%. OLS: Ordinary least square, IFRS: International Financial Reporting Standard, EPS: Earnings per share, BVPS: Book value per share
Table 8: Result summary for post-IFRS period in value relevance model
Model Pit=α0+β1EPS+β2BVPS+β3Size+β4Leverage+ɛit
Variables Pooled OLS Random effect Fixed effect
C 3.812125
(4.851672) (4.284197)3.944757 2.932560**(1.667326)
EPS 0.547701
(9.561075) (4.852287)0.199030 (2.315220)0.105740*
BVPS 0.147490**
(1.931581) (2.072976)0.200138* 0.329030**(1.689956)
Size −0.362992***
(−0.931593) 0.126870***(0.316842) 0.484466***(0.886012)
Lev −0.219906*
(−2.404202) (−2.666658)−0.210064 −0.142106***(−1.524287)
Observation 136 136 136
R2 0.459675 0.184008 0.965188
F-stat 27.86171 7.385213 39.11317
Hausman test 24.69889
(0.000)
*Significant at 1%, **significant at 5%, ***significant at 10%. IFRS: International Financial Reporting Standard, OLS: Ordinary least square, EPS: Earnings per share, BVPS: Book value per share
Table 9: Regression result on pre and post-IFRS convergence in earning management model
Variables Pre-IFRS (2009-2011) Post-IFRS (2012-2014)
C −3.2423*
(−2.6444) −2.2173**(−2.6794)
Size 0.0398***
(0.0581) −0.6053***(−1.2816)
Lev −0.0465***
(−0.2995) 0.0717***(0.5509)
PPE −0.1521***
(−1.1100) (−2.3815)−0.3026* Observation
(unbalanced) 59 71
R2 adjusted −0.0244 0.0559
*Significant at 1%, **significant at 5%, ***significant at 10%. PPE: IFRS: International Financial Reporting Standard
Table 10: Regression result on pre and post-IFRS convergence in value relevance model
Variables Pre-IFRS (2009-2011) Post-IFRS (2012-2014)
C −0.1910***
(−0.126) 2.9325**(1.6673)
EPS 0.1961
(2.6437) (2.3152)0.1057*
BVPS 0.5751*
(2.4023) 0.3290**(1.6899)
Size 1.1079**
(1.8400) 0.4844***(0.8860)
Lev −0.0321***
(−0.1245) −0.1421***(−1.5242) Observation
(unbalanced) 134 136
R2 adjusted 0.8199 0.9405
evidence of earnings management. On the other side, the results of Jeanjean and Stolowy (2008) found that after the adoption of IFRS in Australia, France and the UK there is no evidence of a decrease in the level of earnings management, even found evidence of increased earnings management practices in France. This indicates a decrease in the quality of financial statements after the adoption of IFRS.
In this study, the quality of earnings proxy by measure the level of earnings management and value relevance of financial statements. The reduced earnings management practices will reflect high earnings quality. This means that profit or disclosed in the financial statements reflect the company’s true profitability. And also the high earnings quality is reflected in the high relevance of the value of the company which can be seen from the interactions of stock price to EPS and share price of the book.
This study takes the object manufacturing companies listed on the Indonesian stock exchange during 2009-2014. Selection of manufacturing enterprises is intended as an overview of all companies listed on IDX since this sector has registered corporate members the most widely compared to other sectors and the most effect on the Indonesian economy in general. The selections for 2009-2014 is intended to capture the full impact of IFRS convergence in Indonesia that occurred in 2012 so that the researcher intends to see the impact before IFRS convergence for the years 2009-2011 and after the impact of the convergence of IFRS for the years 2012-2014.
In order to measure the level of earnings management researchers choose Jones model (1991) which has been modified by Kothari et al. (2005) by extracting the value of DAC of performance-matched approach. Discretionary accrual estimate as a function of change in sales, the level of property, plant and equipment, and the ratio of return on assets. According to Jones (1991), changes in revenue are included to control the economic circumstances of firms.
In order to measure the value relevance researchers choose the model Ohlson (1995) of the price-earnings models. Where, prices are regressed on both earnings and book value of equity. Value relevance of earnings as the degree to summarize which accounting earnings information impounded in market prices. Barth et al., (2001) define the accounting value as relevant if it has a predicted association with equity market values.
The data in this study retrieve from DataStream, the software for the financial data provider developed by Thomson Reuters. In the process of obtaining the data are normally distributed, the researchers found many outliers to be released from the sample. So there is a decrease in the number of samples of the total sample that has been previously selected. After the outliers were excluded from the sample data can be distributed normally and was not found statistical problems that would affect the findings in this study.
5.2. Summary of Findings
Results from this study can be concluded that the quality of financial statements following the IFRS convergence increases when viewed from the value relevance models but declined when
viewed from earnings management model because it found an increase in the value of earnings management after convergence of IFRS. The study also found that in companies listed on the Indonesian stock exchange there is a negative relationship between firm size and the level of earnings management that can be interpreted that the larger the enterprise the higher the level of earnings management that occurred. Similarly, the influence of gross fixed assets to the level of earnings management which also found a negative effect means that company with high level of gross fixed asset is less engage in earnings management practice. On the contrary, this research found that leverage positive and significant impact on the value of earnings management. It means that the higher the value of leverage on a company, the higher the earnings management activities that occur.
In value relevance models found a positive relationship between the stock price to EPS, BVPS and the size of the company. This indicates if the value of the three separate independent variable increases, the stock price will also increase. However, it is inversely proportional to the share price and leverage relationships. It means high leverage value will decrease the company’s stock price. Thus, from the above explanation can be concluded that after full convergence to IFRS that occurred in Indonesia in 2012 found a positive effect on the value relevance of financial statements. But, in fact there is an increase in the level of earnings management. It means that the financial statements prepared under IFRS have discretionary accrual value is higher than the financial statements prepared under US GAAP. From these results it can be concluded that the IFRS as the financial statements are expected to close loopholes that have been used to perform earnings management is still not effective and efficient.
5.3. Limitation of the Study
The results from this study also has some limitations. As there are many outliers in the sample causes the sample size decreases. In addition, many incentivesremain uncontrolled in this earnings quality model. And also the limitations of this study, it is number of sample and year of observation was too small so the finding of this study limited to a generalized overview of all companies listed on the Indonesia Stock Exchange.
5.4. Recommendationfor Future Research
The findings and the limitation of this study provided input for further research. Future studies may help to resolve the limitation faced in this study by increasing the number of samples into all companies listed on the IDX and add year of observation to see the better description of the effect of IFRS convergence. Additionally, further research can add another proxy of earnings quality in order to provide input from the other side about the effects of IFRS convergence in Indonesia.
REFERENCES
31, 230-264.
Ashbaugh, H., Pincus, M. (2001), Domestic accounting standards, international accounting standards, and the predictability of earnings. Journal of Accounting Research, 39, 417-434.
Ball, R., Brown, P.R. (1968), A Retrospective. FIRN Research Paper; Accounting Review.
Bao, B., Bao, D. (2004), Income smoothing, earnings quality and firm valuation. Journal of Business Finance and Accounting, 31, 1525-1557.
Barth, M., Landsman, W., Lang, M. (2008), International accounting standards and accounting quality. Journal Accounting Research, 46(3), 467-498.
Barth, M.E., Beaver, W.H., Landsman, W.R. (2001), The relevance of the value relevance literature for financial accounting standard setting: Another view. Journal of Accounting and Economics, 31, 1-3. Bartov, E., Goldberg, S., Kim, M. (2005), Comparative value relevance
among German, U.S. and international accounting standards: A German stock market perspective. Journal of Accounting, Auditing and Finance, 20, 95-119.
Beekes, W., Pope, P., Young, S. (2004), The link between earnings timeliness, Earnings conservatism and board composition: Evidence from the UK. Corporate Governance: An International Review, 12, 47-59.
Bellovary, J.L., Giacomino, D.E., Akers, M.D. (2005), Earnings quality: It’s time to measure and report. The CPA Journal, 75(11), 32-37. Boediono, G. (2005), Quality of Earnings: The Effect Study of
Mechanisms Corporate Governace and Earnings Management by Using Impact Analysis Lane. Accounting National Symposium VIII, IAI.
Burgstahler, D., Dichev, I. (1997), Earnings management to avoid earnings decreases and losses. Journal of Accounting and Economics, 24(1), 99-126.
Callao, S., Jarne, J.I. (2010), Have IFRS affected earnings management in the European Union? Accounting in Europe, 7(2), 159-189. Callao, S., Jarne, J.I., Laínez, J.A. (2007), Adoption of IFRS in Spain:
Effect on the comparability and relevance of financial reporting. Journal of International Accounting, Auditing and Taxation, 16, 148-178.
Chen, Y., Chien, C., Huang, S. (2010), An appraisal of financially distressed companies’ earnings management: Evidence from listed companies in China. Pacific Accounting Review, 22(1), 22-41. Cheng, C., Hsieh, S., Yip, Y. (2007), Impact of accounting choices on
firm valuation and earnings quality. Review of Accounting and Finance, 6, 419-441.
Chua, Y.L., Cheong, C.S., Gould, G. (2012), The impact of mandatory IFRS adoption on accounting quality: Evidence from Australia. Journal of International Accounting Research, 11(1), 119-146. Creswell, J. (2013), Research Design: Qualitative, Quantitative,
and Mixed Method Approach. 2nd ed. Thousand Oaks: National
University, Sage Publication.
Dargenidou, C., McLeay, S. (2010), The impact of introducing estimates of the future on international comparability in earnings expectations. The European Accounting Review, 19, 511-534.
Dechow, P.M. (1995), Detecting earning management. The Accounting Review, 70, 193-225.
Deloitte, T.T. (2014), IFRS in Your Pocket: An IAS Plus Guide. Dimitropoulos, P.E. (2013), The impact of IFRS on accounting quality:
Evidence from Greece. Advances in Accounting, Incorporating Avances in International Accounting, 29, 108-123.
Doukakis, L. (2010), The persistence of earninggs component after the adoption of IFRS. Managerial Finance, 25, 969-980.
Dunn, P. (2002), International accounting standards. Journal of Accounting Literature, 24, 1-52.
Eisenhardt, K.M. (1989), Agency theory: An assessment and review. The
Academy of Management Review, 14, 57-74.
Ewert, R., Wagenhofer, A. (2005), Economic effects of tightening accounting standards to restrict earnings management. The Accounting Review, 43, 1101-1124.
Fields, T.D., Lys, T.Z., Vincent, L. (2001), Empirical research on accounting choice. Journal of Accounting and Economics, 31, 1-3. Availabe from: http://www.ssrn.com/abstract=288308.
Gassen, J., Sellborn, T. (2006), Applying IFRS in Germany-determinants and consequences. Betriebswirtschaftliche Forschung Und Praxis, 58(4), 365-386.
Ghozali, I. (2009), Applications Multivariate Analysis with SPSS Program. 4th ed. Semarang: University Diponeforo.
Gjerde, K.H., Knivsflå, F.S. (2008), The value-relevance of adopting IFRS: Evidence from 145 NGAAP restatements. Journal of International Accounting, Auditing and Taxation, 17, 92-112. Gordon, B.N. (2010), Could IFRS Replace US GAAP ? A Comparison
of Earnings Attributes and Informativeness in US Market. (Working Paper). Philadelphia, PA: Temple University.
Gujarati, D.N. (1995), Basic Econometric. 3rd ed. New York: McGraw-Hill.
Hair, J.F., Sarstedt, M., Ringle, C.M., Mena, J.A. (2012), An assesment of the use of partial least square structural equation modeling in marketing research. Journal Academic Marketing Science, 40(3), 414-433.
Hassan, O.A.G., Romilly, P., Giorgioni, G., Power, D. (2009), The value relevance of disclosure: Evidence from the emerging capital market of Egypt. The International Journal of Accounting, 44(1), 79-102. Hibbard, R.L. (2012), Global Implementation of IFRS. University of
Tennessee Honors Thesis Projects.
Hope, O.K., Jin, J., Kang, T. (2006), Empirical evidence on jurisdictions that adopt IFRS. Journal of International Accounting Research, 5(2), 1-20.
Hung, M., Subramanyam, K.R. (2007), Financial statement effects of adopting international accounting standards: The case of Germany. Review of Accounting Studies, 12, 623-657.
Iatridis, G. (2010), International financial reporting standard and quality of financial statement information. International Review of Financial Analysis, 19, 193-204.
Immaculata, M. (2006), Adopsi accrual accounting in Indonesia. Jurnal SosioHumaniora, 5(2), 238.
Jeanjean, T., Stolowy, H. (2008), Do accounting standards matter? An exploratory analysis of earnings management before and after IFRS adoption. Journal of Accounting and Public Policy, 27(6), 480-494. Jensen, M., Meckling, W. (1976), Theory of the firm: Managerial
behavior, agency costs and ownership structure. Journal of Financial Economics, 3(2), 305-360.
Jermakowicz, E.K. (2007), The value relevance of accounting income reported by DAX-30 German companies. Journal of International Financial Management and Accounting, 18(3), 151-191.
Jones, J. (1991), Earnings management during import relief investigations. Journal Accounting Research, 29, 193-228.
Kabir, M.H., Laswad, F., Islam, M.A. (2010), Impact of IFRS in New Zealand on accounts and earnings quality. Australian Accounting Review, 20(4), 343-357.
Kvaal, E., Nobes, C. (2010), International differences in IFRS policy choice: A research note. Accounting and Business Research Journal, 40(2), 173-187.
Landsman, W.R., Maydew, E.L., Thornock, J.R. (2010), The information content of annual earnings announcements and mandatory adoption of IFRS. Journal of Accounting and Economics, 53, 34-54. Lang, M., Raedy, J., Wilson, W. (2006), Earnings management and cross
listing: Are reconciled earnings comparable to US earnings? Journal of Accounting and Economics, 42, 255-283.