RESEARCH
Evaluation of native microalgae from Tunisia
using the pulse-amplitude-modulation
measurement of chlorophyll fluorescence
and a performance study in semi-continuous
mode for biofuel production
A. Jebali
1,2, F. G. Acién
2, N. Jiménez‑Ruiz
2, C. Gómez
2, J. M. Fernández‑Sevilla
2, N. Mhiri
1, F. Karray
1, S. Sayadi
3and E. Molina‑Grima
2*Abstract
Background: Microalgae are attracting much attention as a promising feedstock for renewable energy production, while simultaneously providing environmental benefits. So far, comparison studies for microalgae selection for this purpose were mainly based on data obtained from batch cultures, where the lipid content and the growth rate were the main selection parameters. The present study evaluates the performance of native microalgae strains in semi‑ continuous mode, considering the suitability of the algal‑derived fatty acid composition and the saponifiable lipid productivity as selection criteria for microalgal fuel production. Evaluation of the photosynthetic performance and the robustness of the selected strain under outdoor conditions was conducted to assess its capability to grow and toler‑ ate harsh environmental growth conditions.
Results: In this study, five native microalgae strains from Tunisia (one freshwater and four marine strains) were isolated and evaluated as potential raw material to produce biofuel. Firstly, molecular identification of the strains was performed. Then, experiments in semi‑continuous mode at different dilution rates were carried out. The local microal‑ gae strains were characterized in terms of biomass and lipid productivity, in addition to protein content, and fatty acid profile, content and productivity. The marine strain Chlorella sp. showed, at 0.20 1/day dilution rate, lipid and biomass productivities of 35.10 mg/L day and 0.2 g/L day, respectively. Moreover, data from chlorophyll fluorescence measure‑ ments demonstrated the robustness of this strain as it tolerated extreme outdoor conditions including high (38 °C) and low (10 °C) temperature, and high irradiance (1600 µmol/m2 s).
Conclusions: Selection of native microalgae allows identifying potential strains suitable for use in the production of biofuels. The selected strain Chlorella sp. demonstrated adequate performance to be scaled up to outdoor conditions. Although experiments were performed at laboratory conditions, the methodology used in this paper allows a robust evaluation of microalgae strains for potential market applications.
Keywords: Microalgae, Productivity, Biochemical composition, Biofuel, Chlorophyll fluorescence, Photosynthetic parameters
© The Author(s) 2019. This article is distributed under the terms of the Creative Commons Attribution 4.0 International License (http://creat iveco mmons .org/licen ses/by/4.0/), which permits unrestricted use, distribution, and reproduction in any medium, provided you give appropriate credit to the original author(s) and the source, provide a link to the Creative Commons license, and indicate if changes were made. The Creative Commons Public Domain Dedication waiver (http://creat iveco mmons .org/ publi cdoma in/zero/1.0/) applies to the data made available in this article, unless otherwise stated.
Open Access
*Correspondence: [email protected]
2 Department of Chemical Engineering, University of Almería, Carretera
Sacramento s/n, 04120 Almería, Spain
Background
Amongst the conventional petroleum substitutes, bio-fuel has attracted the greatest interest over the last cen-tury owing to its sustainability and eco-friendly nature. However, alternative first- and second-generation bio-fuel resources, such as crops and lignocellulosic feed-stock, have various drawbacks related to water shortage, deforestation, food crop competition and land use [1, 2]. On the other hand, the judicious exploitation of micro-algae, a third-generation biofuel resource, could over-come these problems and make a significant contribution to meeting primary energy demand as well as providing environmental benefits [3–6]. In fact, microalgae have a prominent position as a biofuel feedstock given the range of advantages they offer, including a rapid growth rate, no impact on food security and the ability to grow in poor quality waters and on non-arable lands while, at the same time, converting CO2 into carbon-rich lipids [7–9].
Nev-ertheless, although biofuel production from microalgae is technically possible, it is currently economically unfeasi-ble due to the high cost of biomass production and pro-cessing. Additionally, sustainability of biofuel production from freshwater species has been questioned in several reports (http://energ yskep tic.com/2015/algae /). Micro-algae cultivation in seawater is among the few possible options for biomass production for producing fuels at any significant scale. Even so, freshwater is still needed to compensate evaporative losses and a consequent increase in culture salinity [10].
Extensive studies have been carried out to explore locally isolated microalgae strains from the northern Mediterranean for use in biofuel production [11–15]. However, exploring the potential of microalgae from the south-western Mediterranean is still in its infancy. Tunisia is one of the south-western Mediterranean countries that possess various biota with untapped microalgae diversity along with a large non-arable surface area (totalling almost 40%) as well as suitable weather for microalgae growth − 64,000 GJ/ha of solar radiation a year—making microalgae cultivation for biofuel production theoretically feasible [16]. How-ever, it has been recommended that, prior to large-scale production in a given area, selection of the best performing locally isolated strains should be carried out. This is because the native isolates, which are well adapted to local conditions, exhibit better performance and robustness than those from a strain bank collec-tion [17]. Thus, for microalgae strains screening, cur-rent studies mainly focus on the biomass concentration and lipid content, often determined from batch cul-tures [18–22]. Whereas to adequately select the best candidate to be used for biofuel production, the study should be carried out in continuous operational mode,
which is closer to the industrial commodities produc-tion standards and the target must be to maximize both the biomass and the saponifiable lipid productivities (i.e., fatty acid methyl esters [FAMEs] productivity) in addition to the suitability of the algal-derived fatty acid composition [23, 24]. However, few studies have inves-tigated these criteria in continuous cultures for select-ing the best performselect-ing strain and the optimal dilution rate [25–27]. This selection approach would allow determining the best combination of the selected crite-ria above mentioned.
Whatever the operation mode considered, the evalu-ation of the performance of microalgae cultures is usu-ally based on biomass growth; the utilization of fast methods such as fluorescence of chlorophylls is usually disregarded. This methodology is useful for studying photosynthesis mechanisms [28–31]. The technique using the Pulse-Amplitude-Modulated fluorometer (PAM) is a sensitive tool for examining the variability of chlorophyll fluorescence and photosynthetic per-formance in microalgae. It allows not only to measure the photosynthetic activity in a rapid and non-intrusive mode but also to investigate processes such as photo-protection and photoinhibition, the physiological status of the cell subjected to stress as well as to estimate the primary production [32–34]. Consequently, the meas-urement of chlorophyll fluorescence allows a rapid and real-time determination of the photosynthetic perfor-mance of microalgae cultures under various conditions influencing microalgae growth. For instance, tempera-ture and irradiance are the most important variables for controlling microalgae culture growth [35, 36]. Thus, these factors are considered among the main environ-mental parameters affecting photosynthesis in outdoor microalgae massive production [37].
Methods
Isolation of microalgae strains
Five different strains from north-eastern Tunisia were isolated. Strain WT6 was isolated from a thermal fresh-water source; whereas the others, Strain WT1, Strain WT3, Strain WT4 and Strain WT7 were isolated from sea water. The specific location for collecting samples is shown in Table 1. The procedure for isolating these monoalgal strains was as follows: approximately 10 mL of water sample was filtered through a 0.70-µm filter; the cells remaining on the filter were then inoculated in a 250-mL conical flask followed by incubation for enrich-ment under a continuous light intensity of 80 µmol/ m2 s at 25 °C with no agitation. In the case of the marine
microalgae strains, it was inoculated into a 150 mL f/2 culture medium [38], which was then supplied with sili-cate at a concentration of 0.01 g/L for the diatoms; or in the case of the freshwater microalgae strain, inoculated with MDM culture medium [39]. After 20–30 days, the cells were purified by successive serial dilutions and then plate streaked in 1.50% agar MDM or f/2 media. Once single colonies had formed, they were picked up and transferred for sequential liquid sub-culturing. Micro-scopic observations were carried out to verify the purity of the transferred colonies. Morphological identification of the isolated strains was performed, followed by molec-ular identification (Table 1).
DNA extraction, amplification and 18S rRNA, rbcL‑3P and ITS sequencing
The genomic DNA from Strain WT7, Strain WT4, Strain WT1, Strain WT3 and Strain WT6 was extracted using the FavorPrep Plant genomic DNA extraction mini kit in accordance with the manufacturer’s instruc-tions. The sequence of the 18S rRNA gene (SSU rRNA) was obtained by PCR amplification using the prim-ers EukA (5′-AAC CTG GTT GAT CCT GCC AGT-3′) and EukB (5′-TGA TCC TTC TGC AGG TTC ACC TAC
-3′) [40]. The PCR program for the 18S rRNA gene was as previously described [26]. Additionally, the PCR reaction was performed on the nuclear rDNA spacer sequence (internal transcribed spacers 1 and ITS-2) from the Strain WT3 isolate. The ITS1 (5´-TCC GTA GGT GAA CCT TGC GG-3´) and ITS4 (5´-TCC TCC GCT TAT TGA TAT GC-3´) primers were used [41]. The PCR conditions were as follows: 30 cycles of denaturing at 95 °C for 30 s; annealing at 58 °C for 45 s and exten-sion at 72 °C for 1 min; followed by final extenexten-sion at 72 °C for 10 min. The rbcL-3P gene (860 bp) (encoding the large subunit of ribulose-1, 5-bisphosphate carbox-ylase/oxygenase: RuBisCO) from the Strain WT7 and Strain WT4 isolates was amplified using CfD (5′-CCR TTY ATG CGT TGG AGA GA-3′) and DPrbcL7 (5′-AAR CAA CCT TGT GTA AGT CT-3′) primers [42]. The ther-mal profile for PCR amplification of rbcL-3P included an initial denaturation at 94 °C for 2 min, followed by 30 cycles at 94 °C for 20 s, 50 °C for 30 s and 72 °C for 2 min; then a final extension of 72 °C for 10 min. All PCR reactions were performed as previously described [26]. Nucleotide sequences of the rbcL gene were translated into amino acid sequences by EMBOSS Transeq (http://www.ebi.ac.uk/embos s/trans eq). Target sequences were analyzed using BLAST online (http:// www.NCBI.nim.nih.gov/). Multiple alignments were generated with the MUSCLE program [43] and den-drograms were constructed with MEGA program ver-sion 6 [44] based on the evolutionary distances that were calculated by the Neighbor-Joining method [45] with the Jukes–Cantor model (18S rRNA and the inter-nal transcribed spacers ITS-1 and ITS-2) and the Pois-son model (rbcL-3P). Statistical evaluation of the tree topologies was performed by bootstrap analysis with 1000 re-samplings [46]. Sequenced regions of the 18S rRNA gene, the ITS and the rbcL gene were depos-ited in the GenBank database and registered under the accession numbers presented in Table 1.
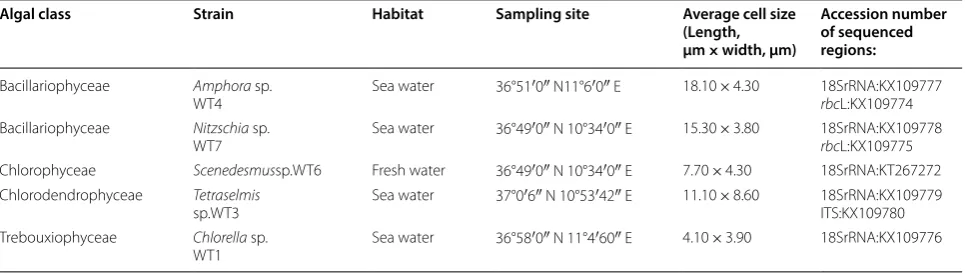
Table 1 Sampling site description and characterization of isolated microalgae strains
Algal class Strain Habitat Sampling site Average cell size
(Length, µm × width, µm)
Accession number of sequenced regions:
Bacillariophyceae Amphora sp.
WT4 Sea water 36°51′0″ N11°6′0″ E 18.10 × 4.30 18SrRNA:KX109777rbcL:KX109774 Bacillariophyceae Nitzschia sp.
WT7 Sea water 36°49′0″ N 10°34′0″ E 15.30 × 3.80 18SrRNA:KX109778rbcL:KX109775 Chlorophyceae Scenedesmussp.WT6 Fresh water 36°49′0″ N 10°34′0″ E 7.70 × 4.30 18SrRNA:KT267272 Chlorodendrophyceae Tetraselmis
sp.WT3 Sea water 37°0′6″ N 10°53′42″ E 11.10 × 8.60 18SrRNA:KX109779ITS:KX109780 Trebouxiophyceae Chlorella sp.
Experimental conditions in semi‑continuous mode
Firstly, inoculums from the native isolates were prepared at 22 °C, under continuous white light at an intensity of 277 µmol/m2 s and continuous aeration in 1-L flasks,
where Algal medium (Bionova, Santiago, Spain) was used for the marine strains (the diatom medium was supplied with silicate at a concentration of 0.01 g/L) and MDM medium for the freshwater strain. The inoculums were used to inoculate indoor bubble-column photobiore-actors (0.50 m in height, 0.07 m in diameter). The ves-sels were provided with an air inlet at the bottom (0.50 v/v min) to ensure mixing and dissolved oxygen removal, whereas the valves of the culture harvest and medium inlet were located at the top of the reactor. The culture pH was continuously measured using a pH probe (Crison Instruments, Spain) and maintained within the 7.90–8.00 range by on-demand CO2 injection. The temperature
was set at 22 °C and kept constant by controlling the room temperature. The illumination, measured by a 4π quantum scalar irradiance sensor (QSL-100, Biospheri-cal Instruments, San Diego, CA, USA), was supplied with six white-light lamps with a maximum irradiance of 1000 µmol/m2 s, simulating the circadian cycle.
Experi-ments were conducted in batch mode for 10 days; after that, the cultures were shifted to semi-continuous opera-tion at different diluopera-tion rates. Semi-continuous mode was maintained until steady state was reached (wash-ing the reactor volume three times)—data from the last 3 days, for each one of the dilution rates tested, were used.
Biomass concentration measurements
Samples were withdrawn daily to estimate biomass con-centration by optical density at 750 nm (OD 750) using a spectrophotometer (ATI UNICAM UV/Vis Spectrom-eter UV2, Cambridge, UK). Biomass dry weight measure-ments were carried out twice a week by centrifuging the microalgae cells for 10 min at 5000 rpm (SIGMA 4–15 Sartorius, Goettingen, Germany). The pellet was washed twice and lyophilized (TELSTAR Cryonos–50, Madrid, Spain).
Chlorophyll fluorescence measurements
The maximum quantum efficiency of photosystem II, calculated as the Fv/Fm ratio of each microalgae strain, was measured daily (AquaPenAP 100, Photon Systems Instruments, Drasov, The Czech Republic) to monitor the cells’ physiological status; where Fv was the variable fluorescence in dark-adapted microalgae cells and Fm was the maximum fluorescence from the dark-adapted microalgae cells.
The kinetic and photosynthetic parameters of pho-tosystem II (PSII) were estimated by means of the
pulse-amplitude-modulation (PAM) measurement of chlorophyll fluorescence using the Junior PAM fluo-rometer (Junior PAM 2000, Walz, Effeltrich, Germany). Indeed, absorbed light energy results in Chl a molecule excitation, which can be de-excited by three different pathways. Excitation energy can be (i) transferred to reac-tion centers and used in photosynthetic electron trans-port, photochemistry, (ii) dissipated as heat in the case of excess light energy (closure of reaction centers) and/ or (iii) it can be re-emitted as fluorescence [31, 33, 47]. The two mechanisms, photochemistry and thermal dis-sipation of excitation energy, are known as photochemi-cal quenching (qP) and non-photochemiphotochemi-cal quenching (NPQ) of chlorophyll fluorescence. Using this technique, the photosynthetic response of whatever microalgae strain exposed to culture conditions prevailing outdoor can be obtained through the generation of light-response curves (RLC) of the various chlorophyll-fluorescence parameters; namely, rETR, alpha, Ik and MQY. The rETR represents the relative maximum Electron Transport Rate through the PSII complex, which is correlated with the microalgae’s overall photosynthetic performance. Alpha is the initial slope of RLC, which reflects the quan-tum efficiency of the photosynthetic electron transport. Ik is the irradiance that is saturating photosynthesis and MQY is the Maximum Quantum Yield representing the maximum PSII efficiency in the dark-adapted sample [33, 48]. Accordingly, a rapid light curve can be provided from the pulse-amplitude-modulation measurement of chlorophyll fluorescence giving an idea of the photosyn-thetic activity, the strain’s potential over a Photosyntheti-cally Available Radiation (PAR, 400–700 nm) range and the photosynthetic characteristics (rETR, MQY, Ik and α) [31, 49].
Measurements were performed by immersing the optic fiber in algal culture sample previously incubated for 10 min in darkness. During this measurement, the sam-ple recipient was covered with aluminum foil to avoid interference from the measuring beam on the PAM fluo-rometer. The initial fluorescence (F0), the dark-adapted
minimal fluorescence flux, was measured with a weak pulsed measuring light at a very low photon fluence rate of 2 µmol/m2 s. Then, the maximum fluorescence (Fm),
the dark-adapted maximal fluorescence flux, was deter-mined by giving a 0.8-s short-saturation high-intensity light pulse of 3000 µmol m−2 s−1. The ratio of variable to
maximal fluorescence (Fv/Fm) was used as a measure of the maximal photochemical efficiency of photosystem II, where Fv = Fm− F0. This ratio was used to estimate the
pulses of saturation light. The rapid light curve obtained from the chlorophyll-fluorescence measurements con-sists of three regions: light limited, light saturated and light photoinhibited. The maximal quantum yield (MQY) is considered as the first Y value from the rapid light curve [50].
The slope of the light-limited region is alpha (α) and the rETR (relative Electron Transport Rate) was estimated by the product of the quantum yield (QY) of PSII (F′m− F), the photon flux density PFDa (absorbed light) and 0.5, a factor that accounts for energy partitioning between PSII and PSI, as follows:
Ik is determined by the equation:
These characteristic parameters were determined by fit-ting the light curve using the Platt and Gallegos equation [51]. WinControl software was used to export the data.
Different parameter variations, such as high (38 °C) and low (10 °C) temperature, and high light intensity (1600 µmol/m2 s) were applied to the selected microalgae
strain for 4 h to assess its tolerance to potential changes in outdoor environmental conditions. Culture samples were maintained at the same cell density for the different measurements through dilution. All measurements were performed in triplicate.
Biochemical composition and fatty acid profile
At steady state, biomass samples were harvested by cen-trifugation, washed twice and freeze dried. The protein content was determined according to the modified Lowry method proposed by Lòpez et al. [52]. Briefly, after Lowry and Folin reagents addition, the extract was incubated for 30 min in darkness. Then, the optical density was measured at 750 nm and the protein concentration was determined by a calibration curve using Bovine Serum Albumin (BSA) as standard. Total lipids were quantified as described by Kochert [53] using chloroform–metha-nol 2:1 (v/v) for the extraction followed by the addition of HCl (0.1 N) and MgCl2 (0.5%). Subsequent
centrifuga-tion was carried out for lower phase recovery. The lipid content was determined gravimetrically. The fatty acid profile and content were obtained by direct transesteri-fication using hexane, acetyl chloride and methanol as extraction solvents. Nonadecanoic acid (C 19:0) was used as internal standard [54]. Gas chromatography (Agilent Technologies 6890 N Series Gas Chromatograph, Santa Clara, CA, USA) analysis was performed as described by Rodríguez-Ruiz et al. [54]. All analyses were conducted in duplicate.
rETR=PFDa×QY×0.5
Ik= rETRmax α
Statistical analysis
The Statistical Package for the Social Sciences (SPSS for Windows version 24.0; SPSS Inc., Chicago) was used for the statistical analyses. One-way analysis of variance (ANOVA) and combined analysis of variance were per-formed using the SPSS software (SPSS, Inc.). The level of significance was expressed as significant at p < 0.05 (*) and highly significant at p < 0.001 (**). To compare the means between variables, the Duncan test was used.
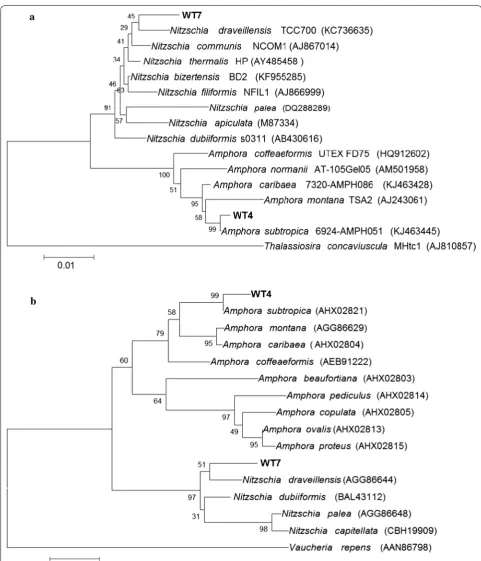
Results and discussion Phylogenetic analysis
Fig. 1 a Dendrogram based on the 18S rRNA gene sequence. Bootstrap values are given at the nodes. The scale bar represents the substitution percentage. Thalassiosira concaviuscula was used as the outgroup. GenBank accession numbers follow the species name in parentheses. b Dendrogram based on the rbcL‑3P sequence. Bootstrap values are given at the nodes. The scale bar represents the substitution percentage.
from the genus Scenedesmus and its relatives. The 18S rRNA gene sequence from Strain WT6 showed ≥ 99.9% similarity with Scenedesmus (Acutodesmus) rubescens CCAP 232/1 [59], Scenedesmus (Acutodesmus) dissocia-tus UTEX 1537 [60], Scenedesmus (Acutodesmus) littora-lis [61], Scenedesmus (Acutodesmus) distendus Hegewald 1975-267 [60] and Scenedesmus deserticola BCP-EM2-VF3 [62].
Performance of native microalgae strains
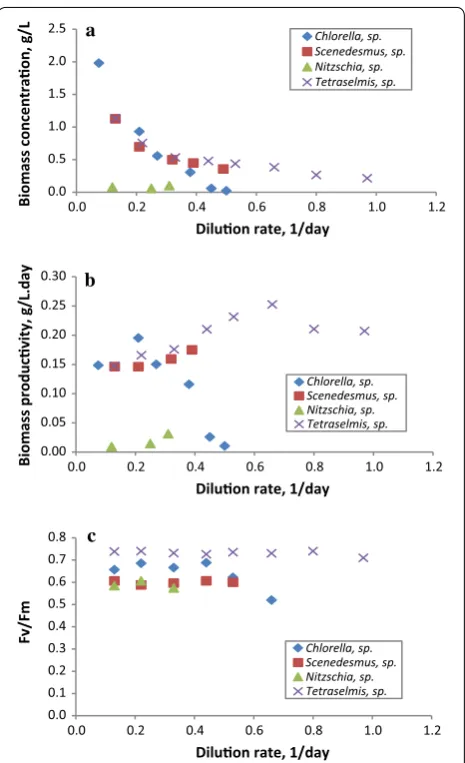
As a contribution to the survey of microalgae strains which are native to the south-western Mediterranean, the five different newly isolated microalgae strains from north-eastern Tunisia were evaluated in semi-continuous mode at different dilution rates to determine the optimal dilution rate for each strain and to select the best per-forming strain that could be used in further experiments. Experiments were performed in semi-continuous mode at dilution rates ranging from 0.08 to 0.90 1/day. The diatom Amphora sp. exhibited a very low biomass con-centration during the first batch phase as well as opera-tional cultivation difficulties such as biofouling; hence, it was not cultivated further in semi-continuous mode. The influence of the dilution rate on biomass concentration and productivity for each strain of the four isolates that grew adequately is displayed in Fig. 3a, b, respectively. For all the strains, the results demonstrated a typical trend of light-limited culture, where the biomass con-centration decreased as the dilution rate increased; with a maximum biomass concentration of 2.00 g/L being measured (Fig. 3a). The maximum biomass productivity (0.25 g/L day) was obtained with Tetraselmis sp. at 0.65 1/ day, while the lowest (0.01 g/L day) was with Nitzschia sp. The highest biomass productivity determined in this study (0.25 g/L day) was lower than the 0.87 and 0.76 g AFDW/L day obtained from S. obliquus and C. sorokini-ana DEO1412, respectively—cultivated in batch mode for 200 h [63], and the 0.47 g/L day yielded by C. pyrenoidosa in 1-L flask laboratory cultures after 16 days of incuba-tion [64]. However, the productivity obtained is compara-ble to previously reported values; for instance, San Pedro et al. [25] obtained a biomass productivity of 0.23 g/L day from Tetraselmis suecica cultivated semi-continuously at 0.47 1/day. Nonetheless, the productivity reported here is higher than the 47.71, 39.85 and 31.55 mg/L day reported from 15-day batch-cultivated Chlorella ellipsoidea in 2-L,
20-L (indoor) and 200-L (outdoor) bubble-column biore-actors, respectively [65].
The very low productivity obtained from the continu-ous cultivation of the Nitzschia sp. strain could be attrib-utable to an inadequate culture medium or unsuitable cultivation conditions. Nitzschia sp. is a benthic species that tends to grow adhered to solid substrates, and when cultivated in suspension tends to form lumps. In addi-tion, temperature and pH greatly affect the growth of this microalga [25, 64, 66, 67]. In fact, microscopic observa-tions of this strain carried out during the experiment revealed the presence of cell agglomerates as well as cell morphology alterations. Further experiments focusing on culture condition optimization should be carried out to enhance the biomass productivity of this diatom strain. The maximum photosynthetic activity of PSII for the dif-ferent strains was measured daily as an indicator of the cells’ physiological status and the steady-state data are presented in Fig. 3c. Of all the dilution rates applied, the Fv/Fm ratio for Tetraselmis sp. was the highest compared to the other strains, and remained constant in the 0.71– 0.74 range, reflecting the high photosynthetic efficiency of this strain. Similarly, the marine species Chlorella sp. presented constant photosynthetic activity (0.69–0.62) and dropped to 0.52 at the washing-out dilution rate, sug-gesting that the decrease in biomass concentration at that dilution rate (0.50 1/day) was probably associated with high light intensity leading to the photoinhibition of the cells. The Fv/Fm ratio of the freshwater species Scened-esmus sp. did not vary significantly at any of the dilution rates and were in the 0.61–0.59 range whilst Nitzschia sp. expressed low Fv/Fm ratio values—as low as 0.57—which is in agreement with the biomass productivity obtained, and confirms the hypothesis that this strain’s culture was subject to stress. Nevertheless, the values reported here are similar to those found in previous studies [26, 67, 68].
Effect of the dilution rate on the biochemical composition of the biomass
The biochemical composition of each native micro-algae strain was evaluated once steady state was achieved (washing the reactor volume three times). Results shown in Fig. 4a reveal that the protein con-tent is strain dependent and varied from one genus to another. Scenedemus sp. presented the largest amount of proteins, increasing from 15.30% d.wt. at 0.10 1/ (See figure on next page.)
a
b
c
Desmodesmus abundans
Ankistrodesmus stipitatus
Acutodesmus
Scenedesmus
Coelastrella
Coelastrum
Desmodesmus
Neodesmus
Scened
es
ma
ceae
Scenedesmus(Acutodesmus)dissociatus UTEX 1537 (AB037084) Scenedesmus(Acutodesmus)littoralis (AB055801)
Scenedesmus(Acutodesmus)rubescens CCAP 232/1 (X74002)
Scenedesmus(Acutodesmus)distendus Hegewald 1975-267 (AB037093) Scenedesmus deserticola BCP-EM2-VF3 (AY510461)
Scenedesmus deserticola BCP-YPGChar (AY510463) Scenedesmus(Acutodesmus)reginae SAG 22.81 (AB037096) Scenedesmus(Acutodesmus)obliquus SAG 276-3a (X56103)
Scenedesmus bajacalifornicus BCP-MX15VF11 (HQ246318) Scenedesmus raciborskii An 1996-5 (AB037094) Scenedesmus ovalternus SAG 52.80 (X81966) Scenedesmus obtusus Hegewald 1980-9 (AB037091) Scenedesmus vacuolatus SAG 211-8b (X56104)
Coelastrella saipanensis (AB055800)
Scenedesmus costatus Hegewald 1980-34 (AB037090) Coelastrum sphaericum SAG 32.81 (AF388376)
Coelastrum microporum Kr1980/11 (AF388373)
Coelastrum astroideum var. rugosum Tsarenko (AF388377)
Desmodesmus pirkollei Heg 81.106 (AF348496) UTEX 343 (X73995) Neodesmus danubialis SAG 17.81 (AB037086)
Neodesmus pupukensis UTEX 2219 (X91267)
SAG 202-5 (X56100) 100
100 50
86 100
52 88
83 75 98
44 35
83
72 61 80
45
48
0.005
day, to remain constant at all the higher dilution rates (ranging from 53 to 49.50% d.wt.). This would make it potentially interesting as a feedstock for protein-based food processes, following oil extraction, particularly for aquaculture species such as shrimps, molluscs and fish [69, 70]. Similarly, the dilution rate seemed to have no effect on the protein content of Tetraselmis sp., which ranged between 16.70 and 19.30% d.wt., although a slight increase (up to 21.60% d.wt.) was noticed at 0.40 1/day. The values reported here were lower than those obtained by Khatoon et al. [71], who cultivated Tet-raselmis sp. in batch mode at different salinities, yet were comparable to those reported by Kim et al. [72] for Tetraselmis sp. KCTC 12236BP after batch mode culti-vation in an aerated photobioreactor. As for Chlorella
sp., the protein content remained constant (25.60– 28.10% d.wt.) at the first three dilution rates, then continuously declined as the dilution rate increased, dropping to 12.80% d.wt. at 0.50 1/day. An approximate range of values was observed by Wu and Miao [64], who cultivated C. pyrenoidosa indoors in batch mode at different nitrate concentrations. A different trend was observed for Nitzschia sp., whereby the protein con-tent increased as the dilution rate increased from 15.10 to 20% d.wt., with a slight decrease at 0.25 1/day. This trend is in accordance with the data found by San Pedro et al. [25] using Nannochloropsis gaditana.
Regarding lipid content and productivity, the variation as a function of the dilution rate was studied for the dif-ferent isolates and the data are shown in Fig. 4b, c. As pre-viously pointed out [23, 68], the crucial criterion in the selection of potential candidates for biofuel production is the lipid productivity rather than the lipid content. For all the isolates, no specific trend was observed relating to the dilution rate applied. For the marine isolate Chlorella sp., the total lipid content ranged from 12.30 to 17.90% d.wt. and the lipid productivity was in the 1.70–35.10 mg/L day range—the maximum (17.90%, 35.10 mg/L day) was recorded at 0.20 1/day. A similar lipid content range was determined by Selvarajan et al. [73], who cultivated five microalgae strains of the Chlorella genus in batch mode for 21 days, whereas Song et al. [23]. determined a lower lipid productivity (7.96 mg/L day) than that reported in this study for the same genus strain. The lipids content of Scenedesmus sp. ranged from 17.80 to 22.90% d.wt. and the lipid productivities were in the range of 28.30– 37.40 mg/L day, with the lipid content peaking at 0.20 1/ day. A comparable lipid content range was obtained by Yin-Hu et al. [74], who cultivated Scenedesmus sp. under phosphorus-starvation and -repletion conditions in batch mode. Nonetheless, the lipid productivities reported here were higher than those determined for Scenedesmus sp. in previous studies [23, 75, 76]. Nitzschia sp. dem-onstrated a notable capability for accumulating lipids (20.60–30.70% d.wt.), which decreased as the dilution rate increased. However, the lipid productivity was only 2.90–6.80 mg/L day due to the low biomass productiv-ity. A similar result was observed by Song et al. [23] for diatom strains. Tetraselmis sp. exhibited lipid produc-tivities ranging from 17.90 to 33.40 mg/L day, whilst the lipid content was in the 8.80–15.90% d.wt. range, where it continuously decreased at dilution rates higher than 0.40 1/day. This lipid range was lower than that previ-ously reported for the same genus, Tetraselmis [71, 72]. The differences in the biochemical composition results for the various isolates from the same phylum and genus demonstrate that they are not only caused by differences in culture conditions but also because the biochemical 0.0
0.5 1.0 1.5 2.0 2.5
0.0 0.2 0.4 0.6 0.8 1.0 1.2
Biomass concentraon, g/
L
Diluon rate, 1/day Chlorella, sp. Scenedesmus, sp. Nitzschia, sp. Tetraselmis, sp.
0.00 0.05 0.10 0.15 0.20 0.25 0.30
0.0 0.2 0.4 0.6 0.8 1.0 1.2
Biomass producvity, g/L.da
y
Diluon rate, 1/day
b a
Chlorella, sp. Scenedesmus, sp. Nitzschia, sp. Tetraselmis, sp.
0.0 0.1 0.2 0.3 0.4 0.5 0.6 0.7 0.8
0.0 0.2 0.4 0.6 0.8 1.0 1.2
Fv/F
m
Diluon rate, 1/day Chlorella, sp. Scenedesmus, sp. Nitzschia, sp. Tetraselmis, sp.
c
Fig. 3 Changes in biomass concentration (a), biomass productivity (b) and photosynthetic efficiency (c) of Tetraselmis sp., Chlorella sp.,
composition of the microalgae strain is an intrinsic char-acteristic and species specific. In the light of the results obtained, the marine isolate Chlorella sp. demonstrated the best compromise of lipid and biomass productivity at 0.20 1/day; therefore, this microalgae strain was selected for further experiments.
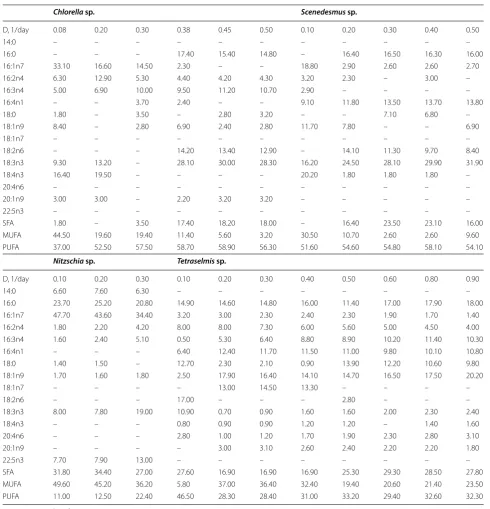
Another critical criterion for the selection of potential microalgae candidates for biodiesel production (i.e., the direct transesterification of the biomass lipid fraction) is the qualitative fatty acid composition and the saponifi-able lipids productivity (i.e., the fatty acid methyl esters [FAME] productivity). In fact, the fatty acid profile and
structure significantly influence and dictate the physi-cal and chemiphysi-cal properties of the biodiesel produced, including the octane number, viscosity, cold flow, oxida-tive stability and lubricity [68, 77]. The saponifiable fatty acid content and profile (Fig. 5a and Table 2, respectively) varied widely amongst the different isolates with no spe-cific trend being observed in relation to the distinct dilu-tion rates applied. It is worth mendilu-tioning that the diludilu-tion rate is not the only variable impacting on lipid content and lipid productivity in continuous cultures. In fact, the relationship between the lipid productivity, the dilution rate, the medium composition and the average irradiance in microalgae cultures has been previously reported [78]. Besides, the culture growth status, i.e., the average irradi-ance within the reactor, influences the fatty acid profile and content, because the fatty acid content is a function of the light availability inside the culture and the extent of photolimitation–photoinhibition phenomena [78]. Considering SFA and MUFA in combination, Tetraselmis sp. presented a range of 33.40–53.90% of total saponifi-able fatty acids—comparatively higher than the other two Chlorophyte isolates. The highest saturated and mono-saturated FAME content, however, was observed for the diatom Nitzschia sp. (81.40%). As for FAME productiv-ity, the highest value (20 mg/L day) was recorded for Chlorella sp. at 0.30 1/day followed by Tetraselmis sp. (16.90 mg/L day) at 0.20 1/day and then Scenedesmus sp. (16.30 mg/L day) at 0.50 1/day (Fig. 5b). In a study con-ducted by San Pedro et al. [24], the selected strain for biodiesel production showed higher productivity of accu-mulated fatty acids up to 51 mg/L day comparing to the one here determined. Similarly, these reported results are far from those obtained by Münkel et al. [79] who cul-tivated the freshwater strain Chlorella vulgaris in batch mode achieving a fatty acid productivity of 0.39 g/L day. However, it is worth noting that these authors carried out a two-stage culture strategy where the second stage is nitrate or/and phosphate-depleted phase to enhance lipid accumulation; whereas in comparison with the pre-sent work, the cultivation was performed under sufficient nutrients conditions.
Palmitic and palmitoleic acids were the predominant fatty acids in most of the algal isolate extracts followed by C18:3n3, C18:1n9, C16:4n1 and C16:3n4 (Table 2). Simi-lar classes of fatty acids were previously reported [80] with some differences in content that might be attribut-able to the diversity of microalgae strains studied and the culture conditions. The Chlorophyceae Scenedesmus sp. and the Trebouxiophyceae Chlorella sp. contained high C18:3n3 contents in the 16.20–31.90% range and 9.30– 30% of total fatty acids, respectively. The highest amount of C16:1n7 was attributed to the diatom Nitzschia sp. (47.70% of total fatty acids at 0.10 1/day), whereas a
0 10 20 30 40 50 60
0 0.2 0.4 0.6 0.8 1 1.2
Protein content,
%
d.wt.
Diluon rate, 1/day
a Chlorella, sp.
Scenedesmus, sp. Nitzschia, sp. Tetraselmis, sp.
0 5 10 15 20 25 30 35
0 0.2 0.4 0.6 0.8 1 1.2
Lipid
content,
%d.wt.
Diluon rate, 1/day
Chlorella, sp. Scenedesmus, sp. Nitzschia, sp. Tetraselmis, sp.
0 5 10 15 20 25 30 35 40
0 0.2 0.4 0.6 0.8 1 1.2
Lipid
producvity,
mg/L.day
Diluon rate, 1/day Chlorella, sp. Scenedesmus, sp. Nitzschia, sp. Tetraselmis, sp.
b
c
Fig. 4 Variations in protein (a) and lipid (b) contents, and lipid productivity (c) of Tetraselmis sp., Chlorella sp., Nitzschia sp. and
considerable amount of C18:1 (2.50–30.90% of total fatty acids) was obtained from Tetraselmis sp. It is worth not-ing that, of all the different isolates, only Nitzschia sp. presented broad classes of fatty acids from lighter species such as C:14 (6.30–7.60% of total fatty acids) to heavier species like C22:5 (7.70–13% of total fatty acids). Com-paring these FAME profiles with those of common and current worldwide biofuel feedstocks [77], the Trebouxi-ophyceae Chlorella sp. and the freshwater Scenedesmus sp. presented similar fatty acid profiles at high dilution rates to camelina, characterized by the high C18:3n3 con-tent. Whereas, the flagellate Tetraselmis sp. showed (at almost all the dilution rates tested) a fatty acid composi-tion more similar to tallow [77], marked by an abundance of C16:0 and C18:1 as well as a considerable C18:0 con-tent (Table 2).
In addition, a biodiesel quality estimation was con-ducted for the different isolates. In this study, the most important fuel properties frequently reported in the lit-erature for the assessment of FAME suitability as a fuel (Table 3)—kinematic viscosity, specific gravity, cloud point (CP), cetane number (CN), iodine value (IV) and high heating value (HHV)—were empirically determined using predictive models based on fatty acid composition
[77]. The estimated values of CN, CP, HHV, specific gravity and kinematic viscosity for the different FAMEs derived from the isolates complied with almost all the common quality specifications, in accordance with stand-ards ASTM D6751 in the US and EN 14214 in Europe. Furthermore, they are within the value ranges obtained from the widely used biodiesel feedstock (Table 3). The European standard is more stringent, designating a mini-mum CN value of 51; whereas, the US standard requires a minimum of 47. The CN is a measure of ignition quality in a diesel engine [68, 77]. The results showed a range of 48.80–58.50 for the different strains, in compliance with the standards requirements. The iodine value (IV) is a measure of unsaturation, and thus reflects a biodiesel’s oxidative stability. ASTM D6751 does not designate any IV specification whereas EN 14214 includes a maximum of 120 g I2/100 g FAME. Tetraselmis sp. and Nitzschia
sp. exhibited an IV range of 60.90–67.00 and 99.00– 112.30 g I2/100 g FAME, respectively. This is lower than
the prescribed limits, compared to the most common vegetable oils used for biodiesel production and lower than camelina (152.80 g I2/100 g FAME), soy (125.50 g
I2/100 g FAME) and sunflower (128.70 g I2/100 g FAME)
oils (Table 3) [77]. The kinematic viscosity is a meas-ure of a biodiesel’s flow resistance and this increases as the saturation increases, leading to poor combustion, high emissions and oil dilution [77]. The results pre-sented in Table 3 showed that kinematic viscosity val-ues varied between 3.90 and 4.80 mm2/s, which falls
within the specifications range. The diatom Nitzschia sp. demonstrated the highest kinematic viscosity values, of 4.80 mm2/s, probably due to its high SFA and MUFA
contents (up to 81.30% of total fatty acids).
In this study, the estimated specific gravity (also referred to as fuel density), which affects engine per-formance [77], varied between 0.87 and 0.88 kg/L. This is in accordance with the globally accepted stand-ard EN 14214. In contrast, the US and European fuel standards do not state any specification regarding the CP. This property, related to a biodiesel’s low-temper-ature performance, increases along with an increase in the presence of long-chain SFA resulting in poor cold flow properties [77]. The estimated CP value results for biodiesel from the isolates revealed a wide range, from − 8.20 to 11.30 °C, where the highest CP was determined for the diatom Nitzschia sp., indicating poor low-temperature performance. No specifications include HHV values; however, the values determined for the different isolates in the present study (39.70– 42.20 MJ/kg) were within the range of common vegeta-ble oil biodiesels and previously reported values from microalgae [73, 77]. Sun et al. [81]. studied the prop-erties of biodiesel from nine Chlorella strains. The
0 2 4 6 8 10 12 14 16 18
0 0.2 0.4 0.6 0.8 1 1.2
0 0.2 0.4 0.6 0.8 1 1.2
Saponifiable
fay
acids
content
,%
Diluon rate, 1/day
a
Chlorella, sp. Scenedesmus, sp. Nitzschia, sp. Tetraselmis, sp.
0 5 10 15 20 25
Saponifiable
lipids
producvity,
mg/L.day
Diluon rate, 1/day
b Chlorella, sp.
Scenedesmus, sp. Nitzschia, sp. Tetraselmis, sp.
Fig. 5 Variations in fatty acids content (a) and saponifiable lipids productivity (b) of Tetraselmis sp., Chlorella sp., Nitzschia sp. and
authors found higher CP values comparing to those here reported; whereas lower IV values were deter-mined. Also, Miao et al. [64] reported the biodiesel properties of Scenedesmus obliquus and Chlorella pyr-enoidosa and showed that they meet several of ASTM
specifications. In these both studies, similar range of CN was recorded comparing to that determined in the present work.
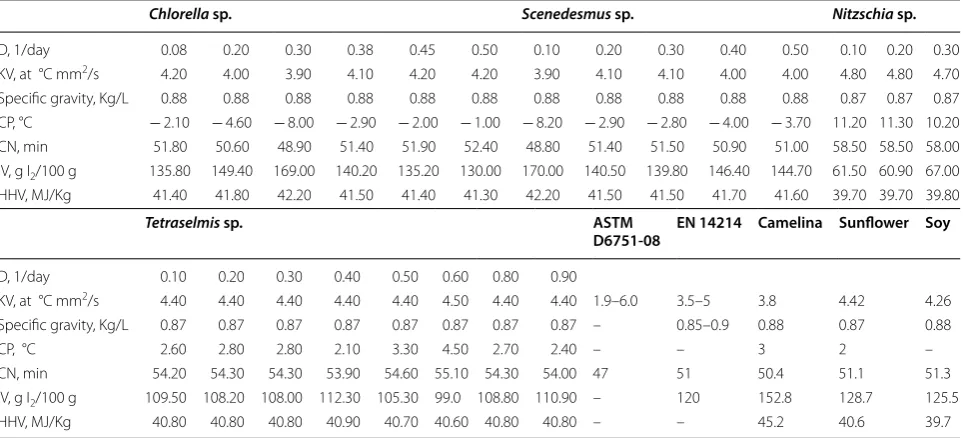
Table 2 Summary of fatty acid compositional profiles at steady state for algal lipids from the different isolates cultivated in semi-continuous mode at different dilution rates
Data are mean value of two repetitions
SFA: Saturated fatty acids; MUFA: mono unsaturated fatty acids; PUFA: poly unsaturated fatty acids
Chlorella sp. Scenedesmus sp.
D, 1/day 0.08 0.20 0.30 0.38 0.45 0.50 0.10 0.20 0.30 0.40 0.50
14:0 – – – – – – – – – – –
16:0 – – – 17.40 15.40 14.80 – 16.40 16.50 16.30 16.00
16:1n7 33.10 16.60 14.50 2.30 – – 18.80 2.90 2.60 2.60 2.70
16:2n4 6.30 12.90 5.30 4.40 4.20 4.30 3.20 2.30 – 3.00 –
16:3n4 5.00 6.90 10.00 9.50 11.20 10.70 2.90 – – – –
16:4n1 – – 3.70 2.40 – – 9.10 11.80 13.50 13.70 13.80
18:0 1.80 – 3.50 – 2.80 3.20 – – 7.10 6.80 –
18:1n9 8.40 – 2.80 6.90 2.40 2.80 11.70 7.80 – – 6.90
18:1n7 – – – – – – – – – – –
18:2n6 – – – 14.20 13.40 12.90 – 14.10 11.30 9.70 8.40
18:3n3 9.30 13.20 – 28.10 30.00 28.30 16.20 24.50 28.10 29.90 31.90
18:4n3 16.40 19.50 – – – – 20.20 1.80 1.80 1.80 –
20:4n6 – – – – – – – – – – –
20:1n9 3.00 3.00 – 2.20 3.20 3.20 – – – – –
22:5n3 – – – – – – – – – – –
SFA 1.80 – 3.50 17.40 18.20 18.00 – 16.40 23.50 23.10 16.00
MUFA 44.50 19.60 19.40 11.40 5.60 3.20 30.50 10.70 2.60 2.60 9.60
PUFA 37.00 52.50 57.50 58.70 58.90 56.30 51.60 54.60 54.80 58.10 54.10
Nitzschia sp. Tetraselmis sp.
D, 1/day 0.10 0.20 0.30 0.10 0.20 0.30 0.40 0.50 0.60 0.80 0.90
14:0 6.60 7.60 6.30 – – – – – – – –
16:0 23.70 25.20 20.80 14.90 14.60 14.80 16.00 11.40 17.00 17.90 18.00
16:1n7 47.70 43.60 34.40 3.20 3.00 2.30 2.40 2.30 1.90 1.70 1.40
16:2n4 1.80 2.20 4.20 8.00 8.00 7.30 6.00 5.60 5.00 4.50 4.00
16:3n4 1.60 2.40 5.10 0.50 5.30 6.40 8.80 8.90 10.20 11.40 10.30
16:4n1 – – – 6.40 12.40 11.70 11.50 11.00 9.80 10.10 10.80
18:0 1.40 1.50 – 12.70 2.30 2.10 0.90 13.90 12.20 10.60 9.80
18:1n9 1.70 1.60 1.80 2.50 17.90 16.40 14.10 14.70 16.50 17.50 20.20
18:1n7 – – – – 13.00 14.50 13.30 – – – –
18:2n6 – – – 17.00 – – – 2.80 – – –
18:3n3 8.00 7.80 19.00 10.90 0.70 0.90 1.60 1.60 2.00 2.30 2.40
18:4n3 – – – 0.80 0.90 0.90 1.20 1.20 – 1.40 1.60
20:4n6 – – – 2.80 1.00 1.20 1.70 1.90 2.30 2.80 3.10
20:1n9 – – – – 3.00 3.10 2.60 2.40 2.20 2.20 1.80
22:5n3 7.70 7.90 13.00 – – – – – – – –
SFA 31.80 34.40 27.00 27.60 16.90 16.90 16.90 25.30 29.30 28.50 27.80
MUFA 49.60 45.20 36.20 5.80 37.00 36.40 32.40 19.40 20.60 21.40 23.50
Influence of outdoor conditions on the performance of the selected microalgae strain WT1 Chlorella sp.
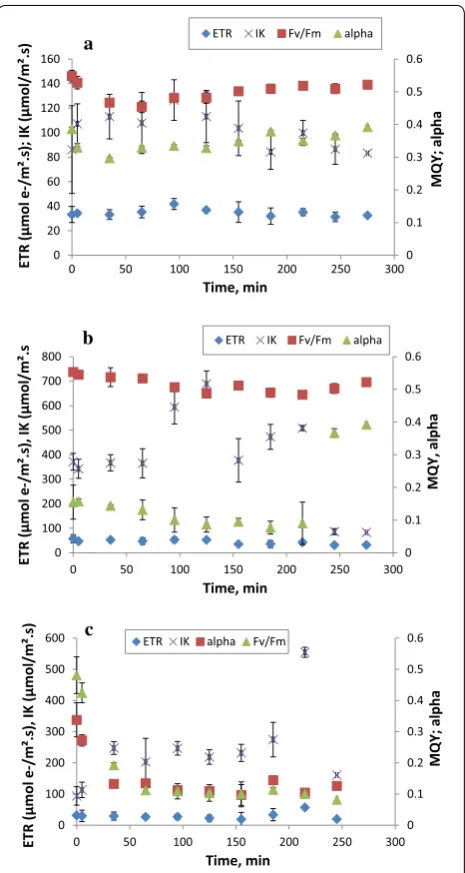
The effect of temperature and light prevailing outdoor conditions on the performance of the selected microalgae strain Chlorella sp. was studied. The effect of high and low temperature (38 °C and 10 °C) is shown in Fig. 6a, b. Multivariate analyses based on Pillai’s Trace test showed that both temperature, at the two levels (38 °C and 10 °C), and the length of exposure to the tested tem-perature (time), had a highly significant effect on the photosynthetic parameters (p < 0.001). The interaction between these factors also showed a synergy (Pillai’s trace value = 1.314; F = 2.516; p < 0.001). As can be observed in Fig. 6a, the Fv/Fm decreased due to high temperature (38 °C) and recovery came about only after 155 min. In addition, the curve of light saturation intensity (Ik) exhib-ited a notable decrease starting at 125 min. On the other hand, Fig. 6b displayed a different low-temperature-effect pattern (10 °C), where alpha constantly dropped from 0.15 to 0.09 at 215 min and then suddenly increased. Furthermore, the saturation irradiance showed a able trend during the experiment time. Total Fv/Fm vari-ability was mainly governed by the exposure time (74%); whereas, the temperature effect accounted for 90% and 98% on Ik and alpha, respectively. However, temperature and time exposure almost equally controlled ETR (58% and 42%, respectively).
Regarding the light effect (1600 µmol/m2 s), the results
for the photosynthetic parameter variations as a function
of time are displayed in Fig. 6c. They reveal that high-light intensity had a major impact on ETR and alpha (p < 0.001) while influencing Ik less (p < 0.005). The expo-sure time to high irradiance greatly affected ETR and Fv/ Fm, according to multivariate test analyses using Pillai’s Trace test. Similarly, the interaction effect between these two factors was found to be highly significant (Pillai’s Trace value = 1.769; F = 2.677; p < 0.001). Additionally, a highly significant effect of this synergy was noted on ETR and Fv/Fm (p < 0.001). The figure shows that both alpha and Fv/Fm sharply decreased after 35 min and 5 min, respectively, of exposure to high irradiance. Simi-lar results were found by [82], where Fv/Fm reduced after 5 min of exposure to high irradiance. In fact, some stud-ies have reported on photo-protective mechanisms that aim to protect photosynthetic reaction centers from over excitation caused by high irradiance or temperature vari-ations. The determination for the corrected total sum of square partitioning indicated that ETR and Fv/Fm were 81% and 83% controlled by high irradiance, respectively, while alpha was controlled by the length of exposure to high light intensity (68%).
Consequently, after evaluating all these results, the marine strain Chlorella sp. was selected as the most promising candidate for renewable fuel production due to its considerable biomass and lipid productivities (0.20 g/L day and 35.10 mg/L day, respectively, at 0.20 1/ day), the suitability of its fatty acid profile with respect to biofuel properties, and its important FAME productivity. Table 3 Comparison of estimated biodiesel properties of algal lipids from the different isolates as a function of the dilution rate along with the US and European specifications (B100), and those of common vegetable oils
Data are mean value of two repetitions
KV: Kinematic viscosity; CP: cloud point; CN: cetane number; IV: iodine value; HHV: high heating value
Chlorella sp. Scenedesmus sp. Nitzschia sp.
D, 1/day 0.08 0.20 0.30 0.38 0.45 0.50 0.10 0.20 0.30 0.40 0.50 0.10 0.20 0.30
KV, at °C mm2/s 4.20 4.00 3.90 4.10 4.20 4.20 3.90 4.10 4.10 4.00 4.00 4.80 4.80 4.70
Specific gravity, Kg/L 0.88 0.88 0.88 0.88 0.88 0.88 0.88 0.88 0.88 0.88 0.88 0.87 0.87 0.87
CP, °C − 2.10 − 4.60 − 8.00 − 2.90 − 2.00 − 1.00 − 8.20 − 2.90 − 2.80 − 4.00 − 3.70 11.20 11.30 10.20
CN, min 51.80 50.60 48.90 51.40 51.90 52.40 48.80 51.40 51.50 50.90 51.00 58.50 58.50 58.00
IV, g I2/100 g 135.80 149.40 169.00 140.20 135.20 130.00 170.00 140.50 139.80 146.40 144.70 61.50 60.90 67.00
HHV, MJ/Kg 41.40 41.80 42.20 41.50 41.40 41.30 42.20 41.50 41.50 41.70 41.60 39.70 39.70 39.80
Tetraselmis sp. ASTM
D6751‑08 EN 14214 Camelina Sunflower Soy
D, 1/day 0.10 0.20 0.30 0.40 0.50 0.60 0.80 0.90
KV, at °C mm2/s 4.40 4.40 4.40 4.40 4.40 4.50 4.40 4.40 1.9–6.0 3.5–5 3.8 4.42 4.26
Specific gravity, Kg/L 0.87 0.87 0.87 0.87 0.87 0.87 0.87 0.87 – 0.85–0.9 0.88 0.87 0.88
CP, °C 2.60 2.80 2.80 2.10 3.30 4.50 2.70 2.40 – – 3 2 –
CN, min 54.20 54.30 54.30 53.90 54.60 55.10 54.30 54.00 47 51 50.4 51.1 51.3
IV, g I2/100 g 109.50 108.20 108.00 112.30 105.30 99.0 108.80 110.90 – 120 152.8 128.7 125.5
The investigation into this selected marine isolate’s pho-tosynthetic characteristics showed accordance with the results, demonstrating that the Chlorella sp. strain is suf-ficiently tolerant and robust when faced with severe out-door conditions.
Conclusions
Five native Tunisian microalgae strains were isolated and identified. These were Scenedesmus sp., Tetraselmis sp., Chlorella sp., Amphora sp. and Nitzschia sp. Four isolates were successfully cultivated in semi-continuous
mode at different dilution rates under laboratory con-ditions, which simulated outdoor concon-ditions, in order to evaluate their potential for biofuel production. Chlo-rella sp. demonstrated the best performance—at 0.20 1/ day, it achieved a lipid productivity of 35.10 mg/L day; while at 0.3 1/day, it achieved a FAME productivity of 20.30 mg/L day. Furthermore, when imposing severe outdoor conditions, the selected strain showed accepta-ble tolerance, with a photosynthetic parameters assess-ment using chlorophyll-fluorescence analysis revealing prompt culture recovery.
Acknowledgements
Not applicable.
Authors’ contributions
FGA, EMG, JFS and SS designed the experiments. AJ, NJR and CG performed the experiments. FK and NM performed the molecular identification of the strains. AJ analyzed the data and wrote the manuscript. EMG, JFS and CG reviewed the manuscript. All authors read and approved the final manuscript.
Funding
This study was supported by the Marine Microalgae Biotechnology Group at the University of Almería (BIO 173) and the Campus de Excelencia Internacional Agroalimentario (ceiA3) within the joint framework of supervised theses between the University of Almeria, Spain and the University of Sfax, Tunisia.
Availability of data and materials
The data sets used and/or analyzed during the current study are available from the corresponding author on reasonable request.
Ethics approval and consent to participate
Not applicable.
Consent for publication
Not applicable.
Competing interests
The authors declare that they have no competing interests.
Author details
1 Laboratory of Environmental Bioprocesses, Sfax Centre of Biotechnology,
University of Sfax, P.O. Box 1177, 3018 Sfax, Tunisia. 2 Department of Chemical
Engineering, University of Almería, Carretera Sacramento s/n, 04120 Almería, Spain. 3 Center for Sustainable Development, College of Arts and Sciences,
Qatar University, 2713, Doha, Qatar.
Received: 3 March 2019 Accepted: 2 May 2019
References
1. Rulli MC, Bellomi D, Cazzoli A, De Carolis G, D’Odorico P. The water‑ land‑food nexus of first‑generation biofuels. Sci Rep. 2016;6:22521.
https ://doi.org/10.1038/srep2 2521.
2. Tan XB, Lam MK, Uemura Y, Lim JW, Wong CY, Lee KT. Cultivation of microalgae for biodiesel production: a review on upstream and downstream processing. Chin J Chem Eng. 2018;26:17–30. https ://doi. org/10.1016/J.CJCHE .2017.08.010.
3. Faried M, Samer M, Abdelsalam E, Yousef RS, Attia YA, Ali AS. Biodiesel production from microalgae: processes, technologies and recent advancements. Renew Sustain Energy Rev. 2017;79:893–913. https :// doi.org/10.1016/j.rser.2017.05.199.
4. Mata TM, Melo AC, Simões M, Caetano NS. Parametric study of a brewery effluent treatment by microalgae Scenedesmus obliquus. Bioresour Technol. 2012;107:151–8. https ://doi.org/10.1016/j.biort ech.2011.12.109.
0 0.1 0.2 0.3 0.4 0.5 0.6 0 20 40 60 80 100 120 140 160
0 50 100 150 200 250 300
ET R( µmo le -/m².s) ;IK (µmol/m².s ) MQY ;alph a Time, min
a ETR IK Fv/Fm alpha
0 0.1 0.2 0.3 0.4 0.5 0.6 0 100 200 300 400 500 600 700 800
0 50 100 150 200 250 300
MQY, alph a ET R( µmol e-/m².s) ,I K (µmol/m².s Time, min
b ETR IK Fv/Fm alpha
0 0.1 0.2 0.3 0.4 0.5 0.6 0 100 200 300 400 500 600
0 50 100 150 200 250 300
MQY; alpha ET R( µmol e-/m².s) ,IK (µmol/m².s ) Time, min c
ETR IK alpha Fv/Fm
Fig. 6 Effect of temperature at 38 °C (a), at 10 °C (b) and high irradiance (1600 µmol/m2 s) (c) on different photosynthetic
5. Biller P, Ross AB. Potential yields and properties of oil from the hydro‑ thermal liquefaction of microalgae with different biochemical content. Bioresour Technol. 2011;102:215–25. https ://doi.org/10.1016/j.biort ech.2010.06.028.
6. Kirrolia A, Bishnoi NR, Singh R. Microalgae as a boon for sustainable energy production and its future research & development aspects. Renew Sustain Energy Rev. 2013;20:642–56. https ://doi.org/10.1016/j. rser.2012.12.003.
7. Cai T, Park SY, Li Y. Nutrient recovery from wastewater streams by micro‑ algae: status and prospects. Renew Sustain Energy Rev. 2013;19:360–9.
https ://doi.org/10.1016/j.rser.2012.11.030.
8. Simas‑Rodrigues C, Villela HDM, Martins AP, Marques LG, Colepicolo P, Tonon AP. Microalgae for economic applications: advantages and perspectives for bioethanol. J Exp Bot. 2015;66:4097–108. https ://doi. org/10.1093/jxb/erv13 0.
9. Mondal M, Goswami S, Ghosh A, Oinam G, Tiwari ON, Das P, Gayen K, Mandal MK, Halder GN. Production of biodiesel from microalgae through biological carbon capture: a review. 3 Biotech. 2017;7:99. https ://doi. org/10.1007/s1320 5‑017‑0727‑4.
10. Chisti Y. Constraints to commercialization of algal fuels. J Biotechnol. 2013;167:201–14. https ://doi.org/10.1016/J.JBIOT EC.2013.07.020. 11. Hernández D, Solana M, Riaño B, García‑González MC, Bertucco A.
Biofuels from microalgae: lipid extraction and methane production from the residual biomass in a biorefinery approach. Bioresour Technol. 2014;170:370–8. https ://doi.org/10.1016/J.BIORT ECH.2014.07.109. 12. Bessières D, Bazile J‑P, Tanh XNT, García‑Cuadra F, Acien FG. Thermo‑
physical behavior of three algal biodiesels over wide ranges of pressure and temperature. Fuel. 2018;233:497–503. https ://doi.org/10.1016/j. fuel.2018.06.091.
13. López‑González D, Fernandez‑Lopez M, Valverde JL, Sanchez‑Silva L. Comparison of the steam gasification performance of three species of microalgae by thermogravimetric–mass spectrometric analysis. Fuel. 2014;134:1–10. https ://doi.org/10.1016/j.fuel.2014.05.051.
14. Taleb A, Kandilian R, Touchard R, Montalescot V, Rinaldi T, Taha S, Takache H, Marchal L, Legrand J, Pruvost J. Screening of freshwater and seawater microalgae strains in fully controlled photobioreactors for biodiesel pro‑ duction. Bioresour Technol. 2016;218:480–90. https ://doi.org/10.1016/J. BIORT ECH.2016.06.086.
15. Rodolfi L, Chini Zittelli G, Bassi N, Padovani G, Biondi N, Bonini G, Tredici MR. Microalgae for oil: strain selection, induction of lipid synthesis and outdoor mass cultivation in a low‑cost photobioreactor. Biotechnol Bioeng. 2009;102:100–12. https ://doi.org/10.1002/bit.22033 .
16. Tredici M. Energy balance of microalgae cultures in photobioreactors and ponds. The energy balance and the NER, calculated on real numbers, are at the base of a sound LCA of Algal biofuels. In: EU Work. Life Cycle Anal. Algal Based Biofuels, 2012.
17. Abdelaziz AEM, Ghosh D, Hallenbeck PC. Characterization of growth and lipid production by Chlorella sp. PCH90, a microalga native to Que‑ bec. Bioresour Technol. 2014;156:20–8. https ://doi.org/10.1016/j.biort ech.2014.01.004.
18. Abou‑Shanab RAI, Matter IA, Kim S‑N, Oh Y‑K, Choi J, Jeon B‑H. Characteri‑ zation and identification of lipid‑producing microalgae species isolated from a freshwater lake. Biomass Bioenergy. 2011;35:3079–85. https ://doi. org/10.1016/J.BIOMB IOE.2011.04.021.
19. Abou‑Shanab RAI, Hwang J‑H, Cho Y, Min B, Jeon B‑H. Characterization of microalgal species isolated from fresh water bodies as a potential source for biodiesel production. Appl Energy. 2011;88:3300–6. https ://doi. org/10.1016/J.APENE RGY.2011.01.060.
20. Gill SS, Mehmood MA, Ahmad N, Ibrahim M, Rashid U, Ali S, Nehdi IA. Strain selection, growth productivity and biomass characterization of novel microalgae isolated from fresh and wastewaters of upper Punjab, Pakistan. Front Life Sci. 2016;9:190–200. https ://doi.org/10.1080/21553 769.2016.12049 57.
21. Lee K, Eisterhold ML, Rindi F, Palanisami S, Nam PK. Isolation and screen‑ ing of microalgae from natural habitats in the midwestern United States of America for biomass and biodiesel sources. J Nat Sci Biol Med. 2014;5:333–9. https ://doi.org/10.4103/0976‑9668.13617 8.
22. Xia L, Song S, He Q, Yang H, Hu C. Selection of microalgae for biodiesel production in a scalable outdoor photobioreactor in north China. Bioresour Technol. 2014;174:274–80. https ://doi.org/10.1016/J.BIORT ECH.2014.10.008.
23. Song M, Pei H, Hu W, Ma G. Evaluation of the potential of 10 microalgal strains for biodiesel production. Bioresour Technol. 2013;141:245–51.
https ://doi.org/10.1016/j.biort ech.2013.02.024.
24. Pittman JK, Dean AP, Osundeko O. The potential of sustainable algal biofuel production using wastewater resources. Bioresour Technol. 2011;102:17–25. https ://doi.org/10.1016/j.biort ech.2010.06.035. 25. San Pedro A, González‑López CV, Acién FG, Molina‑Grima E. Marine
microalgae selection and culture conditions optimization for bio‑ diesel production. Bioresour Technol. 2013;134:353–61. https ://doi. org/10.1016/j.biort ech.2013.02.032.
26. Jebali A, Acién FG, Gómez C, Fernández‑Sevilla JM, Mhiri N, Karray F, Dhouib A, Molina‑Grima E, Sayadi S. Selection of native Tunisian micro‑ algae for simultaneous wastewater treatment and biofuel production. Bioresour Technol. 2015;198:424–30. https ://doi.org/10.1016/j.biort ech.2015.09.037.
27. Morales‑Amaral M, Gómez‑Serrano C, Acién FG, Fernández‑Sevilla JM, Molina‑Grima E. Production of microalgae using centrate from anaerobic digestion as the nutrient source. Algal Res. 2015;9:297–305. https ://doi. org/10.1016/j.algal .2015.03.018.
28. Figueroa FL, Conde‑Álvarez R, Gómez I. Relations between electron trans‑ port rates determined by pulse amplitude modulated chlorophyll fluo‑ rescence and oxygen evolution in macroalgae under different light con‑ ditions. Photosynth Res. 2003;75:259–75. https ://doi.org/10.1023/A:10239 36313 544.
29. Krause GH, Weis E. Chlorophyll fluorescence and photosynthesis: the basics. Annu Rev Plant Physiol Plant Mol Biol. 1991;42:313–49. https ://doi. org/10.1146/annur ev.pp.42.06019 1.00152 5.
30. Maxwell K, Johnson GN. Chlorophyll fluorescence—a practical guide. J Exp Bot. 2000;51:659–68. https ://doi.org/10.1093/jexbo t/51.345.659. 31. White AJ, Critchley C. Rapid light curves: a new fluorescence method
to assess the state of the photosynthetic apparatus. Photosynth Res. 1999;59:63–72. https ://doi.org/10.1023/A:10061 88004 189.
32. Ihnken S, Eggert A, Beardall J. Exposure times in rapid light curves affect photosynthetic parameters in algae. Aquat Bot. 2010;93:185–94. https :// doi.org/10.1016/j.aquab ot.2010.07.002.
33. White S, Anandraj A, Bux F. PAM fluorometry as a tool to assess microalgal nutrient stress and monitor cellular neutral lipids. Bioresour Technol. 2011;102:1675–82. https ://ac.els‑cdn.com/S0960 85241 00162 99/1‑s2.0‑ S0960 85241 00162 99‑main.pdf?_tid=3b3ac 681‑ff9a‑42dd‑8d07‑f72db 7b85d a4&acdna t=15305 17103 _47748 af4d4 8483f 5f774 5101c 1e138 c7. Accessed 3 July 2018.
34. Suggett DJ, Prášil O, Borowitzka MA. Chlorophyll a fluorescence in aquatic sciences: methods and applications, Springer, 2010. https ://books .googl e.tn/books ?id=_MN3HP uWln4 C&hl=fr&sourc e=gbs_navli nks_s. Accessed 4 July 2018.
35. Béchet Q, Laviale M, Arsapin N, Bonnefond H, Bernard O. Modeling the impact of high temperatures on microalgal viability and photosynthetic activity. Biotechnol Biofuels. 2017;10:136. https ://doi.org/10.1186/s1306 8‑017‑0823‑z.
36. Singh SP, Singh P. Effect of temperature and light on the growth of algae species: a review. Renew Sustain Energy Rev. 2015;50:431–44. https ://doi. org/10.1016/j.rser.2015.05.024.
37. Zhu J, Rong J, Zong B. Factors in mass cultivation of microalgae for biodiesel. Chin J Catal. 2013;34:80–100. https ://doi.org/10.1016/S1872 ‑2067(11)60497 ‑X.
38. R.R. GUILLARD, J.H. RYTHER, Studies of marine planktonic diatoms. I. Cyclotella nana Hustedt, and Detonula confervacea (cleve) Gran., Can. J. Microbiol. 8 (1962) 229–39. http://www.ncbi.nlm.nih.gov/pubme d/13902 807 (accessed June 10, 2017).
39. Ichimura T, Itoh T. Preservation methods of microalgae (I). In: Nei T, editor. Preserv. Methods Microorg. Tokyo: University of Tokyo Press; 1977. p. 355–73.
40. Medlin L, Elwood HJ, Stickel S, Sogin ML. The characterization of enzymatically amplified eukaryotic 16S‑like rRNA‑coding regions. Gene. 1988;71:491–9. https ://doi.org/10.1016/0378‑1119(88)90066 ‑2. 41. White TJ, Bruns TD, Lee SB, Taylor JW. PCR Protocols, Elsevier, 1990. https ://
doi.org/10.1016/b978‑0‑12‑37218 0‑8.50042 ‑1.
43. Edgar RC. MUSCLE: multiple sequence alignment with high accuracy and high throughput. Nucleic Acids Res. 2004;32:1792–7. https ://doi. org/10.1093/nar/gkh34 0.
44. Tamura K, Stecher G, Peterson D, Filipski A, Kumar S. MEGA6: molecular evolutionary genetics analysis version 6.0. Mol Biol Evol. 2013;30:2725–9.
https ://doi.org/10.1093/molbe v/mst19 7.
45. Saitou N, Nei M. The neighbor‑joining method: a new method for recon‑ structing phylogenetic trees. Mol Biol Evol. 1987;4:406–25.
46. Felsenstein J. Confidence limits on phylogenies: an approach using the bootstrap. Evolution. 1985;39:783–91.
47. Müller P, Li XP, Niyogi KK. Non‑photochemical quenching. A response to excess light energy. Plant Physiol. 2001;125:1558–66.
48. Malapascua JRF, Jerez CG, Sergejevová M, Figuora FL, Masojídek J. Photosynthesis monitoring to optimize growth of microalgal mass cultures: application of chlorophyll fluorescence technique. Aquat Biol. 2014;22:123–40. https ://doi.org/10.3354/ab005 97.
49. Serô J, Vieira ÁS, Cruz ÁS, Coelho ÁH, Serô JO, Só A, Ae V, Nia S, Ae C, Coe‑ lho H. Rapid light‑response curves of chlorophyll fluorescence in micro‑ algae: relationship to steady‑state light curves and non‑photochemical quenching in benthic diatom‑dominated assemblages. Photosynth Res. 2006;90:29–43. https ://doi.org/10.1007/s1112 0‑006‑9105‑5.
50. Saroussi S, Beer S. Alpha and quantum yield of aquatic plants derived from PAM fluorometry: uses and misuses. Aquat Bot. 2007. https ://doi. org/10.1016/j.aquab ot.2006.09.003.
51. Platt T, Gallegos CL. Modelling primary production. In: Falkowski PG, editor. Primary productivity in the sea. Boston: Springer; 1980. p. 339–62.
https ://doi.org/10.1007/978‑1‑4684‑3890‑1_19.
52. López CVG, del García MCC, Fernández FGA, Bustos CS, Chisti Y, Sevilla JMF. Protein measurements of microalgal and cyanobacterial biomass. Bioresour Technol. 2010;101:7587–91. https ://doi.org/10.1016/j.biort ech.2010.04.077.
53. Kochert G. Handbook of phycological methods: culture methods and growth measurements, first. London: Cambridge University Press; 1978. 54. Rodríguez‑Ruiz J, Belarbi E‑H, Sánchez JLG, Alonso DL. Rapid simultane‑ ous lipid extraction and transesterification for fatty acid analyses. Biotech‑ nol Technol. 1998;12:689–91. https ://doi.org/10.1023/A:10088 12904 017. 55. Stepanek JG, Kociolek JP. Molecular phylogeny of Amphora sensu lato
(Bacillariophyta): an investigation into the monophyly and classifica‑ tion of the amphoroid diatoms. Protist. 2014;165:177–95. https ://doi. org/10.1016/J.PROTI S.2014.02.002.
56. Kermarrec L, Franc A, Rimet F, Chaumeil P, Humbert JF, Bouchez A. Next‑generation sequencing to inventory taxonomic diversity in eukaryotic communities: a test for freshwater diatoms. Mol Ecol Resour. 2013;13:607–19. https ://doi.org/10.1111/1755‑0998.12105 .
57. Fulnečková J, Hasíková T, Fajkus J, Lukešová A, Eliáš M, Sýkorová E. Dynamic evolution of telomeric sequences in the green algal order Chlamydomonadales. Genome Biol Evol. 2012;4:248–64. https ://doi. org/10.1093/gbe/evs00 7.
58. Huss VAR, Frank C, Hartmann EC, Hirmer M, Kloboucek A, Seidel BM, Wenzeler P, Kessler E. Biochemical taxonomy and molecular phylogeny of the genus Chlorella sensu lato (Chlorophyta). J Phycol. 1999;35:587–98.
https ://doi.org/10.1046/j.1529‑8817.1999.35305 87.x.
59. Kessler E, Schäfer M, Hümmer C, Kloboucek A, Huss VAR. Physiologi‑ cal, biochemical, and molecular characters for the taxonomy of the subgenera of Scenedesmus (Chlorococcales, Chlorophyta). Bot Acta. 1997;110:244–50. https ://doi.org/10.1111/j.1438‑8677.1997.tb006 36.x. 60. Hegewald E, Hanagata N. Phylogenetic studies on Scenedesmaceae
(Chlorophyta). Algol Stud Für Hydrobiol Suppl 2000:29–49. https ://www. schwe izerb art.de/paper s/archi v_algol stud/detai l/100/49215 /Phylo genet ic_studi es_on_Scene desma ceae_Chlor ophyt a. Accessed 18 Mar 2016. 61. Hanagata N. New species of Coelastrella and Scenedesmus (Chlorophy‑
ceae, Chlorophyta). J Jpn Bot. 2001;76:129–36. https ://www.resea rchga te.net/publi catio n/28173 0328_New_speci es_of_Coela strel la_and_Scene desmu s_Chlor ophyc eae_Chlor ophyt a. Accessed 18 Mar 2016. 62. Lewis LA, Flechtner VR. Cryptic species of Scenedesmus (Chlorophyta)
from desert soil communities of western North America. J Phycol. 2004;40:1127–37. https ://doi.org/10.1111/j.1529‑8817.2004.03235 .x. 63. Neofotis P, Huang A, Sury K, Chang W, Joseph F, Gabr A, Twary S, Qiu W,
Holguin O, Polle JEW. Characterization and classification of highly produc‑ tive microalgae strains discovered for biofuel and bioproduct generation. Algal Res. 2016;15:164–78. https ://doi.org/10.1016/j.algal .2016.01.007.
64. Wu H, Miao X. Biodiesel quality and biochemical changes of microalgae
Chlorella pyrenoidosa and Scenedesmus obliquus in response to nitrate levels. Bioresour Technol. 2014;170:421–7. https ://doi.org/10.1016/j.biort ech.2014.08.017.
65. Wang S‑K, Hu Y‑R, Wang F, Stiles AR, Liu C‑Z. Scale‑up cultivation of
Chlorella ellipsoidea from indoor to outdoor in bubble column bioreac‑ tors. Bioresour Technol. 2014;156:117–22. https ://doi.org/10.1016/j.biort ech.2014.01.023.
66. Santiago‑Morales IS, García‑Mendoza E. Growth and domoic acid content of Pseudo-nitzschia australis isolated from northwestern Baja California, Mexico, cultured under batch conditions at different temperatures and two Si:NO3 ratios. Harmful Algae. 2011;12:82–94. https ://doi.org/10.1016/j. hal.2011.09.004.
67. Thorel M, Fauchot J, Morelle J, Raimbault V, Le Roy B, Miossec C, Kientz‑ Bouchart V, Claquin P. Interactive effects of irradiance and temperature on growth and domoic acid production of the toxic diatom Pseudo‑ nitzschia australis (Bacillariophyceae). Harmful Algae. 2014;39:232–41.
https ://doi.org/10.1016/j.hal.2014.07.010.
68. Ma Y, Wang Z, Yu C, Yin Y, Zhou G. Evaluation of the potential of 9 Nannochloropsis strains for biodiesel production. Bioresour Technol. 2014;167:503–9. https ://doi.org/10.1016/j.biort ech.2014.06.047. 69. Shah MR, Lutzu GA, Alam A, Sarker P, Kabir Chowdhury MA, Parsaeimehr
A, Liang Y, Daroch M. Microalgae in aquafeeds for a sustainable aquacul‑ ture industry. J Appl Phycol. 2018;30:197–213. https ://doi.org/10.1007/ s1081 1‑017‑1234‑z.
70. Bleakley S, Hayes M. Algal proteins: extraction, application, and chal‑ lenges concerning production. Foods. 2017;6:33. https ://doi.org/10.3390/ foods 60500 33.
71. Khatoon H, Abdu Rahman N, Banerjee S, Harun N, Suleiman SS, Zakaria NH, Lananan F, Abdul Hamid SH, Endut A. Effects of different salinities and pH on the growth and proximate composition of Nannochloropsis sp. and Tetraselmis sp. isolated from South China Sea cultured under control and natural condition. Int Biodeterior Biodegradation. 2014;95:11–8. https ://doi.org/10.1016/j.ibiod .2014.06.022.
72. Kim G, Bae J, Lee K. Nitrate repletion strategy for enhancing lipid production from marine microalga Tetraselmis sp. Bioresour Technol. 2016;205:274–9. https ://doi.org/10.1016/j.biort ech.2016.01.045. 73. Selvarajan R, Felföldi T, Tauber T, Sanniyasi E, Sibanda T, Tekere M.
Screening and evaluation of some green algal strains (Chlorophyceae) isolated from freshwater and soda lakes for biofuel production. Energies. 2015;8:7502–21. https ://doi.org/10.3390/en807 7502.
74. Yin‑Hu W, Yin Y, Xin L, Hong‑Ying H, Zhen‑Feng S. Biomass production of a Scenedesmus sp. under phosphorous‑starvation cultivation condi‑ tion. Bioresour Technol. 2012;112:193–8. https ://doi.org/10.1016/j.biort ech.2012.02.037.
75. Cabello J, Toledo‑Cervantes A, Sánchez L, Revah S, Morales M. Effect of the temperature, pH and irradiance on the photosynthetic activity by
Scenedesmus obtusiusculus under nitrogen replete and deplete condi‑ tions. Bioresour Technol. 2015;181:128–35. https ://doi.org/10.1016/j.biort ech.2015.01.034.
76. Sarat Chandra T, Deepak RS, Maneesh Kumar M, Mukherji S, Chauhan VS, Sarada R, Mudliar SN. Evaluation of indigenous fresh water microalga
Scenedesmus obtusus for feed and fuel applications: effect of carbon dioxide, light and nutrient sources on growth and biochemical character‑ istics. Bioresour Technol. 2016;207:430–9. https ://doi.org/10.1016/j.biort ech.2016.01.044.
77. Hoekman SK, Broch A, Robbins C, Ceniceros E, Natarajan M. Review of biodiesel composition, properties, and specifications. Renew Sustain Energy Rev. 2012;16:143–69. https ://doi.org/10.1016/j.rser.2011.07.143. 78. Molina‑Grima E, García Camacho F, Acién Fernández FG. Production of EPA from Phaeodactylum tricornutum. In: Cohen Z, editor. Chem from Microalgae. Londres: Taylor & Francis Ltd.; 1999. p. 57–92.
79. Münkel R, Schmid‑Staiger U, Werner A, Hirth T. Optimization of outdoor cultivation in flat panel airlift reactors for lipid production by Chlorella vulgaris. Biotechnol Bioeng. 2013;110:2882–93. https ://doi.org/10.1002/ bit.24948 .