ISSN 2324-805X E-ISSN 2324-8068 Published by Redfame Publishing URL: http://jets.redfame.com
Scale Development Study for Academic Title Perception
Sevim Öztürk1, Celalettin Korkmaz2 1Dr. Faculty Member, Faculty of Education, İnönü University, Malatya, Turkey 2
Lecturer, Faculty of Education, Hatay Mustafa Kemal University, Hatay, Turkey
Correspondence: Sevim Öztürk, Dr. Faculty Member, Faculty of Education, İnönü University, Malatya, Turkey.
Received: November 12, 2018 Accepted: December 26, 2018 Online Published: December 29, 2018
doi:10.11114/jets.v7i1.3919 URL: https://doi.org/10.11114/jets.v7i1.3919
Abstract
In this study, it is aimed to develop a scale tool (validity and reliability were tested) in order to determine the faculty members’ perceptions on their academic titles. The scale development study was started with a literature review, thus a draft form was developed. The draft form which consists of 42 articles were presented to the specialists to receive their opinions. In line with the feedbacks from the specialists, the content validity rates of items were determined. The items which had value under .80 content validity rate were excluded from the content of the study. Therefore, remaining 30 items trial form were applied to 195 faculty members who are working in the İnönü and Hatay Mustafa Kemal Universities. In the analysis of the research data, descriptive and predictive statistical methods were used. In the process of developing the scale; construct validity, content validity, scale validity, test-retest reliability, two-half reliability and Cronbach’s alpha reliability were tested. For the construct validity of the scale, exploratory and confirmatory factor analysis were used. Based on the principal components analysis, it is seen that the articles of the scale can be gathered in a single factor or in five factors according to goodness of fit indicators in confirmatory factor analysis. In the confirmatory factor analysis, when the scale is considered as 5 dimensional, the standard fit indices are acceptable. Cronbach’s alpha reliability, test-retest reliability and two half reliability coefficients have also the values that show the scale is reliable. The findings that obtained as a result of the study show that the Academic Title Perception Scale can be used as a valid and reliable scale tool which can determine the perceptions of the faculty members about their academic titles.
Keywords: academic title, faculty member, validity, reliability
1. Introduction
From past to present, universities are considered as extremely important institutions that can play a critical role in the development, improvement, change and transformation of the countries (Acar & Bilir, 2013). Besides, universities also play an important role in the development of qualified human resources with advanced skills, adaptation to dynamism in science and technology, economic development, improvement of general life conditions, nature and environment protection, and developing solutions today’s problems (Türker, 1997, s. 23).
In the 3rd article of the Higher Education Law No. 2547, universities are defined as; “higher education institutions consist faculty, institute, collage etc. establishment and units that have scientific autonomy and public entity, and provide advanced education, scientific research, publication and consultancy” (Art.3/d, Official Gazette, date of 6/11/1981 and 17506 number). According to this definition, university was stated as institutions that are education stage after secondary education, conduct higher level of education, scientific research, publication and consultancy activities and have public entity.
The concept of university has been defined in different ways according to time, structure and expectation of society, and different missions have been assigned on the university since past till today. According to Kirstein (1999), university is a cognitive-rational institution in which scientific knowledge is produced and transmitted, so skills and technology are taught. As an organization, university is also different from the organizations which dominated by bureaucratic / financial measures. University is an institution which is dominated by collegial and egalitarian social relations. The university is an environment where it opens to door for world and innovation through science, any idea can be discussed, creativity is realized, titles and authorities are of little importance, non-hierarchical, scientific freedom and accumulation of knowledge are formed (Gökçe, 1990).
technological development and contributing to the development of the country by producing solutions to social problems. According to Husu (2001), university is also a social institution with students and academicians. Academicians take on important tasks in universities which are social institution and established on heterogeneous actor groups with management, academicians, students and other employees. Academicians who are elegant, intellectual, enlightened, knowledgeable and specialist, constitute the most basic and indispensable workforce of these institutions (Yıldız & Gizir, 2018).
In the 2547 numbered law, faculty members, lecturers and teaching assistants are defined as academicians who are attendant in higher education institutions, so professors, associate professors and assistant professors (Dr. Faculty Members) are also defined as faculty members. (Art.3/I, O. Newspaper, date of 6/11/1981 and 17506 numbered). Besides, The title of assistant professor has been changed as “Doctor Faculty Member” as of March 2018 (Law No. 7100, Art.2 / m, OF) Date: March 6, 2018, Issue: 30353). The concepts defining faculty members are also referred to as their academic titles .
Doctor and associate professor academic titles are accepted as an indicator of the scientific and intellectual accumulation of the academicians. These titles are given as a result of the evaluations of the juries formed by the faculty members. Professoriate is the highest academic title. Professorship is both an indicator of competence and the title of a staff assigned by the institution.
Taking titles as basis in the academic structuring and processing duration, affects both the meaning that faculty members assigned on academic titles and their expectations from titles. Nowadays, the titles in academic arrangements in the university environment have turned into the means of academics to reach certain positions and privileges. Academician who obtained an academic title in the higher position, have the opportunity to benefit from the facilities in the university and to influence and control the lower ones. Therefore, the acquisitions obtained by the title make it important and attractive to reach these positions for the academic members (Tunç, 2007, p.33-34).
In this study, with the examination subject of academic title, it is aimed to develop a scale that will determine how the faculty members perceive their position according to their title and their options related to this. The scale will be able to measure many factors, such as the rights and the responsibilities among academic titles, respectability, qualifications and conditions of obtaining titles. Thus, it is thought that the developed scale will contribute to the field in terms of understanding and raising awareness about the positions of academicians about their titles and other titles.
1.1 Aim
The aim of this study is to develop a measurement tool, tested in terms of validity and reliability, for determining the academic title perceptions of faculty members.
1.2 Limitations of the Study
The study is limited to data from two public universities established in different geographical regions and on different dates. The study is limited to the opinions of the faculty members participating in the study voluntarily.
2. Method
The Academic Title Perception Scale (ATPS) was developed to determine the perceptions of faculty members on their academic titles and other academic titles. Academic Title Perception Scale was developed in a process contains defining the content of the scale, reviewing the literature, interviewing with the focus group specialists, establishment of substance pool, receiving specialists’ opinion, evaluating the content validity, developing and evaluating the scale form, pilot study, implementation of the scale, validity and reliability calculations and evaluation of scale dimensions (Karasar, 2007).
2.1 Population and Sample
The study group of the research consisted of 195 faculty members with different titles. Volunteerism is based on the participation of the faculty members in the study. İnönü and Hatay Mustafa Kemal Universities were determined using easy-to-reach sample technique, and the draft form of the scale was applied to the faculty members working in these universities with different titles and different professions by using stratified sampling method.
Academicians who participated in the research %42 are female and %58 are male. 44% of the them are assistant professor, 26% are them associate professor and 30% of them are professors. 27% of participants work in Science, 26% of them work in Health Sciences and 47% of them work in Social Sciences.
2.2 Development of Data Collection Instrument
However, there was not found any scale on this subject in Turkey and abroad. In the literature research, legislation and current practices related to higher education in Turkey were reviewed as well as theoretical information on this subject. With the open ended questions prepared on academic title and their provisions in the law, the process of achieving these titles, and scope of authority and responsibilities, it was benefited from the academic members' opinions on perception to their academic titles in their scientific process.
In addition, the content of the draft form of the scale was tried to determine with including the personal lifes and observations of the researches. Both the literature information and the faculty members’ opinions were synthesized and draft scale form was prepared.
In order to determine whether the items of the scale are sufficient in content of quantity are quality to measure desired behavior and to determine the intelligibility of the expressions, the scale draft form is presented to the specialists’ opinions for the validity of structure and content. In this context, a total of 14 people who works in İnönü and Hatay Mustafa Kemal Universities that each one has a PhD degree in the fields, including 2 languages, 2 assessment and evaluations and 10 educational sciences field specialists were consulted and the necessary changes were made in line with the recommendations and the trial form was finalized. The scope of the specialists' opinions was determined as Scope Validity Ratio (SVR) 0.94 and Scope Validity Index (SVI) was 0.56. According to Yurdakul (2005) if SVI>0.56, SVR can be calculated.
As a result of the comprehensive evaluations, a total of 42 items were formed as the half of the questions were negative and the other half of them were positive. Tezbasaran (2008) states that it will be appropriate to keep the positive and negative numbers on the scale equal to each other in order to prevent the burden of the attitude expressions from being a motivator of the responder. With this reference, half of the items were consisted positive and the other half of it was composed of negative expressions. Negative items were analyzed reversely when analyzing.
The prepared draft form scale was prepared as five point Likert scale grading which aims to determine the degree of participation of academicians in the given expressions. The options are sorted from 1 to 5. The answer rating of the scale was arranged as “1- I completely disagree, 2- I disagree, 3- I partially agree, 4- I agree, 5- I completely agree”.
2.3 Data Collection and Analysis
The trial form was sent to the academic members at the different faculties and departments in İnönü and Mustafa Kemal Universities by means of an explanatory e-mail with information about the research and a link address was given to participate in the study. The academic members who agreed to participate in the study scored the scale form through this link. The pre-application of the prepared scale form was carried out with 195 academic members based on five times more than items number in the scale. In the literature, it is stated that in the development of a likert type scale, the number of the items on the scale of the study group should be at least five times more, this ratio can provide clues about the values of the universe and provide appropriate estimation, the results of the lower than these parameters may be suspicious (Bryman & Cramer, 2001: Trans. Tavşancıl, 2010; Karasar, 2007; Kline, 2005; Tabachnick & Fidell, 2001). In this application, the remaining 190 scale forms were subjected to the analysis by excluding the five forms which were not suitable for processing for different reasons and were showing the extreme value. In the analysis of research data, descriptive and predictive statistical methods were used.
In this context, validity and reliability studies were conducted. While constructive and confirmatory factor analysis were performed for construct validity, internal consistency coefficient and item analysis were included in the reliability study.
The correlations of the data for factor analysis were investigated by Kaiser-Meyer-Olkin ( KMO ) coefficient and the Barlett sphericity test, and the descriptive factor analysis was performed based on the findings obtained from the KMO coefficient and Barlett Sphericty test result . The factor building model of the scale was tested with Confirmatory Factor Analysis (CFA) and the maximum likelihood method was used in CFA. Primarly, compliance statistics were calculated for the model with 4 variables. For this, chi-square, the root mean square error of approximation (RMSEA), comparative fit index (CFI), normed fit index (NFI), non-normed index (NFI) values were examined and how many dimensions of the scale and what are these dimensions have been defined as the result of factor analysis. In the analysis, the factor loads were determined to be at least .30. Content Validity Index (CVI) was calculated in the content validity stage. IBM SPSS Statistics 21 and LISREL 8.8 software programs were used for statistical data processing.
3. Findings
In this chapter, findings related to regarding validity and reliability studies of “Academic Title Perception Scale (ATPS)” was included and obtained findings were discussed and interpreted.
3.1Structure Validity
collected from the study group. Structure/model validity foresees the theoretical analysis of the questions developed to measure a variable, whether they measure that variable and how much they relate to that variable (Büyüköztürk, et al., 2008: 118). In the study, the results of the Kaiser-Meyer-Olkin (KMO) (sampling adequacy statistic) and Bartlett’s Sphericity (BS) tests were analyzed to determine whether the data were suitable for factor analysis. In order to perform factor analysis, the KMO value must be greater than 0.60 and (BS) significance value must be less than 0.05.
The Kaiser Meyer Olkin test shows whether the sample is sufficient to perform factor analysis. In the KMO statistics, “between 0.50-0.70 called mid-level”, “between 0.70-0.80 called good”, “between 0.80-0.90 called very good” and “0.90 and above called excellent” (Field, 2002).
Table 1. KMO and Bartlett's Test
As seen in Table 1, it was determined that KMO value was 0,76 and Barlett's test result was significant (p <0.01 for chi-square). Since KMO value is 0.760, it indicates that the sample size, studied on, is sufficient and the data set is good for factor analysis. In addition, since Bartlett's (BS) test result is [x2 = 1571, 736; P <.05] and the significance value of 0.000, it indicates that there is a sufficient relationship between variables to do factor analysis.
After testing the suitability of the data for analysis, the data were subjected to basic component analysis. According to Büyüköztürk (2008), the basic component analysis is a statistical technique which is most commonly and widely used in practice and is relatively easy to read, which aims to reduce a variable and achieve meaningful conceptual structures (Büyüköztürk, 2008, p. 124)
3.2Exploratory Factor Analysis
In the exploratory factor analysis, principal component analysis and varimax rotation were applied to reveal the main factors (dimensions) of the scale.
The Varimax vertical rotation technique is used to determine in which dimensions substances are collected and to increase the burden of substances on a factor and to make it easier for factors to find the substance with the highest relation with them.
In the literature, it is stated that factor loads ranging between 0.30 and 0.40 can be taken as a lower cut-off point in the formation of the factor pattern (Tavşancıl, 2006).
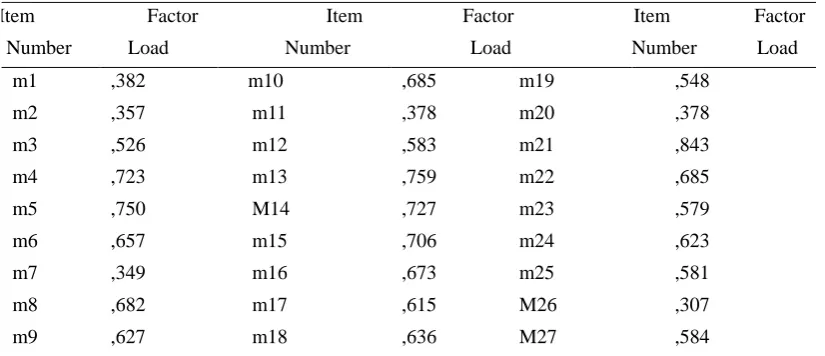
Table 2. Academic title perception scale factor analysis
Item Factor Item Factor Item Factor
Number Load Number Load Number Load
m1 ,382 m10 ,685 m19 ,548
m2 ,357 m11 ,378 m20 ,378
m3 ,526 m12 ,583 m21 ,843
m4 ,723 m13 ,759 m22 ,685
m5 ,750 M14 ,727 m23 ,579
m6 ,657 m15 ,706 m24 ,623
m7 ,349 m16 ,673 m25 ,581
m8 ,682 m17 ,615 M26 ,307
m9 ,627 m18 ,636 M27 ,584
As seen in Table 2, all of the resulting factor loadings are over 0.30 and are collected in one factor. For confirmatory factor analysis, the scale can be explained in 5 dimensions according to the results of varimax rotation. After the rotation with Varimax method, 1 item was removed from the scale due to the items value is under .30, 2 items showed binge variation in two factors at the same time. Thus, the scale was analyzed with 27 items. Kaiser-Meyer-OlkinMeasure of Sampling Adequacy .76
Bartlett's Test of Spheri Approx. Chi-Square 1571,736 df 351
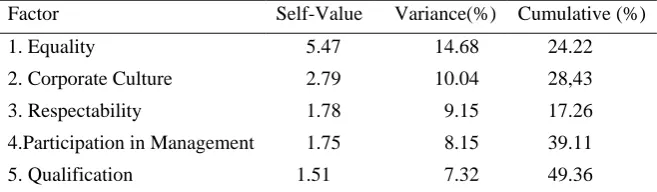
Table 3. Academic title perception scale factor analysis
Factor Self-Value Variance(%) Cumulative (%)
1. Equality
2. Corporate Culture
3. Respectability
4.Participation in Management
5. Qualification
5.47
2.79
1.78
1.75
1.51
14.68
10.04
9.15
8.15
7.32
24.22
28,43
17.26
39.11
49.36
As seen in Table 3, the scale consists of five factors. When the EFA result was examined, for scale 5 dimensions were suggested in Scree Plot. The eigenvalue of the first factor of the scale is 5.47, the eigenvalue of the second factor is 2.79, the third factor is 1,78 , fourth factor 1,75, fifth factor is 1,51. According to these values, the first factor of the scale describes 14,68% of the total variance, the second factor describes 10,04% of it, the third factor describes 9,15% of it, the fourth factor describes 8,15% of it and the fifth factor describes 7,32% of it. The variance explained by all factors is 49,36%. That is, the values explain the perception of the title by 49%. This is a moderately acceptable rate for social sciences. It is seen that the substances have a load value of at least 0,307 and maximum 0,843.
Table 4. Factor loads resulting from varimax factor rotation of scale items
1
Equality 2
CorporateCulture 3 4 5
Respectability Participation in Management Qualification m6 ,658 m22 ,684 m9 ,624 m 1 ,389 m8 ,685
m15 ,703 m27 ,587 m10 ,682 m2 ,357 m12 ,587
m17 ,615 m28 ,677 m11 ,378 m3 ,526 m13 ,753
m18 ,636 m29 ,669 m16 ,678 m14 ,726
m19 ,547 m30 ,486 m26 ,321 m20 ,379
m21 ,843
m23 ,579
m24 ,625
m25 ,589
As shown in the Table 4, as a result of the factor analysis, the items m6, m15, m17, m18, m19, m20, m21, m23, m24, m25 are placed under the first factor according to the Rotated Compenent Matrix and the load values of the items are between .37 and items .84, and m22, m27, m28, m29, m30 are placed under the second factor and load values of items are between .48 and .68 and items m9, m10, m11, m16, m26 are placed under the forth factor and load values of items are between .35 and .52, and items m8, m12, m13, m14 are placed under the fifth factor and load values of items vary between .58 and .75.
According to Karagöz and Kösterelioğlu (2008), considiring the common characteristics of the substances within the factor groups, each factor group is given a suitable name. With this reference, factors are named taking into account the common characteristics and contents of the substances. Therefore, all of the substances in the first factor called “Equality”, substances in the second factor called “Corporate Culture”, substances in the third factor called “Respectability”, substances in the fourth factor called “Participation in Management”, and all of substances in the fifth factor called “Quality”.
3.3 Confirmatory Factor Analysis
Confirmatory factor analysis is performed to test the validation of a predetermined structure (Bayram, 2010). For the CFA in this study, Chi-Square Goodness, adjusted goodness of fit index- AGFI, comparative fit index CFI, Normed fit index-NFI, Relative Fit Index-RFI, Incremental Fit Index-IFI, Average Square Root Mean Square Error of Approximation-RMSEA and compliance indices were investigated. According to Hooper, Caughlan and Muller (2008), 0.90 is accepted as the considerable fit value for the GFI, CFI, NFI, RFI, IFI and AGFI indices, and 0.95 for the perfect fit value (Trans. Çokluk, Şekercioğlu & Büyüköztürk, 2012).
Table 5. Academic Title Perception scale standard goodness of fit measures
X2 X2/df RMSEA NFI CFI IFI RFI GFI AGFI One Dimensional ATPS 1767,97 5,49 0,93 0,81 0,83 0,94 0,92 0,72 0,64 Five Dimensional ATPS 1406,23 1,63 0,58 0,90 0,97 0,97 0,94 0,83 0,79
excellent compliance, RMSEA<0.10 is acceptable compliance, x2/sd < 2 excellent compliance values, when compliance index values are examined for both dimensional, it can be said that the model is more compatible with ATPS according to values of x2/ sd index, Root Mean Square Error of Approximation-RMSEA, Goodness of Fit Index-GFI and Adjusted Goodness of Fit Index-AGFI.
3.4 Content Validity
It is determined according to the expert opinion whether the items in the measurement instrument are appropriate to the measuring instrument and represent the desired field (Karasar, 2007, p.151). In this respect, specialists’ opinions were applied for the content validity of the scale. In accordance with the specialists’ opinions, the validity of the scale determined as 30 items were accepted as 27 items.
3.5 Reliability Studies
Reliability is the consistency between the responses of individuals to the items in a measurement tool. The two main criteria for the reliability of a measurement tool are divided into two parts as “consistency between responses obtained at different times” and “consistency between the responses obtained at the same time” (Büyüköztürk, 2016, p.170). In order to determine the reliability level of the scale, Cronbach's alpha internal consistency coefficient, two-half reliability and test-retest reliability coefficients were calculated with 65 participants every other 12 days.
Table 6. One Dimensional Academic Title Perception Scale Reliability Coefficients
Factor Number of Items Cronbach’s Alpha Test-retest Reliability
Two semi-
Reliability
ATPS 27 ,75 ,95 ,92
As seen in Table 6, the test-retest reliability coefficient was found to be .95 when the scale was considered as one-dimensional. The internal consistency coefficient (Cronbach's alpha) obtained from 190 academicians is .75. The two semi-reliability of the scale was found to be .92. Table 7. Five Dimensional Academic Title Perception Scale Reliability Coefficients Factor (Dimensions) Number of Items Cronbach Alpha Reliability Structural Reliability 1. Equality 10 .76 .82
2 Corporate Culture 5 .74 .76
3. Respectability 5 .71 .70
4. Participation in Management 3 .74 .70
5. Qualification 4 .70 .72
ATPS 27 .75 .93
As seen in Table 7, the internal consistency coefficient (Cronbach's alpha) varies between .70 - .76; and the structural reliability coefficient varies between .70-.93 when scale is considered as five dimensional.
Table 8. The correlation between the lower dimensions of the AUA scale and the squareroot of the AVE values
Dimension Symbol 1 2 3 4 5 AVE
Equality 1 0.80 0.64
Corporate Culture 2 0.01 0.76 0.58
Respectability 3 0.45 0.30 0.71 0.45
Participation in Management 4 0.55 0,06 0.35 0.77 0.59 Qualification 5 0.43 0,07 0.38 0.43 0.74 0.30
ATPS General 0.92 0.84
4. Conclusion and Discussion
According to Bourdieu (1995), academic titles are one of the classification means that lead to social separation. In universities, these are determinant symbolic means that connect the academicians to the institutional structure and provide hierarchical order in academic structuring. These means cause the interaction and communication between academicians to be established mostly through academic titles, and the relations to be transformed into human-symbol relations. Dogan (2006), states that interpersonal relationships will lead human-symbol relations, which means sustaining through certain symbols and status regarding differences, cultural wealth and human values (Tunç, 2007, p.30-31).
In this study, a scale development process to determine the perceptions of academic members about their academic titles is explained. Developed “Academic Title Perception Scale” is a five-point Likert scale and has validity and reliability. The scale development study was started with the related literature review and benefitted from the views of the academicians with using an open-ended interview form. Both the literature and the opinions of the faculty members were synthesized and a total of 42 items was created.
This 42-items scale, designed to measure researchers' perceptions of academic titles, was presented to field specialists’ for structure and content validity. In this context, a total of 14 specialists, including 2 languages, 2 assessment and evaluation and 10 field specialists were consulted and 12 items were obtained from the pool based on the results of the specialist assessment form. The remaining 30 items were applied to 195 academic members with different titles by using them in the draft form.
For the validity of the results obtained from the scale, content and construct validity tests were performed. While the expert opinions were taken into consideration for the content validity, factor analysis was conducted for the construct validity. As a result of factor analysis, it was determined how many dimensions of the scale and what these dimensions were.
Before starting the factor analysis, KMO Kaiser-Meyer-Olkin (KMO) sample suitability test and Bartlett's sphericity test (BTS) were performed to determine whether the data obtained from the application of the scale form were suitable for factor analysis. As a result of the analysis, it was found that since KMO sample suitability value was .76 and the significance level of Bartlett's sphericity test was 0.00 (for p≤0.05) showed that data are suitable for factor analysis.
As a result of the factor analysis, 3 items which were below 0.30 and were included in more than one item were excluded from the scale. Thus, a 27-item scale was created to measure the academics members’ perceptions on their titles.
In order to determine how many factors are formed in the draft form, the main components are analyzed and it is observed that 5 factors with eigenvalues of 1 and more are formed. The factors that occur are named as; 1. “Equality”, 2. “Corporate Culture”, 3. “Respectability” 4. “Participation in Management” and 5. “Qualification”. Considering the distribution of the scale consisting of 27 items with factors (dimensions); the first factor included 10 items, second and third factors included 5 of it, fourth factor 3 of it and fifth factor 4 of it. Rather than whether the items are proportionally equal to each other, the features that make up the dimension are taken into consideration. There are conclusions in “Equality” dimension with rights and opportunities and conditions of promotion provided for being academician titles, in “Corporate Culture” dimension with corporate belonging, differences between them in terms of contributions to institution culture, in the “Participation in Management” dimension; representation in corporates at all levels and is assigned in senior managements and in “Qualification” dimension on whether academic qualification difference by title. For the reliability of the 27-item scale, Cronbach Alpha internal consistency coefficients were calculated based on the item analysis. The calculated Cronbach Alpha coefficients were found to be 0.75 for the entire scale while it is found as 0.76 for the first sub-dimension, as 0.74 for the second sub-dimension, as 0.71 for the third sub-dimension, as 0.74 for the fourth sub-dimension, and as 0.70 for the fifth sub-dimension.
The findings obtained from the study show that the developed Academic Title Perception Scale can be used as a valid and reliable measurement tool.
Since the scale is short and easy to apply and validity and reliability values are within acceptable limits, it can be used in the researches to measure the perceptions of academicians on their academic titles and it can be used for measuring the perceptions about the title and status differences in different occupational groups related to measurements of title and status differences.
References
Acar, M., & Bilir, H. (2013). Free market, budget competition: the need for market-oriented restructuring in universities.
Journal of Higher Education and Science,8(8), 184-192.
Bayram, N. (2010). Introduction to structural equation modeling. Bursa: Ekin Bookstore.
Büyüköztürk, Ş. (2002), Factor analysis: basic concepts and usage in scale development. Theory and Practice in Education Management, 2002(32), Fall, 470-483.
Büyüköztürk, Ş. (2008). Data analysis manual for generic sciences (9th ed.). Ankara: Pegem Publications.
Büyüköztürk, Ş., Çakmak, E. K., Akgün, Ö. E., Karadeniz, Ş., & Demirel, F. (2016). Scientific research methods (20th ed.). Ankara: Pegem Academy.
Çokluk, Ö., Şekercioğlu, G., & Büyüköztürk, Ş. (2012). Multivariate statistics for social sciences: SPSS and LISREL applications. Ankara: Pegem Academy.
Field, A. (2002). Discovering statistics using SPSS. UK: London: Sage Publications Ltd.
Gökçe, B. (1990). "Turkey Conditions How should a new university founded?", problems and solutions in higher education. The Association of University Lecturers. Istanbul: Cem Publishing.
Hooper, Daire - Coughlan, Joseph –Mullen & Michael, R.(2008). Structural equation modelling: guidelines for determining model fit. Electronic Journal of Business Research Methods, 6(1), 53-60.
Husu, L. (2001). On metaphors on the position of women in academia and science. Taylor & Francis, 3(9), 172-182. https://doi.org/10.1080/713801035
Karagöz, Y., & Kösterelioğlu, İ. (2008). Developing communication skills evaluation scale with factor analysis method.
Dumlupınar University Journal of Social Sciences, Number: 21.
Karagöz, Y. (2016). SPSS and AMOS23 applied statistical analysis. Ankara: Nobel Publication Distribution. Karasar, N. (2007). Scientific research method (17th ed.). Ankara: Nobel Publication Distribution.
Kirstein, J. (1999). Information on learning structures in higher education in the EU/EEA countries. Project Report- Trends in Learning Structures in Higher Education,European Commission, (98-01-CER-CER- 0642-00).
Kline, R. B. (2005). Principles and practice of structural equation modeling (2nd ed.). New York/London: Guilford Press.
Nunnally, J. C., & Bernstein, I. H. (1994). The Assessment of reliability, psychometric theory (3rd ed.). New York, NY: McGraw-Hill, Inc.
Official Newspaper (1981). Higher Education Law, 2547 No., Date: 6/11/1981 Volume: 175065 Volume: 21, Page: 3
Official Newspaper (2018). Law No. 7100, art.2 / m,:, Date: 6 March 2018, Issue: 30352.
Schermelleh-Engel, K., & Moosbrugger, H. (2003). Evaluating the fit of structural equation models: tests of significance and descriptive goodness-of-fit measures. Methods of Psychological Research Online, 8(2), 23-74. Tabachnick, B. G., & Fidell, L. S. (2001). Using multivariate statistics (4th ed). Needham Heights: Allyn & Bacon Tavşancıl, E. (2010). Measurement of attitudes and data analysis with SPSS. Ankara: Nobel Publication Distribution. Tezbaşaran, A. A. (2008). Likert type scale preparation guide. Third version e-book. ISBN: 975-9756-08-5.
Tunç, B. (2007). Evaluation of the academic promotion and appointment process of academic title (Unpublished master’s thesis). University of Ankara, Institute of Educational Sciences, Turkey.
Türker, R. K. (1997). "Graduate Education in the World and Turkey". Scientist rearing-Graduate education. TUBA Scientific Meeting Series, 7, Ankara: Turkey Academy of Sciences.
Turner, B. S. (2001). Status (Translated by Kemal Inal). Ankara: Utopia Publishing.
Yıldız, S., & Gizir. S. (2018). Investigation of the perceptions of faculty members on university, academics and scientific research concepts through metaphors. Hacettepe University Journal of Education, 33(3), 743-762.
Yurdakul, H. (2005). Use of scope validity indices for scope validity in scale development studies. XIV. National Congress of Educational Sciences (pp.1-5), Denizli: Pamukkale University Faculty of Education.
Copyrights
Copyright for this article is retained by the author(s), with first publication rights granted to the journal.