ISSN 2392-8042 (online) © Faculty of Management (SNSPA)
Identifying Key Factors
Affecting Customer’s Decision
-Making
of Internet Service Providers in Albania
Ana BUHALJOTI University of Tirana Arben Broci St., Tirana, Albania
Abstract. The internet market in Albania is expanding and new Internet service providers have grown significantly. Improving competition in this market relies on understanding why customers choose a particular service provider. This research paper aims to investigate and understand how a range of factors impact the customers’ perceptions to choose their internet service provider. It explores the factors affecting customer’s decision by using a quantitative method via a questionnaire survey. For identifying behavioral factors, a survey was conducted face to face. The structured questionnaire assessed the users’ perceptions and opinions in choosing an internet provider. The target population consisted of individual internet users at the household level who have fixed internet access at home. This paper presents the variables that influence consumers purchase decision by reviewing key factors in the sector and identifies consumer patterns in purchasing Internet Service Provider (ISPs). The findings of the research showed that brand image is the most influential factor in the selection of ISPs. In order to gain new customers, internet providers have to take into consideration the company’s image as a critical factor to the consumer decision-making, followed by the information disposed to customers and the risk associated to the service provider. The research provided high-speed internet providers in Albania insights on how to gain new customers and enhance competitiveness
Keywords: customer decision making; Telecommunication; Internet Service Providers (ISP); Albania.
Introduction
Due to the Internet market liberalization, internet providers have rapidly increased in Albania. The rising demand for Internet Service Providers (ISPs) is related to the global trend of the rapid growth of internet usage, market liberalization and a positive pressure exerted by government instances, especially for business. The growth of the Internet penetration rate has caused businesses, service enterprises and their customers to benefit from Internet-based services. Broadband Internet has affected the growth of economic activities in terms of employment, business activities and innovation.
Although the number of Internet access service providers is large (25 active local operators), the four largest operators own 84% of this market.
The more users a provider has, the lower its average unit cost will be, and the higher its operating performance (Hu & Hwang, 2006). Thus, understanding of customer decision making is very important for the service providers in order to find out how to acquire customers and make them repurchase. Studies show that customers tend to compare the elements of different providers and search for several sources of information to help reduce the perceived risks in their choice (Parasuraman, Zeithaml, & Berry, 1985). Moreover, customer choice is influenced by the reliability of the brand (Wang, Lo, & Yang, 2004).
Other studies in this field indicate that the technical quality of Internet connections is a key driver of the emotional bonds consumers form with their access provider. (Gerpott, 2018) The empirical literature suggests that the bandwidth of Internet connections and the inversely correlated waiting time in receiving or sending data tend to have significant positive or negative effects on attitudinal bonds of customers with the provider of their network connection (Gerpott, 2018; Giovanis, Zondiros, & Tomaras, 2014; Grzybowski, Hasbi, & Liang, 2018).
This paper aims to find out what variables influence consumers purchase decision by reviewing key factors in the sector and identifies consumer patterns in purchasing Internet Service Provider (ISPs).
Literature review
Consumer behavior is described as the processes involved when an individual or a group is buying or choosing a product or a service to satisfy needs and desires. (Solomon, Bamossy Askegaard, & Hogg, 2013). The processes are five: problem recognition, information search, evaluation of alternatives, purchase and post-purchase.
Before making a choice, the customer chooses to combine information with previous experiences, information available at the time of purchase, and trusts that he has created over the brands. (Solomon et al., 2013).
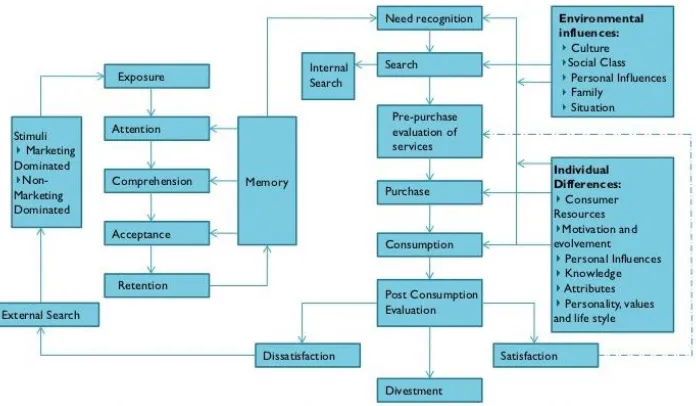
Depending on the model of Blackwell, Miniard and Engel (2001) (Figure 1), the decision of the consumer is influenced by two variables: (1) Environmental influences: culture (the knowledge, skills, traditions and customs which define a set of individuals), social class (group of individuals who share the same social position by having the same income or the same job), personal influences (attitudes, beliefs, behavior, and opinions from references groups with an individual serves as an example), family (2) Individual differences: consumer resources (time, money and information), motivation and involvement (the need to fill and the satisfaction), knowledge (the information known by the individual), attitudes (elements that an individual holds to assess a brand like feelings, knowledge, and intentions to purchase) and the personality, values and lifestyle (Blackwell et al., 2001).
Figure 1. The decision-making process (Blackwell et al., 2001)
The last stage in the traditional decision-making process is post-purchase behavior, which regards the post-evaluation of the purchase, where the consumer is evaluating how satisfied he is with the purchase and the use of the product. (Solomon et al., 2013). Customer satisfaction with the purchase is determined by how tightly consumers’ expectation is linked with the perceived performance of the product. A satisfied consumer is more likely to spread positive word-of-mouth and information received through word-of-mouth are more credible than a commercial advertisement (Darley et al., 2010).
types of consumer choice patterns: a) emotional choice, b) choice based on attitude and c) attribute-based choice (Hawkins & Mothersbaugh, 2010).
a) The emotional choice is based on the reliability of the service brand. Studies show that credibility is more important than expertise in making a choice (Schiffman & Kanuk, 2007). Brand choice is not only influenced by the personal perception of the consumer over the brand, but by some other marketing factors, the situation, or past consumer experience.
b) The attitudinal choice includes the general use of attitudes, impressions, intuition, consumer use in the selection without examining attributes. An attitude is accepted as a judgment. Studies show that attitudes are easier to keep in mind than the particular attributes of brands (Kardes, Cronley, & Cline, 2011). Time pressure is the key determinant as the consumer makes decisions based on its attitude.
Most individuals collect very little information from outside sources before a purchase. In a stand-alone choice, consumers make brand ratings based on everything they know about brands and then choose a brand for which they have the highest rating. According to Kardes et al. (2011), consumers make their choices based, generally on impressions of a brand and sometimes on the particular brand attributes.
c) Attribution-based selection requires customer recognition of the attributes of all brands. This choice is based on the comparison of each specific attribute of all brands taken into consideration. The easier it is to gather information on brand attributes, the more difficult it is to use attribute-based choice (Kardes et al., 2011).
When consumers make attribute-based choices, they compare the specific features of each brand and choose the brand that best performs the key attributes required. In cases of almost similar brands, it is easier to distinguish if specific attributes are compared.
Factors of customers’ decision making of internet service providers
number of brands examined, and time spent in the overall shopping experience. Mitra, Reiss, and Capella (1999) confirm that consumers prefer personal information sources than impersonal information sources.
The level of information collected by the customer is interrelated to the factor of perceived risk. Perceived risk refers to the nature and amount of risk perceived by consumers regarding a particular purchasing situation. Srinivasan and Ratchford (1991) define perceived risk as to the probability of any loss (financial, performance, physical) that can occur due to the absence of external search, multiplied by the importance of that loss. Forsythe and Shi (2006) studied and investigated the types of risk perceived by internet buyers when they intend to purchase. They suggest that there are three types of risks: performance risk, financial risk, and time/convenience risk. Product performance risk refers to any loss which occurs when a service does not perform as expected. Financial risk is defined as the potential net loss of money involved. Time/convenience risk refers to the inconvenience or difficulty which occurs during the process of purchase transactions (Forsythe, Liu, Shannon, & Gardner 2006).
A distinguishing factor that reduces perceived risk and facilitates customer selection is a corporate image. Corporate image can be viewed as the outsider’s perception of a particular organization (Chun, 2005). Customers’ perceptions of the corporate image depend on overall past experiences and interactions with the brand. Chun (2005) suggests that corporate image is the outsider’s perception whereas corporate reputation derives from both internal and external stakeholders’ perceptions. The distinction between image and reputation is useful because one can form an image of a corporation without any real experience of it. Compared to reputation, corporate image is quicker to change under the influence of advertisements. Some researchers suggest that companies with a good reputation and image have a competitive advantage and are likely to acquire more customers (Gotsi & Wilson, 2001; Grardberg & Fombrun, 2002). Corporate image is established and developed in the customers’ mind based on communication and experience and has an impact on customers’ judgments. Building a corporate image is a lengthy process that can be improved by the successes and achievements of the company.
In the telecommunication market, the extrinsic characteristics such as personal contact, the physical environment, technical support, and the responsiveness of the staff of service providers can have significant influences on customers’ intentions to select a service provider (Nguyen & Leblanc, 2001). The interaction between service provider and customer, along with the encounter processes can also have a strong effect on customers’ behavior (Athanassopoulos & Iliakopoulos, 2003). Customers consider corporate image prior to service choice as it can help them to evaluate the ability of the service company to fulfill their needs.
Methodology
The research aims to explore the factors influencing customer decision with Internet Service Providers in Albania. The primary data collected tend to evaluate consumers as rational. The survey questionnaire consisted of questions on a Likert scale of 1 to 7 (where 1 is ‘Strongly disagree’ and 7 is ‘Strongly agree’) and determined approaches to choosing a high-speed internet service provider, experience with high-speed internet, future intention towards service providers; and demographic questions. The survey was conducted face to face and increased the level of trust and cooperation between interviewer and respondent (Sekaran, 2003).
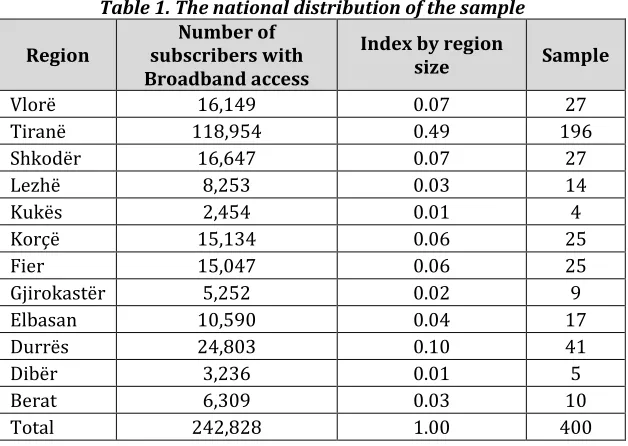
The target population of the study is formed by internet users aged 16-55 who have home-based Internet connections. According to the Electronic and Postal Communications Authority, the number of subscribers to fixed broadband networks at the end of 2016 was 242,870 inhabitants (AKEP, 2016). The population sample is 400 individuals. The sampling method is the probability in proportion to size. The probability of an individual to be selected is proportional to the size of the cluster to which he belongs, giving greater clusters greater probability of selection and small groupings the lower probability.
According to AKEP (2016), the number of subscribers with broadband access from the fixed network has an inappropriate distribution by regions Tirana 49%, Durrës 10.2%, Shkodra 6.85%, Vlora 6.6%, Korca 6.2%, Fier 6.1%, Elbasan 4.1% as shown in Table 1.
Table 1. The national distribution of the sample
Region subscribers with Number of Broadband access
Index by region
size Sample
Vlorë 16,149 0.07 27
Tiranë 118,954 0.49 196
Shkodër 16,647 0.07 27
Lezhë 8,253 0.03 14
Kukës 2,454 0.01 4
Korçë 15,134 0.06 25
Fier 15,047 0.06 25
Gjirokastër 5,252 0.02 9
Elbasan 10,590 0.04 17
Durrës 24,803 0.10 41
Dibër 3,236 0.01 5
Berat 6,309 0.03 10
Total 242,828 1.00 400
to meet the criteria of using the internet service at home and fall in the users’ age group 16-55 years old.
The questionnaire was distributed to the public areas of the counties where a large number of Internet users could be found.
The sample at the end resulted in 430 individuals who answered the questions on a seven-point Likert-type scale from 1 to 7 (where 1 means "Strongly Disagree" and 7 "Strongly Agree").
The data collected through the questionnaire includes internet user profile, choosing an internet service provider, experience with the internet service provider and perceptions on the service. The collected data was analyzed via Statistical Package for the Social Sciences SPSS.21 and the main data analysis includes descriptive analysis, factor analysis, correlation analysis with correlation coefficient (Pearson), and multiple regression analysis.
Analysis
The findings of this study derived from a well-structured questionnaire consisted of questions on a Likert scale of 1 to 7 (where 1 is ‘Strongly disagree’ and 7 is ‘Strongly agree’). The collected data was analyzed via Statistical Package for the Social Sciences SPSS.21 and the main data analysis includes descriptive analysis, factor analysis, correlation analysis with correlation coefficient (Pearson), and multiple regression analysis.
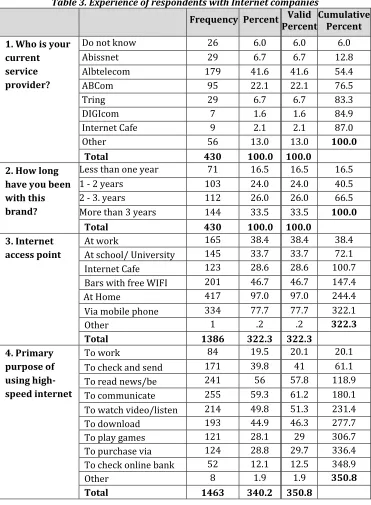
The distribution and profile of the 430 respondents who participated in this research are presented in table 2.
Table 3. Experience of respondents with Internet companies Frequency Percent Valid
Percent Cumulative Percent 1. Who is your
current service provider?
Do not know 26 6.0 6.0 6.0
Abissnet 29 6.7 6.7 12.8
Albtelecom 179 41.6 41.6 54.4
ABCom 95 22.1 22.1 76.5
Tring 29 6.7 6.7 83.3
DIGIcom 7 1.6 1.6 84.9
Internet Cafe 9 2.1 2.1 87.0
Other 56 13.0 13.0 100.0
Total 430 100.0 100.0
2. How long have you been with this brand?
Less than one year 71 16.5 16.5 16.5
1 - 2 years 103 24.0 24.0 40.5
2 - 3. years 112 26.0 26.0 66.5
More than 3 years 144 33.5 33.5 100.0
Total 430 100.0 100.0
3. Internet access point
At work 165 38.4 38.4 38.4
At school/ University 145 33.7 33.7 72.1 Internet Cafe 123 28.6 28.6 100.7 Bars with free WIFI 201 46.7 46.7 147.4
At Home 417 97.0 97.0 244.4
Via mobile phone 334 77.7 77.7 322.1
Other 1 .2 .2 322.3
Total 1386 322.3 322.3
4. Primary purpose of using high-speed internet
To work 84 19.5 20.1 20.1
To check and send emails
171 39.8 41 61.1 To read news/be
informed
241 56 57.8 118.9 To communicate 255 59.3 61.2 180.1 To watch video/listen
music
214 49.8 51.3 231.4 To download
movies/books
193 44.9 46.3 277.7
To play games 121 28.1 29 306.7
To purchase via internet
124 28.8 29.7 336.4 To check online bank
account
52 12.1 12.5 348.9
Other 8 1.9 1.9 350.8
Albtelecom brand as the market leader has the advantage of national coverage and infrastructure ownership, while other operators have coverage in the main regions of the country.
Respondents use internet access at home for more than 3 reasons. Based on their answers the first reason is communication (to communicate, for e-mail), the second reason for education (to read/inform) and the third entertainment (for video/music, to download movies/books, to play). Work accounts for a small percentage.
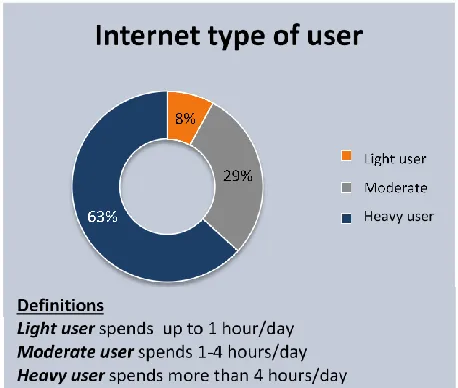
Respondents were asked about the frequency of using internet (every day, 2-3 times a day, once a week, once every two weeks and once a month) at each access point and the average hours they spend every time they hook to the internet (less than one hours, 1 hour, 1-2 hours, 2-3 hours, 3-4 hours and more than 4 hours). Monthly hours spend on internet were calculated per user by multiplying the frequency of usage for each access point with the average hours spend when accessing the internet in the specific access point. Most of the respondents (63%) have high usage rates, spending over 4 hours a day on the Internet.
Figure 1. Internet usage rate
Factors Affecting Customer Choice of ISPs
Table 4. Factorial Analysis for Consumer Choice
Variable
FACTOR
1
B
ra
nd
Ima
ge
2
Inf
or
ma
tio
n
3
Pe
rc
ept
ion
of
risk
RI1.1 I can be overcharged by an alternative service
provider -0.105 0.032 0.406
RI1.2 I may not receive the service I expect from
another provider 0.066 -0.006 0.354
RI1.3 I think buying the service from another service
provider will result in financial loss -0.007 -0.021 0.363 RI1.4 I am not sure that the signal will be stable with
another service provider. 0.063 -0.007 0.343
IN1.1 I ask for advice from others before purchasing
internet services. -0.045 0.423 0.079
IN1.2 I seek to read the opinions of others on the
service -0.050 0.468 0.011
IN1.3 I am interested in reading the information on
how internet service is provided by other companies 0.112 0.360 -0.108 IN1.4 Information provided via the Internet or at the
point of sale is satisfactory 0.312 0.108 -0.048 I1.1 I always had a good impression of my internet
provider 0.461 -0.052 0.000
I1.2 I believe that my service provider has a better
image than its competitors. 0.440 -0.038 0.034
Eigenvalue 2.486 1.735 1.297 % of Variance 24.861 17.352 12.973
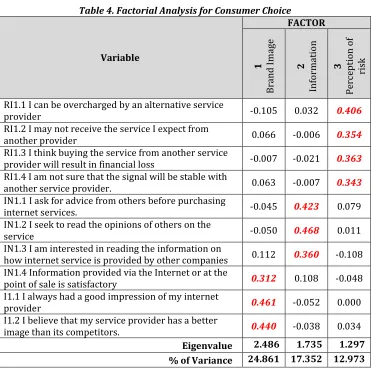
The first Factor with the Eigen value 2.486 covers 24.861% of the total variance. For this factor, we have the highest coefficient values from the group of questions I1.1 and I1.2 that belongs to the independent Corporate Image variables and IN1.4 that belongs to the independent variable Information. This factor will be named "Brand Image".
The second factor with the Eigen value 1.735 covers 17.352% of the total variance. For this factor, we have the largest coefficient values from the group of questions IN1.1 to IN1.3 that belongs to independent information variables. This factor will be named "Information" as it is defined by independent variables of the same name.
Table 5. Factor correlation matrix
Factor Brand Image Information Perception of Risk
Brand Image 1.000 .092 .263 Information .092 1.000 .067 Perception of
Risk .263 .067 1.000
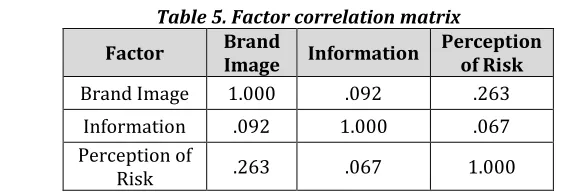
Table 5 presents the results of the factorial analysis for the reliability of the three factors of customer choice. The overall Cronbach Alfa coefficient is 0.649> 0.6 which is the very reliable level according to the Alpha Test Table.
Table 6. Reliability of composite variables
Variable Correlation
Coefficient
Cronbach Alpha by eliminating the variable RI1.1 I can be overcharged by an alternative service
provider 0.262 0.636
RI1.2 I may not receive the service I expect from another
provider 0.361 0.615
RI1.3 I think buying the service from another service
provider will result in financial loss 0.274 0.634 RI1.4 I am not sure that the signal will be stable with
another service provider. 0.343 0.618
IN1.1 I ask for advice from others before purchasing
internet services. 0.317 0.624
IN1.2 I seek to read the opinions of others on the service 0.283 0.631 IN1.3 I am interested in reading the information on how
internet service is provided by other companies 0.236 0.640 IN1.4 Information provided via the Internet or at the point
of sale is satisfactory 0.308 0.626
I1.1 I always had a good impression of my internet
provider 0.371 0.615
I1.2 I believe that my service provider has a better image
than its competitors. 0.402 0.608
Table 6 shows that correlation coefficients for all questions are low (less than 0.5). The exclusion of each of the questions does not affect the increase in the value of Cronbach Alfa. The Cronbach Alfa coefficient continues to represent a very reliable level (> 0.6). For these reasons, these factors influence consumer choice.
Pearson’s correlation coefficient
there is a perfect positive relationship (Tabachnick & Fidell, 2007).
The correlation analysis between independent variables and dependent variables is summarized in Table 7.
Table 7. Analysis of correlation between dependent and independent variables Independent
variable Dependent variable
Pearson Correlation
Sig
(1-tailed) Level
Perception of Risk 0.252 0.000 0.05
Information Customer Choice 0.128 0.004 0.05
Corporate Image 0.556 0.000 0.05
From the results can be concluded that:
• There is a very weak correlation between Perceived Risk and Consumer Selection, r = 0.252, p = 0.000
(p <0.05).
• There is a very weak correlation between Information and Consumer Selection, r = 0.128, p = 0.004
(p <0.05).
• There is a Medium Correlation between Corporate Image and Consumer Selection, r = 0.556, p = 0.000 (p <0.05).
Table 8. The Consumer Choice Model - Model Summaryd
M
od
el
R Square R Adjusted R Square
Std. Error of
the Estimate
Change Statistics
Du
rb
in
-Wat
so
n
R Square
Change Change F df1 df2 Change Sig. F 1 .252a .064 .061 1.33204 .064 28.602 1 421 .000 2 .272b .074 .070 1.32609 .011 4.788 1 420 .029 3 .564c .318 .313 1.13933 .244 149.979 1 419 .000 1.770
a. Predictors: (Constant), RI b. Predictors: (Constant), RI, IN c. Predictors: (Constant), RI, IN, I
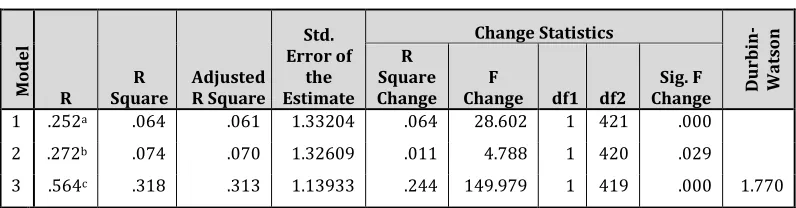
In Table 8 can be summarized that R2 (R Square) has values respectively 6.4%, 7.4% and 31.8%. This indicates that the complex variable Perceived Risk only affects 6.4% in the dependent Choice, whereas the largest influence is from the variables that are not included in the model. The value of R2 increases to 7.4% when the complex variable Information is added, and 31.8% when the complex variable Image is added. This indicates that the variable "I" significantly improves the model.
Multiple regression model
y = β 0 +β 1xi1 +β 2 x 2 +β p x ip +ε
for the dependent variables Consumer choice is given below:
Model 2: CC =3.885+0.243*RI+0.106*IN+ePK
Model 3: CC =2.422+0.082*RI+0.054*IN+0.461*I+ePK
Table 9. ANOVA for Customer Choice ANOVAd
Model Squares Sum of df Square Mean F Sig. Fkr
1 Regression 50.750 1 50.750 28.602 .000a
Residual 746.993 421 1.774 3.89
Total 797.743 422
2 Regression 59.170 2 29.585 16.824 .000b
Residual 738.573 420 1.759 3.04
Total 797.743 422
3 Regression 253.852 3 84.617 65.187 .000c
Residual 543.891 419 1.298 2.65
Total 797.743 422
a. Predictors: (Constant), RI b. Predictors: (Constant), RI, IN c. Predictors: (Constant), RI, IN, I d. Variable Choice
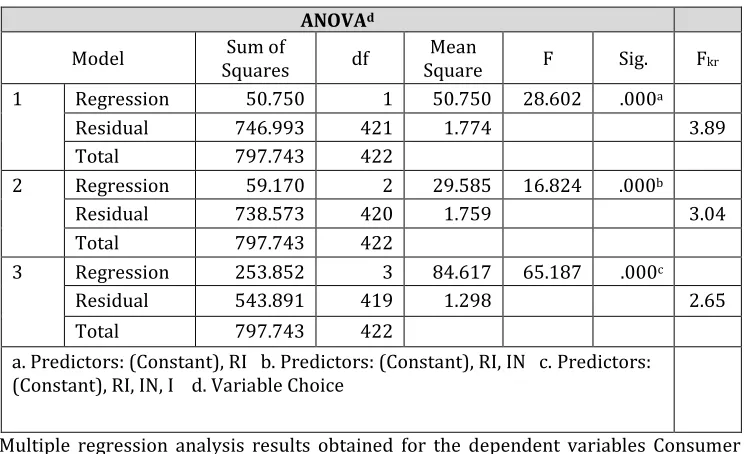
Multiple regression analysis results obtained for the dependent variables Consumer choice and complex variables perceived risk, information and Brand Image are presented in Table 10.
Table 10. Multiple regression between complex variables and Consumer Selection
Variable
Standardized Coefficients
Beta
t Sig. tkr Correlations Part
(Constant) 8.730 .0016
RI .081 1.913 .076 2.353
IN .052 1.282 .145
I .523 12.247 .0006 .513
Consumer Choice is expressed as follows:
Model 3: PK = 0.513 * I + ePK
Conclusions and implications
The key question of the research is to identify the factors that influence the customer choice of ISPs. Based on the literature review there were key factors influencing the customers’ decision among ISPs which relevance had to be tested in the Albanian market. The findings indicate that the choice of the customer is primarily influenced by the ISP image. This is supported by many researchers who propose that corporate image should be considered as an intangible asset. Brand image plays a decisive role in the process of choosing ISPs in Albania. Internet service providers should show particular attention to their image as a tool to build a competitive position. There is a common-sense among customers that a service provider with a good image will always perform well. Internet providers marketing strategies should focus on integrated marketing communication strategies such as advertising or public sponsorship, social responsibility to develop brand image and gain an outstanding position in the customer’s mind and influence their decision. Also, reinforcing the tangible and intangible benefits of the brands can positively contribute to strengthening their brand image.
Results show that consumer choice is not significantly affected by the level of perceived risk. Albanian consumers do not consider to waste time and effort in choosing the internet service provider. In a collectivist culture, it is thought that the risk is diminished by others' recommendations and company reputation, and no personal effort is sought in collecting, analyzing and comparing the information. In Albanian consumer psychology, the phrase "all are the same" still remains, without making major effort to compare between brands. This can be argued by the information factor and the impact of the amount of information required in the selection.
The factorial analysis and multiple regression analysis explored the relationship between information and consumer choice and indicated that consumer choice is not influenced by the information sought. In Albania, ISPs are concerned more in promotional offers rather than instructing consumers. There is no comparative information on Internet service providers in the country, such as the real speed of the Internet and how much it differs from the contract, how stable the service is, how long is the response time or technical assistance. Regulatory entities and companies do not publish periodic reports with real-time internet monitoring.
Detailed and comparative information from service providers and regulatory authorities would help consumers to have a vision much before making their choice and not just rely on the name of the company. Albanian customer choice is based on attitude by relying on the general impressions, intuition, and judgment of a brand. Studies show that attitudes are easier to keep in mind than the particular attributes among different brands. Most ISP customer’s collect very little information from outside sources before a purchase.
and its coverage in relation to the price which is perceived in the same level among the internet operators.
Indeed, the corporate image has the potential to influence customer choice and an ISP’s competitive standing. ISPs need to work on building corporate value and consistently delivering the high brand experience.
References
AKEP (2016). Statistical Report 2016. Retrieved from http://akep.al/.
Athanassopoulos, A.D., & Iliakopoulos, A. (2003). Modeling Customer Satisfaction in Telecommunications: Assessing the Effects of Multiple Transaction Points on the Perceived Overall Performance of the Provider. Production and Operations Management, 12(2), 224-245. doi: 10.1111/j.1937-5956.2003.tb00502.x. Blackwell, R.D., Miniard, P.W., & Engel, J.F. (2001). Consumer Behavior. Worth, Texas:
Dryden Press.
Chun, R. (2005). Corporate Reputation: Meaning and Measurement. International Journal of Management Reviews, 7(2), 91-109. doi:
10.1111/j.1468-2370.2005.00109.x.
Darley, W.K., Blankson, C., & Luethge, D.J. (2010). Toward an Integrated Framework for Online Consumer Behavior and Decision Making Process: A Review. Psychology & Marketing, 27(2), 94-116. doi: 10.1002/mar.20322.
Forsythe, S., & Shi, B. (2003). Consumer Patronage and Risk Perceptions in Internet Shopping. Journal of Business Research, 56(11), 867-875. doi: 10.1016/S0148-2963(01)00273-9.
Forsythe, S., Liu, C., Shannon, D., & Gardner, LC. (2006). Development of a Scale to Measure the Perceived Benefits and Risks of Online Shopping. Journal of Interactive Marketing, 20(2), 55-75. doi: 10.1002/dir.20061.
Gerpott, T.J. (2018). Relative fixed Internet connection speed experiences as antecedents of customer satisfaction and loyalty: An empirical analysis of consumers in Germany. Management & Marketing. Challenges for the Knowledge Society, 13(4), 1150-1173. doi: 10.2478/mmcks-2018-0029.
Giovanis, A.N., Zondiros, D., & Tomaras, P. (2014). The antecedents of customer loyalty for broadband services: The role of service quality, emotional satisfaction and corporate image. Procedia-Social and Behavioral Sciences, 148, 236-244. doi: 10.1016/j.sbspro.2014.07.039.
Gotsi, M., & Wilson, A. (2001). Corporate Reputation Management: Living the Brand. Management Decision, 39(2), 99-104. doi: 10.1108/EUM0000000005415. Grardberg, N.A., & Fombrun, C.J. (2002). The Global Reputation Quotient Project: First
Steps Towards a Cross-Nationally Valid Measure of Corporate Reputation. Corporate Reputation Review, 4(4), 303-307.
Grzybowski, L., Hasbi, M., & Liang, J. (2018). Transition from copper to fiber broadband: The role of connection speed and switching costs. Information Economics and Policy, 42(1), 1-10. doi: 10.1016/j.infoecopol.2017.07.001. Hu, A.W., & Hwang, I. (2006). Measuring the Effects of Consumer Switching Costs on
Switching Intention in Taiwan Mobile Telecommunication Services. Journal of American Academy of Business, 9(1), 75-85.
McColl-Kennedy, J.R., & Fetter, J.R.E. (2001). Dimensions of Consumer Search Behavior in Services. Journal of Services Marketing, 13(3), 242-265. doi:
10.1108/08876049910273871.
Mitra, K., Reiss, M.C., & Capella, L.M. (1999). An Examination of Perceived Risk,
Information Search and Behavioral Intentions in Search, Experience and Credence Services. Journal of Services Marketing, 13(3), 208-228. doi:
10.1108/08876049910273763.
Nguyen, N., & Leblanc, G. (2001). Corporate Image and Corporate Reputation in Customers' Retention Decisions in Services. Journal of Retailing and Consumer Services, 8, 227-236. doi: 10.1016/S0969-6989(00)00029-1.
Parasuraman, A., Zeithaml, V.A., & Berry, L.L. (1985). A Conceptual Model of Service Quality and Its Implications for Future Research. Journal of Marketing, 49(4), 41-50. doi: 10.2307/1251430.
Schiffman, L.G., & Kanuk, L. (2007). Consumer Behaviour. Upper Saddle River, NJ: Prentice Hall
Sekaran, U. (2003). Research Method for Business: A Skill Building Approach. New York, NY: John Wiley & Sons.
Senecal, S., Kalczynski, P.J., & Nantel, J. (2005). Consumer’s decision-making process and their shopping behavior: a clickstream analysis. Journal of Business Research, 58, 1599-1608. doi: 10.1016/j.jbusres.2004.06.003.
Solomon, M., Bamossy, G., Askegaard, S., & Hogg, M. (2013). Consumer Behaviour: A European Perspective. London: Prentice Hall.
Srinivasan, N., & Ratchford, B.T. (1991). An empirical test of a model of external search for automobiles. Journal of Consumer Research, 18, 233–242.
Tabachnick, B.G., & Fidell, L.S. (2007). Using multivariate statistics. Boston, MA: Allyn & Bacon/Pearson Education.
Wang, Y., Lo, H., & Yang, Y. (2004). An Integrated Framework for Service Quality, Customer Value, Satisfaction: Evidence from China's Telecommunication Industry. Information Systems Frontiers, 6(4), 325-340. doi:
10.1023/B:ISFI.0000046375.72726.67.