Motivating Capital Investment by Using the Audit
Process to Increase Financial Transparency
J. Reid Cummings, D.B.A. (Corresponding Author)
University of South Alabama
5811 USA South Drive, MCOB 126, Mobile, Alabama 36688
E-mail: [email protected]
Gabriel G. Ramirez, Ph.D.
Kennesaw State University
Divesh S. Sharma, Ph.D.
Kennesaw State University
Kyre D. Lahtinen, Ph.D.
University of South Alabama
Received: Sep. 5, 2017 Accepted: March 10, 2018 Published: June 1, 2018
doi:10.5296/ajfa.v10i1.11810 URL: https://doi.org/10.5296/ajfa.v10i1.11810
Abstract
This study examines the relationship between REITs’ uses of the audit process to increase financial transparency, and their ability to attract and/or maintain reasonable access to capital investment. We find that capital investment is positively and significantly associated with auditor quality, specialization, and reputation. After controlling for the effects of the 2007-2008 financial crisis, we find that when REITs seek to attract new capital investment, using the audit process to increase financial transparency is just as important before the crisis as after it. These findings suggest that regardless of the economic conditions, auditor quality, specialization, and reputation add value.
1. Introduction
United States federal law requires Real Estate Investment Trusts (REITs) to distribute at least 90% of their net income to shareholders as dividends (Scherrer, 2004). The resulting reduced cash flow constraint propels REITs to access capital markets frequently. Historically, REITs’ have successfully done so, possibly due to investors’ views that REITs present a safe way to invest in real estate (Goebel & Kim, 1989; Goodman, 2000, 2003).(Note 1) As lingering economic uncertainties hampered financial markets after the 2007-2008 financial crisis, raising new capital proved challenging for many firms. Even though during the post-crisis period REITs continued to offer attractive investment opportunities,(Note 2) because many post-crisis real estate markets were in decline, attracting investors was challenging (Basse, Friedrich, & Bea, 2009). Therefore, because of the need for new capital, it was important that REITs pursue strategies that worked to increase financial transparency so they could motivate new capital investment.
The complexity of a firm’s capital structure decisions often increases because of information asymmetries between firm managers and potential investors (Myers, 1984; Titman & Wessels, 1988). By decreasing information asymmetries, firms can increase their financial transparency; when they do so successfully, they are more likely to motivate new capital investment (Beatty, 1989; Carter & Manaster, 1990). In the course of seeking new capital, the offering prospectus is a tool firms use to send signals of increased financial transparency to potential investors and lenders. By including information beyond that which is required by regulators, firms can reveal additional information about their intrinsic value, investment grade, and future prospects (Deeds, Decarolis, and Coombs, 1997).
By revealing extensive, detailed information about their auditor, and audit process, firms can effectively decrease information asymmetries and send signals about their increased financial transparency (Danielsen, Van Ness, & Warr, 2007; Danielsen, Harrison, Van Ness, & Warr, 2009, 2014; Datar, Feltham, & Hughes, 1991; Feltham, Hughes, & Simunic, 1991; Titman & Trueman, 1986). For example, research shows that firms hire higher quality auditors, and often pay much higher audit fees to signal investors that their financial information is highly credible (Datar, Feltham, & Hughes, 1991; Titman & Trueman, 1986). Because investors interpret the signal to mean the auditor will be less likely to yield to management pressures to withhold or obfuscate negative information, they often view the firm as being more financially transparent. Thus, in a sense, the firm is relying on the reputational capital of the higher quality, more expensive auditor to signal investors that they are more financially transparent (Feltham, Hughes, & Simunic, 1991). If firms can successfully use the audit process to convey increased financial transparency, in doing so, logic dictates expectations of heightened access to capital investment. Thus far, however, there has been no examination of whether increased transparency via the auditing process leads to better access to capital markets, or more importantly, whether it does so during periods of high capital market illiquidity caused by major financial system shocks.
transparency, and REITs’ access to capital investment. This is an important issue because as REITs must frequently access capital markets, they need strategies that enhance their efforts to motivate investment. Moreover, for REITs, this issue takes on added significance when volatile financial market conditions make accessing capital difficult. Overall, we find that capital investment is positively and significantly associated with three commonly used audit-related attributes: auditor quality (captured by higher audit fees), auditor specialization (captured by industry-audit specialization), and auditor reputation (captured by the audit firm being a Big 4 auditor). After controlling for the effects of the financial crisis, we find that when REITs seek to attract new capital investment, using the audit process to increase financial transparency is just as important before the crisis as after it.
The remainder of this paper proceeds as follows. The next section discusses existing research supporting using the audit process to convey increased financial transparency to investors. The third section presents hypotheses development. The fourth section describes dataset construction. The fifth section outlines the study’s research design and methodology. The sixth section presents results and analysis discussion. The last section offers concluding remarks.
2. Literature Review
We base our examination on a wide-ranging, well-developed body of academic literature. Drawing on economics, signaling theory provides the foundation for our study. Guided by the finance literature, we include often-used measures to capture financial transparency, and information asymmetry and opacity. Following the auditing and accounting literature, we use three audit-related attributes to proxy for REITs’ efforts to increase transparency. Finally, we take into account multiple REIT-related regulatory, structural, investment, and operational characteristics rooted in the real estate literature.
2.1 Information Asymmetry, Financial Transparency Signaling, Liquidity, and the Audit Process
When raising capital, firms can use the audit process to signal investors about their reduced information asymmetry and increased financial transparency (Healy & Palepu, 2001). Firms can signal their financial transparency, and by extension, their credibility, by providing highly accurate and reliable audited financial statements (Hope, Thomas, & Vyas, 2009). To be credible, signals must be costly and difficult to replicate (Spence, 1973). Three audit process attributes investors use to evaluate a firm’s financial transparency are hiring high quality auditors (costs associated with higher audit fees), audit industry specialists (costs associated with industry audit specialization), and audit firms with superior reputations (costs associated with Big 4 audit firm status) (Datar et al., 1991; Titman & Trueman, 1986).
2.2Financial Transparency and Auditor Quality
Numerous studies use audit fees to signal financial transparency. Danielsen et al. (2009) examine which firms are most likely to benefit from a higher priced audit. They find that firms that signal greater financial transparency through heavier investment in audit services reduce their capital costs when offering seasoned equity issues. Beatty (1989) finds that firms who pay a premium for audit services have lower initial returns after going public, which suggests that firms willing to pay more for audit services do so to send investors signals of increased financial transparency. Higgs and Skantz (2006) conclude that investors interpret high audit fees as signals of a firm’s commitment to high earnings quality. Hay and Davis (2002) find that firms seeking higher quality audits do so for signaling reasons. Peel and Roberts (2003) find that small firms willingly hire higher priced audit firms to send signals of operations and earnings quality to investors. Danielson et al., (2009), suggest that because REITs can derive benefits from hiring high quality auditors, doing so to convey financial transparency can be an important aspect of REITs’ capital structure mechanisms. It seems logical, therefore, that if using vigorous audit services “can improve liquidity for any firm, it seems especially likely to do so for REITs” (Danielsen et al., 2009, p. 517).
2.3Financial Transparency and Auditor Specialization
REIT audits are complex, partly because they operate in a highly regulated environment, and partly because the majority of their assets are valuation driven. Equity REITs hold independent, self-contained property investments, each with their own sources and uses of funds, and each with their own varying degrees of risk. These may be difficult for the auditor to understand or value (Danielsen et al., 2009; Friday & Sirmans, 1998). Because mortgage REITs hold myriad commercial mortgage-backed securities, real estate mortgage notes, and other types of real estate credit facilities, without a thorough understanding of the specific risks associated with each instrument within the portfolio, auditing a mortgage REIT might prove difficult.
workings of a particular industry (Lim & Tan, 2010). Because of the auditor’s advanced knowledge about the specific nature of an auditee’s industry, it is less likely its managers will deceive or mislead the auditor (Solomon, Shields, & Whittington, 1999). Equally important is that precisely because of the audit firm’s industry specialization, safeguarding its reputational capital is also an important incentive for the auditor to perform quality audits (Watts & Zimmerman, 1983). Investors understand industry-audit specialists have more to lose. Because they value the significance of an audit firm’s commitment to becoming an industry specialist, they also realize that firms often hire industry-audit specialists to improve their disclosures (Dunn & Mayhew, 2004), thereby enhancing their transparency.
2.4Financial Transparency and Auditor Reputation
Auditor reputation is often associated with auditor size, because larger audit firms have more resources and can provide higher quality audits than smaller audit firms can (DeAngelo, 1981). Simunic and Stein (1987), Beatty (1989), and Chan, Ezzamel, and Gwilliam (1993) show that large audit firms charge higher audit fees than their smaller competitors because of the demand for their higher quality services, generally driven by their higher audit quality reputation. Audit firm size and reputation are also likely to convey information about the financial transparency of the auditee. Because hiring auditors with higher quality reputations is costly, firms often do so as a way of signaling increased financial transparency to investors (Titman and Trueman, 1986; Feltham et al., 1991). When firms hire auditors with higher quality reputations (such as Big 4 firms), they also benefit from the reputational quality of the audit firm (Danielson et al., 2007). When information asymmetry is high, such as when a firm is preparing to issue equity for the first time, firms are more likely to engage a larger audit firm (e.g. Big 4 auditor) to signal financial transparency. Balvers et al. (1988) and Firth and Smith (1992) find that firms experience less initial public offering underpricing when they hire larger audit firms. As investors’ perceptions of higher quality auditor reputation add credibility to the audit process and enhance financial transparency, it is more likely that investors will view firms that hire auditors with higher quality reputations more favorably than those that do not.
2.5 REITs’ Capital Access and the Financial Crisis
3. Methodology
Exogenous events such as the financial crisis can shock and disrupt capital markets. As many investors respond to such shocks by moving money from equities and corporate debt into safer investments such as government debt and cash, often the result is substantially increased capital market illiquidity. The severity of the financial crisis’ shock to the financial system, and the ensuing post-crisis market conditions caused major problems for many firms needing to raise new capital. After the crisis, values in many real estate market values were declining and investors were generally shying away from real estate investments (DeLisle, 2007, 2008). Thus, for REITs, attracting new capital in such an environment was likely quite difficult.
3.1 Hypothesis Development
Earlier, we highlight several studies that examine the different ways firms signal financial transparency to investors to attract new capital investment. In this study, we use a two-part approach to examine the relationship between REITs’ use of the audit process to signal increased financial transparency and their access to new capital. In the first part of the analysis, we examine the relationship between REITs’ use of the audit process and their access to new capital, posited by the following hypothesis:
Hypothesis 1:There is a positive association between the audit process and (a) equity investment in REITs, (b) debt investment in REITs; and (c) combined equity and debt investment in REITs.
In the second part of the analysis, we examine the relationship between REITs’ use of the audit process and their access to new capital, accounting for possible mediating effects of the financial crisis, posited by the following hypothesis:
Hypothesis 2: The financial crisis of 2007-2008 positively influenced the relationship between the audit process and (a) equity investment in REITs, (b) debt investment in REITs, and (c) combined equity and debt investment in REITs.
3.2 Data Selection and Sample Construction
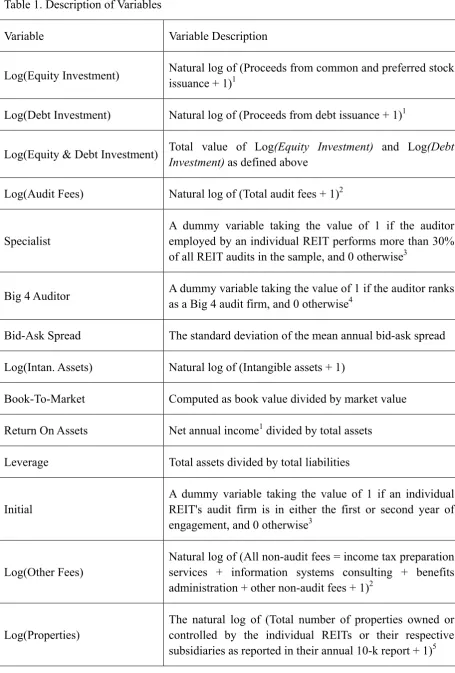
Table 1. Description of Variables
Variable Variable Description
Log(Equity Investment) Natural log of (Proceeds from common and preferred stock
issuance + 1)1
Log(Debt Investment) Natural log of (Proceeds from debt issuance + 1)1
Log(Equity & Debt Investment) Total value of Log(Equity Investment) and Log(Debt
Investment) as defined above
Log(Audit Fees) Natural log of (Total audit fees + 1)2
Specialist
A dummy variable taking the value of 1 if the auditor employed by an individual REIT performs more than 30% of all REIT audits in the sample, and 0 otherwise3
Big 4 Auditor A dummy variable taking the value of 1 if the auditor ranks
as a Big 4 audit firm, and 0 otherwise4
Bid-Ask Spread The standard deviation of the mean annual bid-ask spread
Log(Intan. Assets) Natural log of (Intangible assets + 1)
Book-To-Market Computed as book value divided by market value
Return On Assets Net annual income1 divided by total assets
Leverage Total assets divided by total liabilities
Initial
A dummy variable taking the value of 1 if an individual REIT's audit firm is in either the first or second year of engagement, and 0 otherwise3
Log(Other Fees)
Natural log of (All non-audit fees = income tax preparation services + information systems consulting + benefits administration + other non-audit fees + 1)2
Log(Properties)
Log(Subsidiaries)
The natural log of (Total number of subsidiaries owned or controlled by the individual REITs or their respective subsidiaries as reported in their annual 10-k report + 1)5
Foreign
A dummy variable taking the value of 1 if an individual REIT has operations outside of the United States as reported in CRSP/Compustat database, and 0 otherwise
Extra/Disc Items
A dummy variable taking the value of 1 if an individual REIT has extraordinary items and/or discontinued operations as reported in the CRSP/Compustat database, and 0 otherwise
REIT Type A dummy variable taking the value of 1 if an individual
REIT is Y-type, and 0 otherwise6
Notes:1Log values computed on values reported in the Compustat database. 2Log values computed on values reported in the Audit Analytics database. 3Specific REIT audit and auditor information reported in the Audit Analytics database. 4The group of audit firms currently known as the “Big 4” includes PriceWaterhouseCoopers, Deloitte & Touche, Ernst & Young, and KPMG, ranked "1" through "4" based on annual revenues, respectively, as reported at http://www.big4.com. 5Specific, individual REIT 10-k annual reports accessed at http://www.sec.gov.6REIT Type indicates type of REIT industry classification including Multifamily, Manufacturing, Healthcare, Shopping Center, Freestanding, Regional Mall, Lodging/Resort, Diversified, Office, Industrial, Office/Industrial Mixed, Self-Storage, Commercial Mortgage, and Residential Mortgage.
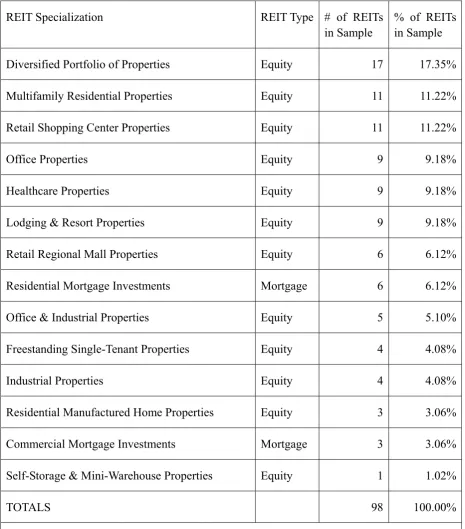
Table 2. REIT-Type Distributions
REIT Specialization REIT Type # of REITs
in Sample
% of REITs in Sample
Diversified Portfolio of Properties Equity 17 17.35%
Multifamily Residential Properties Equity 11 11.22%
Retail Shopping Center Properties Equity 11 11.22%
Office Properties Equity 9 9.18%
Healthcare Properties Equity 9 9.18%
Lodging & Resort Properties Equity 9 9.18%
Retail Regional Mall Properties Equity 6 6.12%
Residential Mortgage Investments Mortgage 6 6.12%
Office & Industrial Properties Equity 5 5.10%
Freestanding Single-Tenant Properties Equity 4 4.08%
Industrial Properties Equity 4 4.08%
Residential Manufactured Home Properties Equity 3 3.06%
Commercial Mortgage Investments Mortgage 3 3.06%
Self-Storage & Mini-Warehouse Properties Equity 1 1.02%
TOTALS 98 100.00%
Notes:98 REITs maintained REIT status during the entire sample period of 2002-2011 as confirmed in specific, individual REIT 10-k annual reports.
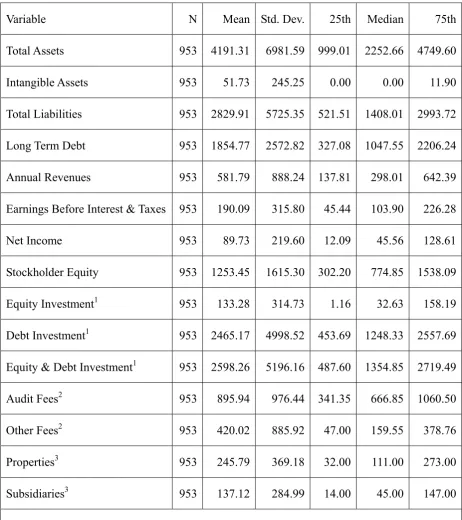
Table 3. Selected REIT Summary Statistics
Variable N Mean Std. Dev. 25th Median 75th
Total Assets 953 4191.31 6981.59 999.01 2252.66 4749.60
Intangible Assets 953 51.73 245.25 0.00 0.00 11.90
Total Liabilities 953 2829.91 5725.35 521.51 1408.01 2993.72
Long Term Debt 953 1854.77 2572.82 327.08 1047.55 2206.24
Annual Revenues 953 581.79 888.24 137.81 298.01 642.39
Earnings Before Interest & Taxes 953 190.09 315.80 45.44 103.90 226.28
Net Income 953 89.73 219.60 12.09 45.56 128.61
Stockholder Equity 953 1253.45 1615.30 302.20 774.85 1538.09
Equity Investment1 953 133.28 314.73 1.16 32.63 158.19
Debt Investment1 953 2465.17 4998.52 453.69 1248.33 2557.69
Equity & Debt Investment1 953 2598.26 5196.16 487.60 1354.85 2719.49
Audit Fees2 953 895.94 976.44 341.35 666.85 1060.50
Other Fees2 953 420.02 885.92 47.00 159.55 378.76
Properties3 953 245.79 369.18 32.00 111.00 273.00
Subsidiaries3 953 137.12 284.99 14.00 45.00 147.00
Notes: All information is for the entire sample period of 2002-2011. Audit Fees and Other Fees expressed in $0,000’s; all other financial data presented in $0,000,000’s. 1Financial data are as reported in the CRSP/Compustat databases. 2Audit and Other Fees are as reported in
the Audit Analytics database. 3Properties and subsidiaries information are as reported in each of the REITs' annual reports available at http://www.sec.gov.
3.3 Research Design and Methodology
financial transparency and their access to capital investment, the outcome of interest is Capital Investment, for which we proxy by using three investment measures: equity, debt, and combined equity and debt investment. We incorporate the audit-related attributes of auditor quality and auditor reputation (following Danielson et al., 2009), with auditor specialization to capture audit process transparency. In the first part of the analysis, the study period is much broader, covering the years of 2002-2011. In the second part of the analysis, we gauge the impact of the financial crisis.
3.3.1 Empirical Model – Part 1
In addition to the variables we use to capture the Transparency dimension as detailed below, we include three additional vectors of variables to capture the dimensions of Firm Characteristics, Auditor Relationship, and REIT Complexity. We also use a number of dummy variables to control for effects related to specific REIT-types and/or changes across time. The empirical model for the first part of the analysis takes the following form:
Capital Investment = ᶂ {Transparency, Firm Characteristics, Auditor Relationship, REIT
Complexity}. (1)
3.3.2 Transparency Vector
Earlier, we mention research findings that firms often pay higher audit fees to hire higher quality auditors to signal investors that their financial information is highly credible (Datar, Feltham, & Hughes, 1991; Titman & Trueman, 1986). Therefore, the central piece of the investigation centers on Transparency. To proxy for auditor quality, we use the variable
Log(Audit Fees),(Note 6) which is the natural log of the sum of one and audit fees.(Note 7)
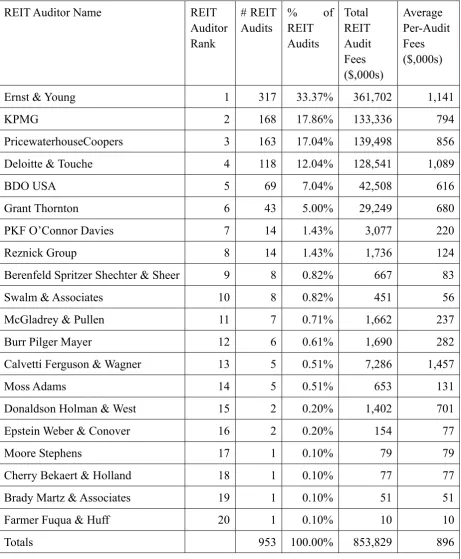
Table 4. REIT Auditors.
REIT Auditor Name REIT
Auditor Rank
# REIT Audits
% of
REIT Audits
Total REIT Audit Fees ($,000s)
Average Per-Audit Fees ($,000s)
Ernst & Young 1 317 33.37% 361,702 1,141
KPMG 2 168 17.86% 133,336 794
PricewaterhouseCoopers 3 163 17.04% 139,498 856
Deloitte & Touche 4 118 12.04% 128,541 1,089
BDO USA 5 69 7.04% 42,508 616
Grant Thornton 6 43 5.00% 29,249 680
PKF O’Connor Davies 7 14 1.43% 3,077 220
Reznick Group 8 14 1.43% 1,736 124
Berenfeld Spritzer Shechter & Sheer 9 8 0.82% 667 83
Swalm & Associates 10 8 0.82% 451 56
McGladrey & Pullen 11 7 0.71% 1,662 237
Burr Pilger Mayer 12 6 0.61% 1,690 282
Calvetti Ferguson & Wagner 13 5 0.51% 7,286 1,457
Moss Adams 14 5 0.51% 653 131
Donaldson Holman & West 15 2 0.20% 1,402 701
Epstein Weber & Conover 16 2 0.20% 154 77
Moore Stephens 17 1 0.10% 79 79
Cherry Bekaert & Holland 18 1 0.10% 77 77
Brady Martz & Associates 19 1 0.10% 51 51
Farmer Fuqua & Huff 20 1 0.10% 10 10
Totals 953 100.00% 853,829 896
Notes:REIT Auditor Rank ranked first by the number of REIT audits performed and then by the total audit fees for REIT auditsas reported in Audit Analytics database.
define or value, aggravated by the fact that firms often choose not to reveal certain information that they view as proprietary. Researchers commonly use intangible assets to proxy for information asymmetry or opacity. Therefore, we include two additional variables within the Transparency Vector: Bid-Ask Spread, which we construct using the standard deviation of the mean annual bid-ask spread of each REIT’s stock price; and Log(Intang
Assets), which is the natural log of the sum of one and the total value of each REIT’s
intangible assets.(Note 10)
3.3.3 Firm Characteristics Vector
Within the sample, REITs vary by type, size, and industry focus. To capture and control for the differences between them, we use variables within the Firm Characteristics Vector. First in the group is Book-To-Market, which we calculate by dividing book value (total assets minus total liabilities and total intangible assets) by market value (common shares outstanding at year’s end multiplied by share price at year’s end). The second variable is
Return-On-Assets, the result of dividing net income by total assets. Rounding out the Firm
Characteristics Vector is Leverage, which we compute by dividing total liabilities by total assets.
3.3.4 Auditor Relationship Vector
extension, reduce audit quality, non-audit fees can influence investors’ perceptions of firm transparency. Although the research in this paper does not specifically explore the impact of non-audit fees, we include the variable Log(Other Fees), the natural log of the sum of non-audit fees and one, (Note 11) to control for the impact of non-audit fees.
3.3.5 REIT Complexity Vector
As we discuss earlier, auditing REITs is often a complex process, partly because REITs operate in a highly regulated environment, and partly because of the means used to value investments within their portfolios. We include a number of observable variables within the REIT Complexity Vector to capture the complex asset types and/or corporate structures associated with the REITs within the sample. The variables we use include Log(Subsidiaries), the natural log of the sum of one and the total number of subsidiaries owned or controlled by the REIT; (Note 12) Log(Properties), the natural log of the sum of one and the total number of properties owned or controlled by the REIT or one of its subsidiaries;(Note 13) Foreign, a dummy variable taking the value of one if the REIT conducts business outside of the United States, and zero otherwise; and Extra/Disc Items, a dummy variable taking the value of one if the REIT has extraordinary items or discontinued operations, and zero otherwise.Within the sample, there are 12 different equity REITs and 2 different mortgage REITs, so for robustness, we also use dummy variables to control for each of the different REIT-types.
3.3.6 Testable Equation for Hypotheses 1-3
To test each of Hypotheses 1-3, we conduct four separate estimations. In the first three estimations, we individually test each of the audit-related attributes. In the fourth estimation, we combine all attributes together. We do this to account for any potential collinearity problems that may occur from grouping all variables within the same model. Again, using data from all REITs during the entire sample period, the outcome of interest is Capital Investment, which we capture using equity, debt, and combined equity and debt investment, using the testable form of Equation (1) as follows:
Capital Investment =β0+β1∙Log(Audit Fees)+β2∙Specialist + β3∙Big 4 Auditor +β4∙Bid-Ask
Spread + β5∙Log(Intan Assets) + β6∙Book-To-Market + β7∙Return-On-Assets +
β8∙Leverage+β9∙Initial+β10∙Log(OtherFees)+β11∙Log(Properties) + β12∙Log(Subsidiaries)
+ β13∙Foreign + β14∙Extra/Disc Items + β15-26∙REIT Type + ε. (2)
3.3.7Empirical Model – Part 2
Thus far, the research question examines the relationship between REITs’ use of the audit process as a means to convey increased financial transparency and access to capital investment. In the second part of the analysis, we consider the impact of the financial crisis. After adding a fifth vector, Financial Crisis, the extended empirical model takes the following form:
Capital Investment = ᶂ {Transparency, Firm Characteristics, Auditor Relationship, REIT
3.3.8 Financial Crisis Vector
Using the model shown in the form of Equation (2), we add additional variables within the Financial Crisis Vector to investigate the interactive effects between the crisis and each of the audit-related attributes. The first variable added is Crisis, a dummy variable that takes the value of one for the period 2008-2011, and zero for the period 2002-2007. We also add three interaction terms. First, we use Crisis*Log(Audit Fees), which captures the interaction between Crisis and Log(Audit Fees), to measure whether or not the relationship between audit fees and capital investment is affected by the financial crisis. Second, we use
Crisis*Specialist, which captures the interaction between Crisis and Specialist, to measure
whether or not the relationship between industry-audit specialist and capital investment is affected by the financial crisis. Third, we use Crisis*Big 4 Auditor, which captures the interaction between Crisis and Big 4 Auditor, to measure whether or not the relationship between Big 4 auditor and capital investment is affected by the financial crisis. The testable form of Equation (3) is as follows:
Capital Investment = β0 + β1∙Crisis + β2∙Log(Audit Fees) + β3∙Crisis*Log(Audit Fees) +
β4∙Specialist + β5∙Crisis*Specialist + β6∙Big 4 Auditor + β7∙Crisis*Big 4 Auditor +
β8∙Bid-Ask Spread + β9∙Log(Intan Assets) + β10∙Book-To-Market + β11∙Return-On-Assets +
β12∙Leverage + β13∙Initial + β14∙Log(Other Fees) + β15∙Log(Properties) +
β16∙Log(Subsidiaries) + β17∙Foreign+ β18∙Extra/Disc Items + β19-30∙REIT Type + ε. (4)
We test each hypothesis using robust regression estimations. We also account for the possibility of any firm- or time-related invariant characteristics affecting the REITs within the sample. For example, a diversified REIT that invests in different types of properties, such as regional shopping malls, office properties, or timberland, may have entirely different factors affecting their abilities to raise capital, than for example, a REIT that only invests in one type of property. Likewise, as business cycles change over time, it is possible that a REIT that invests strictly in one property type, for example retail properties, may experience different investor responses when seeking equity as opposed to another type of REIT. This may be due to one particular property sector falling out of favor as an investment, or having trouble at one point in time versus other types of REITs in the same period. Therefore, in addition to using dummy variables for each firm year to account for changes over time, we also use dummies to control for the different types of REITs within the sample.
4. Results and Discussion
4.1 Descriptive Statistics
of REITs conducts foreign operations. Slightly more than half of the audits report either an extraordinary item (a net income adjustment made due to an unusual or infrequent occurrence, such as a loss due to a hurricane), or a discontinued operation (a net income adjustment made because a portion of a company’s operation is discontinued, such as due to the sale of an asset).
Table 5. Descriptive Statistics: Dependent & Independent Variables
Variable N Mean Std. Dev. 25th Median 75th
Log(Equity Investment) 953 3.132471 2.217645 0.77 3.52 5.07
Log(Debt Investment) 953 6.792827 1.707107 6.12 7.13 7.85
Log(Equity & Debt Investment) 953 6.880828 1.680798 6.19 7.21 7.91
Log(Audit Fees) 953 13.28539 0.9523914 12.74 13.41 13.87
Specialist 953 0.3326338 0.471404 0.00 0.00 1.00
Big 4 Auditor 953 0.9223505 0.2677598 1.00 1.00 1.00
Bid-Ask Spread 953 0.0043952 0.00625 0.00 0.00 0.00
Log(Intangible Assets) 953 1.351846 1.936908 0.00 0.00 2.56
Book-To-Market Ratio 953 0.5723122 2.181254 0.35 0.52 0.72
Return On Assets 953 0.0263103 0.0562677 0.01 0.03 0.05
Leverage 953 0.6018785 0.1928988 0.50 0.59 0.70
Initial 953 0.1867786 0.3899383 0.00 0.00 0.00
Log(Other Fees) 953 11.27902 3.13359 10.76 11.98 12.84
Log(Properties) 953 4.258593 2.04574 3.50 4.72 5.61
Log(Subsidiaries) 953 3.805615 1.611061 2.71 3.83 5.00
Foreign 953 0.0209864 0.1434138 0.00 0.00 0.00
Extra.& Disc. Items 953 0.5299056 0.4993669 0.00 1.00 1.00
Notes: The table above presents descriptive statistics for the variables used in the regressions (except for REIT-type and Year Dummies).
4.2 Results of Hypothesis Testing
drop in financial markets activity after the crisis. Negative and significant coefficients for the financial crisis dummy would confirm this expectation. We also expect to find that after the crisis, REITs that utilize the audit process to increase financial transparency would experience greater equity, debt, and combined equity and debt capital investment than REITs that did not do so. Positive and significant coefficients for the interaction terms will confirm these expectations, and allow interpretation of the main effects of the individual audit-related attributes.
4.2.1 Hypothesis 1 Results
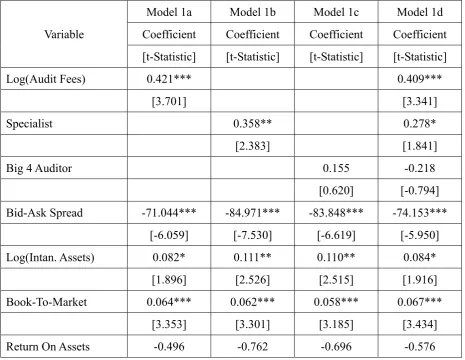
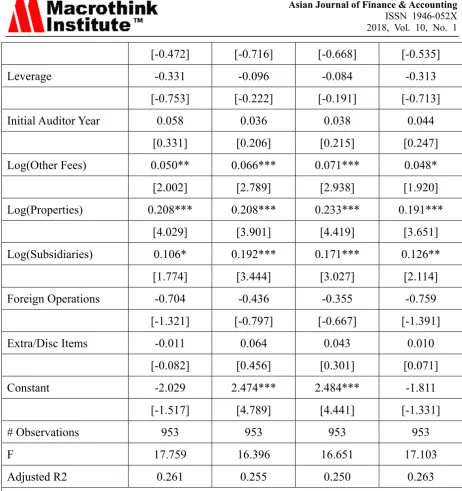
Table 6 below shows the results for testing Hypothesis 1(a) that there is a positive association between the audit process and equity investment in REITs. In Models 1a and 1b, the coefficients for Log(Audit Fees) and Specialist are positive and significant (Log(Audit Fees), β = 0.421 and Specialist, β = 0.358, respectively). Model 1d yields similar results (Log(Audit
Fees), β = 0.409 and Specialist, β = 0.278, respectively). These results provide partial support
for the hypothesis, suggesting that investors view REITs that either pay higher audit fees or engage industry-audit specialists as more transparent, and are willing to provide equity investment.
Table 6. Results of OLS Regression testing the expectation of a positive association between audit-related attributes and equity investment in REITs
Variable
Model 1a Model 1b Model 1c Model 1d
Coefficient Coefficient Coefficient Coefficient
[t-Statistic] [t-Statistic] [t-Statistic] [t-Statistic]
Log(Audit Fees) 0.421*** 0.409***
[3.701] [3.341]
Specialist 0.358** 0.278*
[2.383] [1.841]
Big 4 Auditor 0.155 -0.218
[0.620] [-0.794]
Bid-Ask Spread -71.044*** -84.971*** -83.848*** -74.153***
[-6.059] [-7.530] [-6.619] [-5.950]
Log(Intan. Assets) 0.082* 0.111** 0.110** 0.084*
[1.896] [2.526] [2.515] [1.916]
Book-To-Market 0.064*** 0.062*** 0.058*** 0.067***
[3.353] [3.301] [3.185] [3.434]
[-0.472] [-0.716] [-0.668] [-0.535]
Leverage -0.331 -0.096 -0.084 -0.313
[-0.753] [-0.222] [-0.191] [-0.713]
Initial Auditor Year 0.058 0.036 0.038 0.044
[0.331] [0.206] [0.215] [0.247]
Log(Other Fees) 0.050** 0.066*** 0.071*** 0.048*
[2.002] [2.789] [2.938] [1.920]
Log(Properties) 0.208*** 0.208*** 0.233*** 0.191***
[4.029] [3.901] [4.419] [3.651]
Log(Subsidiaries) 0.106* 0.192*** 0.171*** 0.126**
[1.774] [3.444] [3.027] [2.114]
Foreign Operations -0.704 -0.436 -0.355 -0.759
[-1.321] [-0.797] [-0.667] [-1.391]
Extra/Disc Items -0.011 0.064 0.043 0.010
[-0.082] [0.456] [0.301] [0.071]
Constant -2.029 2.474*** 2.484*** -1.811
[-1.517] [4.789] [4.441] [-1.331]
# Observations 953 953 953 953
F 17.759 16.396 16.651 17.103
Adjusted R2 0.261 0.255 0.250 0.263
Notes: In all models, the dependent variable is Log(Equity Investment), with the model variation being the respective inclusion or exclusion of Log(Audit Fees), Specialist, and Big 4
Auditor. Bid-Ask Spread is an often-used measure to capture transparency. Log(Intan. Assets)
captures firm's level of information asymmetry or opacity.Book-To-Market, Return On Assets,
and Leverage capture individual REIT firm characteristics. Initial and Log(Other Fees)
capture individual REIT-auditor relationships. Log(Properties), Log(Subsidiaries), Foreign,
and Extra/Disc Items capture firm complexity. REIT Type and Year Dummies not reported.
Regression estimations are robust and statistical significance shown as: * p < 0.05, ** p < 0.01, *** p < 0.001, respectively.
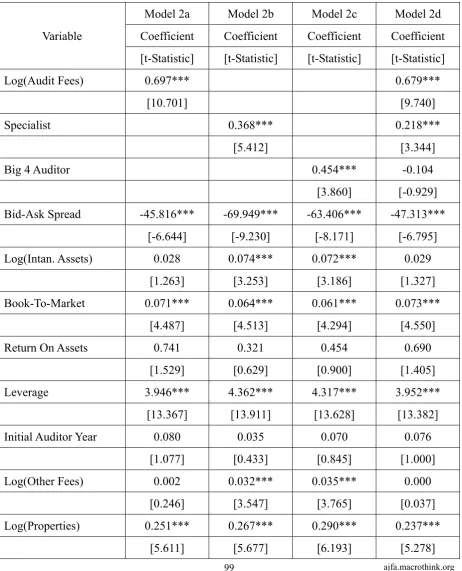
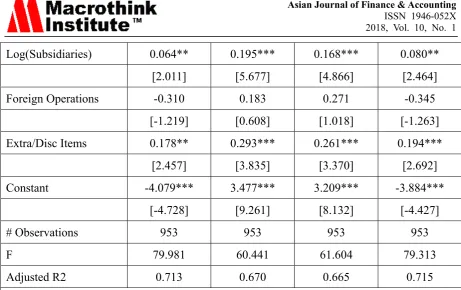
for Log(Audit Fees) and Specialist are positive and significant (β = 0.679 and β = 0.218, respectively). When viewed independently of each other, these results suggest that investors are willing to invest in REIT debt when REITs increase their financial transparency (as captured by higher audit fees or hiring industry-audit specialists or hiring auditors with higher reputations).
Table 7. Results of OLS Regression testing the expectation of a positive association between audit-related attributes and debt investment in REITs
Variable
Model 2a Model 2b Model 2c Model 2d
Coefficient Coefficient Coefficient Coefficient
[t-Statistic] [t-Statistic] [t-Statistic] [t-Statistic]
Log(Audit Fees) 0.697*** 0.679***
[10.701] [9.740]
Specialist 0.368*** 0.218***
[5.412] [3.344]
Big 4 Auditor 0.454*** -0.104
[3.860] [-0.929]
Bid-Ask Spread -45.816*** -69.949*** -63.406*** -47.313***
[-6.644] [-9.230] [-8.171] [-6.795]
Log(Intan. Assets) 0.028 0.074*** 0.072*** 0.029
[1.263] [3.253] [3.186] [1.327]
Book-To-Market 0.071*** 0.064*** 0.061*** 0.073***
[4.487] [4.513] [4.294] [4.550]
Return On Assets 0.741 0.321 0.454 0.690
[1.529] [0.629] [0.900] [1.405]
Leverage 3.946*** 4.362*** 4.317*** 3.952***
[13.367] [13.911] [13.628] [13.382]
Initial Auditor Year 0.080 0.035 0.070 0.076
[1.077] [0.433] [0.845] [1.000]
Log(Other Fees) 0.002 0.032*** 0.035*** 0.000
[0.246] [3.547] [3.765] [0.037]
Log(Properties) 0.251*** 0.267*** 0.290*** 0.237***
Log(Subsidiaries) 0.064** 0.195*** 0.168*** 0.080**
[2.011] [5.677] [4.866] [2.464]
Foreign Operations -0.310 0.183 0.271 -0.345
[-1.219] [0.608] [1.018] [-1.263]
Extra/Disc Items 0.178** 0.293*** 0.261*** 0.194***
[2.457] [3.835] [3.370] [2.692]
Constant -4.079*** 3.477*** 3.209*** -3.884***
[-4.728] [9.261] [8.132] [-4.427]
# Observations 953 953 953 953
F 79.981 60.441 61.604 79.313
Adjusted R2 0.713 0.670 0.665 0.715
Notes: In all models, the dependent variable is Log(Debt Investment), with the model variation being the respective inclusion or exclusion of Log(Audit Fees), Specialist, and Big 4
Auditor. Bid-Ask Spread is an often-used measure to capture transparency. Log(Intan. Assets)
captures firm's level of information asymmetry or opacity.Book-To-Market, Return On Assets,
and Leverage capture individual REIT firm characteristics. Initial and Log(Other Fees)
capture individual REIT-auditor relationships. Log(Properties), Log(Subsidiaries), Foreign,
and Extra/Disc Items capture firm complexity. REIT Type and Year Dummies not reported.
Regression estimations are robust and statistical significance shown as: * p < 0.05, ** p < 0.01, *** p < 0.001, respectively.
Table 8. Results of OLS Regression testing the expectation of a positive association between audit-related attributes and combined equity and debt investment in REITs
Variable
Model 3a Model 3b Model 3c Model 3d
Coefficient Coefficient Coefficient Coefficient
[t-Statistic] [t-Statistic] [t-Statistic] [t-Statistic]
Log(Audit Fees) 0.693*** 0.668***
[10.499] [9.447]
Specialist 0.384*** 0.234***
[5.613] [3.541]
Big 4 Auditor 0.497*** -0.057
[4.228] [-0.501]
Bid-Ask Spread -48.196*** -72.102*** -64.863*** -49.043***
[-6.971] [-9.466] [-8.317] [-7.003]
Log(Intan. Assets) 0.032 0.078*** 0.076*** 0.034
[1.457] [3.430] [3.361] [1.540]
Book-To-Market 0.062*** 0.056*** 0.053*** 0.064***
[4.249] [4.175] [3.935] [4.322]
Return On Assets 0.484 0.065 0.209 0.438
[0.959] [0.121] [0.404] [0.846]
Leverage 3.468*** 3.879*** 3.828*** 3.468***
[11.731] [12.393] [12.124] [11.722]
Initial Auditor Year 0.079 0.035 0.075 0.081
[1.057] [0.436] [0.893] [1.051]
Log(Other Fees) 0.008 0.038*** 0.041*** 0.006
[0.883] [4.091] [4.268] [0.699]
Log(Properties) 0.244*** 0.258*** 0.282*** 0.228***
[5.404] [5.449] [5.986] [5.0370]
Log(Subsidiaries) 0.074** 0.205*** 0.177*** 0.091***
[2.305] [5.954] [5.099] [2.781]
[-1.561] [0.331] [0.734] [-1.565]
Extra/Disc Items 0.138* 0.253*** 0.218*** 0.154**
[1.885] [3.291] [2.812] [2.117]
Constant -3.670*** 3.834*** 3.533*** -3.443***
[-4.203] [10.082] [8.875] [-3.876]
# Observations 953 953 953 953
F 75.038 57.086 58.786 74.847
Adjusted R2 0.700 0.657 0.652 0.702
Notes: In all models, the dependent variable is Log(Equity & Debt Investment), with the model variation being the respective inclusion or exclusion of Log(Audit Fees), Specialist,
and Big 4 Auditor. Bid-Ask Spread is an often-used measure to capture transparency.
Log(Intan.Assets) captures firm's level of information asymmetry or opacity.Book-To-Market,
Return On Assets, and Leverage capture individual REIT firm characteristics. Initial and
Log(Other Fees) capture individual REIT-auditor relationships. Log(Properties),
Log(Subsidiaries), Foreign, and Extra/Disc Items capture firm complexity. REIT Type and
Year Dummies not reported. Regression estimations are robust and statistical significance shown as: * p < 0.05, ** p < 0.01, *** p < 0.001, respectively.
4.2.2 Hypothesis 2 Results
Table 9 below shows the results for testing Hypothesis 2(a) that the financial crisis positively influenced the relationship between the audit process and equity investment in REITs. As stated earlier, the financial crisis caused major disruptions in the capital markets, resulting in capital flight, and conditions of severe illiquidity. Therefore, we expect to find that there was less equity investment for all REITs post crisis. Thus, an important question is how REITs differentiate themselves from others seeking capital under such restricted market conditions. Across all models, there is no statistical significance for Crisis. This result provides no support for our expectation that equity capital investment is lower for all REITs after the financial crisis due to financial market decline. Additionally, there is no statistical significance for the interaction terms Crisis*Audit Fees, Crisis*Specialist, and Crisis*Big 4
Auditor. Accordingly, we are unable to interpret the main effects of the individual
Table 9. Results of OLS Regression testing the expectation that the financial crisis of 2007-2008 positively influenced the relationship between audit-related attributes and equity investment in REITs
Variable
Model 4a Model 4b Model 4c Model 4d
Coefficient Coefficient Coefficient Coefficient
[t-Statistic] [t-Statistic] [t-Statistic] [t-Statistic]
Crisis -1.045 0.172 0.198 -1.153
[-0.502] [0.559] [0.451] [-0.471]
Crisis*Log(Audit Fees) 0.067 0.069
[0.424] [0.331]
Log(Audit Fees) 0.403*** 0.394***
[3.432] [3.062]
Crisis*Specialist -0.025 -0.015
[-0.086] [-0.050]
Specialist 0.368** 0.282
[2.0136] [1.525]
Crisis*Big 4 Auditor 0.001 0.049
[0.003] [0.095]
Big 4 Auditor 0.154 -0.264
[0.519] [-0.795]
Bid-Ask Spread -70.079*** -85.004*** -83.845*** -73.322***
[-5.760] [-7.523] [-6.582] [-5.750]
Log(Intan. Assets) 0.082* 0.111** 0.110** 0.083*
[1.868] [2.521] [2.512] [1.876]
Book-To-Market 0.066*** 0.061*** 0.058*** 0.068***
[3.334] [3.265] [3.177] [3.395]
Return On Assets -0.533 -0.757 -0.697 -0.613
[-0.507] [-0.710] [-0.668] [-0.569]
Leverage -0.341 -0.098 -0.084 -0.325
[-0.776] [-0.225] [-0.190] [-0.734]
[0.307] [0.205] [0.214] [0.204]
Log(Other Fees) 0.050** 0.066*** 0.071*** 0.047*
[1.993] [2.783] [2.935] [1.904]
Log(Properties) 0.208*** 0.207*** 0.233*** 0.190***
[4.014] [3.885] [4.417] [3.625]
Log(Subsidiaries) 0.105* 0.192*** 0.171*** 0.124**
[1.753] [3.441] [3.024] [2.080]
Foreign Operations -0.708 -0.437 -0.355 -0.764
[-1.333] [-0.798] [-0.666] [-1.398]
Extra/Disc Items -0.011 0.064 0.043 0.011
[-0.076] [0.456] [0.301] [0.081]
Constant -1.803 2.472*** 2.485*** -1.574
[-1.300] [4.784] [4.261] [-1.113]
# Observations 953 953 953 953
F 17.221 15.887 16.217 15.737
Adjusted R2 0.261 0.254 0.250 0.261
Notes: In all models, the dependent variable is Log(Equity Investment). In Model 4a, Crisis
and Crisis*Log(Audit Fees) are added to examine the impact of audit fees on post-crisis
equity investment. In Model 4b, Crisis and Crisis*Specialist are added to examine the impact of auditor specialization on post-crisis equity investment. In Model 4c, Crisis and Crisis*Big
4 Auditor are added to examine the impact of auditor reputation on post-crisis equity
investment. In Model 4d, Crisis and all three interaction terms are included to examine the impact of the audit-related attributes of auditor quality, specialization, and reputation on post-crisis equity investment. Bid-Ask Spread is an often-used measure to capture transparency. Log(Intan. Assets) captures firm's level of information asymmetry or opacity.Book-To-Market, Return on Assets, and Leverage capture individual REIT firm characteristics.Initial and Log(Other Fees) are used to capture individual REIT-auditor relationships. Log(Properties), Log(Subsidiaries), Foreign, and Extra/Disc Items capture firm complexity. REIT Type and Year Dummies not reported. Regression estimations are robust and statistical significance shown as: * p < 0.05, ** p < 0.01, *** p < 0.001, respectively.
capital after the crisis than before it, auditor reputation was of less importance. There is no statistical significance for the interactive terms for Crisis*Specialist and Crisis*Big4 Auditor.
Table 10. Results of OLS Regression testing the expectation that the financial crisis of 2007-2008 positively influenced the relationship between audit-related attributes and debt investment in REITs
Variable
Model 5a Model 5b Model 5c Model 5d
Coefficient Coefficient Coefficient Coefficient
[t-Statistic] [t-Statistic] [t-Statistic] [t-Statistic]
Crisis 0.084 -0.086 0.552** -0.109
[0.070] [-0.489] [2.200] [-0.079]
Crisis*Audit Fees -0.052 -0.018
[-0.581] [-0.162]
Log(Audit Fees) 0.711*** 0.679***
[10.767] [9.302]
Crisis*Specialist 0.099 0.197
[0.712] [1.469]
Specialist 0.327*** 0.140*
[3.851] [1.748]
Crisis*Big 4 Auditor -0.544*** -0.341
[-2.880] [-1.480]
Big 4 Auditor 0.745*** 0.077
[4.945] [0.496]
Bid-Ask Spread -46.561*** -69.823*** -64.600*** -48.270***
[-6.944] [-9.182] [-8.667] [-7.190]
Log(Intan. Assets) 0.028 0.072*** 0.074*** 0.028
[1.280] [3.214] [3.227] [1.266]
Book-To-Market 0.070*** 0.065*** 0.059*** 0.074***
[4.353] [4.613] [4.335] [4.585]
Return On Assets 0.769 0.304 0.461 0.666
[1.584] [0.597] [0.914] [1.358]
[13.562] [14.014] [13.672] [13.693]
Initial Auditor Year 0.083 0.036 0.086 0.088
[1.121] [0.444] [1.031] [1.158]
Log(Other Fees) 0.002 0.032*** 0.035*** 0.001
[0.263] [3.562] [3.731] [0.0570]
Log(Properties) 0.252*** 0.267*** 0.289*** 0.238***
[5.600] [5.669] [6.214] [5.273]
Log(Subsidiaries) 0.065** 0.194*** 0.169*** 0.081**
[2.067] [5.660] [4.894] [2.537]
Foreign Operations -0.307 0.184 0.244 -0.354
[-1.204] [0.612] [0.908] [-1.290]
Extra/Disc Items 0.177** 0.292*** 0.257*** 0.191***
[2.450] [3.828] [3.333] [2.667]
Constant -4.253*** 3.484*** 2.922*** -4.056***
[-5.014] [9.249] [7.077] [-4.773]
# Observations 953 953 953 953
F 78.253 58.569 65.637 78.513
Adjusted R2 0.713 0.670 0.666 0.716
Notes: In all models, the dependent variable is Log(Debt Investment). In Model 5a, Crisis and
Crisis*Log(Audit Fees) are added to examine the impact of audit fees on post-crisis equity
investment. In Model 5b, Crisis and Crisis*Specialist are added to examine the impact of auditor specialization on post-crisis equity investment. In Model 5c, Crisis and Crisis*Big 4
Auditor are added to examine the impact of auditor reputation on post-crisis equity
investment. In Model 5d, Crisis and all three interaction terms are included to examine the impact of the audit-related attributes of auditor quality, specialization, and reputation on post-crisis equity investment. Bid-Ask Spread is an often-used measure to capture transparency. Log(Intan. Assets) captures firm's level of information asymmetry or opacity.Book-To-Market, Return on Assets, and Leverage capture individual REIT firm characteristics.Initial and Log(Other Fees) are used to capture individual REIT-auditor relationships. Log(Properties), Log(Subsidiaries), Foreign, and Extra/Disc Items capture firm complexity. REIT Type and Year Dummies not reported. Regression estimations are robust and statistical significance shown as: * p < 0.05, ** p < 0.01, *** p < 0.001, respectively.
significant coefficient for Crisis (β = 0.552) in Model 6c, suggesting that REITs relied more heavily on combined equity and debt capital after the crisis than before it. Again, similar to Model 5, the Crisis*Big 4 Auditor interaction term coefficient is negative and significant in Model 6c (β = -0.528). These findings point to a heavier reliance upon combined equity and debt capital after the crisis than before it, yet at the same time, auditor reputation was of less importance. Neither of the interactive terms Crisis*Specialist and Crisis*Big4 Auditor produced significant results.
Table 11. Results of OLS Regression testing the expectation that the financial crisis of 2007-2008 positively influenced the relationship between audit-related attributes and combined equity and debt investment in REITs
Variable
Model 6a Model 6b Model 6c Model 6d
Coefficient Coefficient Coefficient Coefficient
[t-Statistic] [t-Statistic] [t-Statistic] [t-Statistic]
Crisis -0.129 -0.074 0.552** -0.287
[-0.107] [-0.420] [2.216] [-0.207]
Crisis*Log(Audit Fees) -0.035 -0.002
[-0.392] [-0.018]
Log(Audit Fees) 0.702*** 0.663***
[10.460] [8.940]
Crisis*Specialist 0.077 0.168
[0.557] [1.248]
Specialist 0.353*** 0.167**
[4.109] [2.059]
Crisis*Big 4 Auditor -0.528*** -0.343
[-2.822] [-1.477]
Big 4 Auditor 0.778*** 0.122
[5.125] [0.762]
Bid-Ask Spread -48.698*** -72.003*** -66.020*** -49.864***
[-7.210] [-9.422] [-8.781] [-7.356]
Log(Intan. Assets) 0.032 0.077*** 0.077*** 0.033
[1.465] [3.401] [3.402] [1.489]
[4.1009] [4.297] [3.925] [4.369]
Return On Assets 0.503 0.051 0.216 0.410
[0.996] [0.096] [0.417] [0.793]
Leverage 3.474*** 3.884*** 3.843*** 3.492***
[11.886] [12.472] [12.171] [11.974]
Initial Auditor Year 0.081 0.036 0.090 0.091
[1.087] [0.444] [1.072] [1.186]
Log(Other Fees) 0.009 0.038*** 0.041*** 0.007
[0.892] [4.103] [4.235] [0.713]
Log(Properties) 0.244*** 0.258*** 0.281*** 0.230***
[5.387] [5.437] [6.005] [5.022]
Log(Subsidiaries) 0.075** 0.205*** 0.178*** 0.092***
[2.355] [5.937] [5.125] [2.851]
Foreign Operations -0.386 0.099 0.165 -0.430
[-1.551] [0.335] [0.627] [-1.598]
Extra/Disc Items 0.137* 0.252*** 0.215*** 0.152**
[1.880] [3.285] [2.774] [2.095]
Constant -3.788*** 3.839*** 3.255*** -3.559***
[-4.391] [10.061] [7.829] [-4.116]
# Observations 953 953 953 953
F 73.080 55.324 62.526 73.510
Adjusted R2 0.699 0.656 0.653 0.702
Notes: In all models, the dependent variable is Log(Equity & Debt Investment). In Model 6a,
Crisis and Crisis*Log(Audit Fees) are added to examine the impact of audit fees on
post-crisis equity investment. In Model 6b, Crisis and Crisis*Specialist are added to examine the impact of auditor specialization on post-crisis equity investment. In Model 6c, Crisis and
Crisis*Big 4 Auditor are added to examine the impact of auditor reputation on post-crisis
complexity. REIT Type and Year Dummies not reported. Regression estimations are robust and statistical significance shown as: * p < 0.05, ** p < 0.01, *** p < 0.001, respectively.
Many of the control variables provide interesting results. For example, Bid-Ask Spread, one of the variables used to capture financial transparency, is also negative and significant in all models. Log(Intan Assets), our proxy for information asymmetry/opacity, is largely positive and significant, which suggests that when REIT investors view REITs as more transparent (lower bid-ask spreads), or when they perceive lower levels of information asymmetry (lower levels of intangible assets), they are more inclined to invest in REITs. The number of properties owned by REITs and/or their subsidiaries contributes to their demand for capital investment. To control for this, we use the variable Log(Properties). In all models, the coefficients for Log(Properties) are positive and significant, revealing a positive relationship between the number of properties owned and REIT capital investment. This finding is not altogether surprising. Because REITs have to distribute the bulk of their available cash as dividends, to acquire additional properties, they need new capital. As REITs acquire more properties, and increase needs for additional capital, implementing strategies to lower information asymmetries and increase financial transparency takes on added importance. In a similar fashion, all models show positive and significant coefficients for Log(Subsidiaries), another REIT complexity indicator. Logically, increased subsidiary investment and operation requires increased capital investment.
5. Conclusion
Existing research indicates that firms use the audit process as a means of conveying information to investors, often in attempts to signal their increased financial transparency. In this paper, we examine how REITs use the audit-related attributes of auditor quality, specialization, and reputation to signal or convey financial transparency to potential investors in order to motivate capital investment. We first analyze the relationship between these three audit-related attributes and REIT equity, debt, and combined equity and debt capital investment. We then analyze this relationship by considering the financial crisis to investigate whether the use of these audit-related attributes has a stronger impact on capital issuance after the crisis.
References
American Institute of Certified Public Accountants (AICPA). (1978). The Commission on Auditors’ Responsibilities: Report, Conclusions and Recommendations. The Cohen Commission.New York: AICPA.
Abdolmohammadi, M. J., D. G. Searfoss, & J. Shanteau. (2004). An Investigation of the Attributes of Top Industry Audit Specialists. Behavioral Research in Accounting, 16(1), 1-17. https://doi.org/10.2308/bria.2004.16.1.1
Antle, R., E. Gordon, G. Narayanamoorthy, & L. Zhou. (2006). The Joint Determination of Audit Fees, Non-audit Fees, and Abnormal Accruals. Review of Quantitative Finance and
Accounting, 27(3), 235-266. https://doi.org/10.1007/s11156-006-9430-y
Bagehot, W. (1971). The Only Game in Town.Financial Analysts Journal, 51(1), 12-14. https://doi.org/10.2469/faj.v27.n2.12
Balvers, R. J., B. McDonald, & R. E. Miller. (1988). Underpricing of New Issues and the Choice of Auditor as a Signal of Investment Banker Reputation. The Accounting Review, 63(4), 605-622.
Basse, T., M. Friedrich, & E. V. Bea. (2009). REITs and the Financial Crisis: Empirical Evidence from the U.S. International Journal of Business and Management, 4(11), 1-10. https://doi.org/10.5539/ijbm.v4n11p3
Beatty, R. P. (1989).Auditor Reputation and the Pricing of Initial Public Offerings.The
Accounting Review, 64(4), 693–709.
Bell, T., F. Marrs, I. Solomon, and H. Thomas. (1997). Auditing Organizations through a
Strategic Lens, the KPMG Business Measurement Process. Montvale, NJ: Peat Marwick LLP.
Boo, E., & D. Sharma. (2008). Effect of Regulatory Oversight on the Association between Internal Governance Characteristics and Audit Fees.Accounting and Finance, 48(1), 51-71. https://doi.org/10.1111/j.1467-629X.2007.00229.x
Bushman, R. M., & A. J. Smith.(2001). Financial Accounting Information and Corporate Governance.Journal of Accounting and Economics, 32(1-3), 237-333.
Bushman R. M., & A. J. Smith. (2003). Transparency, Financial Accounting Information and Corporate Governance.Federal Reserve Bank of New York’s Economic Policy Review, 9(1), 65-87. https://doi.org/10.1016/S0165-4101(01)00027-1
Campbell, J. Y., & R. J. Shiller. (1988). The Dividend-Price Ratio and Expectations of Future Dividends and Discount Factors. Review of Financial Studies, 1(3), 195-228. https://doi.org/10.1093/rfs/1.3.195
Carter, R. B., & S. Manaster.(1990). Initial Public Offerings and Underwriter Reputation.The
Journal of Finance, 45(4), 1045–1067. https://doi.org/10.1111/j.1540-6261.1990.tb02426.x
Companies. Journal of Business. Finance and Accounting, 20(6), 765-786.
Chen, C. R., & T. L. Steiner. (1999). Managerial Ownership and Agency Conflicts: A Nonlinear Simultaneous Equation Analysis of Managerial Ownership, Risk Taking, Debt
Policy, and Dividend Policy. Financial Review, 34(1), 119-136.
https://doi.org/10.1111/j.1540-6288.1999.tb00448.x
Cohen, J., G. Krishnamoorthy, & A. M. Wright.(2002). Corporate Governance and Audit Process.Contemporary Accounting Research, 19(4), 573-594.
Cornett, M. M., A. J. Marcus, & H. Tehranian. (2008). Corporate Governance and Pay-for-Performance: The impact of Earnings Management. Journal of Financial Economics, 87(2), 357-373.
Danielsen, B. R., D. M. Harrison, R. A. Van Ness, & R. S. Warr.(2009). REIT Auditor Fees and Financial Market Transparency. Real Estate Economics, 37(3), 515-557.
Danielsen, B. R., D. M. Harrison, R. A. Van Ness, & R. S. Warr. (2014). Liquidity, Accounting Transparency, and the Cost of Capital: Evidence from Real Estate Investment Trusts. Journal of Real Estate Research, 36(3), 221-251.
Danielsen, B. R., R. A. Van Ness, and R. S. Warr.(2007). Auditor Fees, Market Microstructure, and Firm Transparency.Journal of Business Finance & Accounting, 34(1-2), 202-221.
Datar, S., G. Feltham, & J. Hughes. (1991). The Role of Audits and Audit Quality in Valuing New Issues. Journal of Accounting and Economics, 14(1), 3-49.
DeAngelo, L. E. (1981). Auditor Size and Quality. Journal of Accounting and Economics, 3(3), 183-199.
Deeds, D. L., D. Decarolis, & J. E. Coombs. (1997). The Impact of Firm-Specific Capabilities on the Amount of Capital Raised in an Initial Public Offering: Evidence from the Biotechnology Industry. Journal of Business Venturing, 12(1), 31–46.
DeLisle, J. R. (2007). At the Crossroads of Expansion and Recession. The Appraisal Journal, 75(4), 314-322.
DeLisle, J. R. (2008). The Perfect Storm Rippling Over to Real Estate. The Appraisal Journal, 76(3), 200-210.
Demsetz, H. (1968). The Cost of Transacting. Quarterly Journal of Economics, 82(1), 33-53.
Diamond, D. W., & R. E. Verrecchia. (1991). Disclosure, Liquidity, and the Cost of Capital.
The Journal of Finance, 46(4), 1325-1359.
Fama, E. F., & M. C. Jensen.(1983). Separation of Ownership and Control. Journal of Law
and Economics, 26(June), 301-325.
Firth, M., & A. Smith. (1992). Selection of Auditor Firms by Companies in the New Issue Market. Applied Economics, 24(2), 247-255.
Francis, J., T. Lys, & L. Vincent, L. (2004). Valuation Effects of Debt and Equity Offerings by Real estate Investment Trusts. (Working Paper). Duke University and Northwestern
University. Retrieved on April 23, 2012, from
http://www.kellogg.northwestern.edu/faculty/vincentl/htm/offerings.pdf.
Friday, S. W., & S. G. Sirmans. (1998). Board of Director Monitoring and Firm Value in REITs. Journal of Real Estate Research, 16(3), 411-428.
Geiger, M. A., & K. Raghunandan. (2002). Auditor Tenure and Audit Reporting Failures.
AUDITING: A Journal of Practice and Theory, 21(1), 67-78.
Goebel, P. R., & K. S. Kim. (1989). Performance Evaluation of Finite-Life Real Estate Investment Trusts. Journal of Real Estate Research, 4(2), 57-69.
Goodman, G. A. (2000). German Investment in U.S. Real Estate: The Acceleration Continues.
Real Estate Review, 30(1), 1-20.
Goodman, G. A. (2003). Homeownership and Investment in Real Estate Stocks. Journal of
Real Estate Portfolio Management, 9(2): 93-105.
Hair, J. F., Jr., W. C. Black, B. J. Babin, & R. E. Anderson. (2002). Multivariate Data
Analysis (7th Ed). Upper Saddle River, NJ: Prentice-Hall.
Hardin, W. G., & Z. Wu. (2010). Banking Relationships and REIT Capital Structure.Real
Estate Economics, 38(2), 257-284.
Hay, D., and D. Davis. (2004). The Voluntary Choice of an Audit of Any Level of Quality.
AUDITING: A Journal of Practice & Theory, 23(2), 37-53.
Healy, P. M., & K. G. Palepu. (2001). Information Asymmetry, Corporate Disclosure, and the Capital Markets: A Review of the Empirical Disclosure Literature. Journal of Accounting and
Economics, 31(1-3), 405-440.
Higgs, J. L., and T. R. Skantz.(2006). Audit and Nonaudit Fees and the Market’s Reaction to Earnings Announcements. AUDITING: A Journal of Practice Theory, 25(1), 1-26.
Hope, O. K., W. B. Thomas, & D. Vyas. (2009). Transparency, Ownership, and Financing Constraints in Private Firms.(Working Paper).Canada: University of Toronto.Retrieved on
October 30, 2012, from
http://www2.accountancy.smu.edu.sg/research/seminar/pdf/OleKristianHOPE_paper.pdf.
Johnson, V. E., I. K. Khurana, & J. K. Reynolds. (2002). Audit-Firm Tenure and the Quality of Financial Reports. Contemporary Accounting Research, 19(4), 637-660.
Karamanou, I., & N. Vafeas. (2005). The Association Between Corporate Boards, Audit Committees, and Management Earnings Forecasts: An Empirical Analysis. Journal of
Knechel, W. R., & D. S. Sharma. (2012). Auditor-provided nonaudit services and audit effectiveness and efficiency: Evidence from pre-and post-SOX audit report logs. AUDITING:
A Journal of Practice & Theory, 31(4), 85-114.
Mansi, S. A., W. F. Maxwell, & D. P. Miller. (2004). Does auditor quality and tenure matter to investors? Evidence from the bond market. Journal of Accounting Research, 42(4), 755-793.
Myers, S. C. (1984). The capital structure puzzle. The Journal of Finance, 39(3), 574-592.
Myers, J. N., L. A. Myers, & T. C. Omer. (2003). Exploring the term of the auditor-client relationship and the quality of earnings, a case for mandatory auditor rotation. The
Accounting Review, 78(3), 779-799.
Naiker, V., D. S. Sharma, & V. D. Sharma. (2013). Do former audit firm partners on audit committees procure greater nonaudit services from the auditor? The Accounting Review, 88(1), 297-326.
National Association of Real Estate Investment Trusts. (2012). Retrieved on May 4, 2012, from: http:www/reit.com.
Peel, M. J., & R. Roberts. (2003). Audit fee determinants and auditor premiums: Evidence from the micro-firm sub-market. Accounting and Business Research, 33(3), 207-233.
Ritter, J. R. (1984). Signaling and the valuation of unseasoned new issues: A comment. The
Journal of Finance, 39(4), 1231-1237.
Scherrer, P. S. (2004). Financing and investing considerations for REITs. Corporate
Governance, 4(4), 78-82.
Simunic, D., & M. Stein. (1987). Production differentiation in auditing: A study of auditor choice in the market for new issues. (Canadian Certified General Accountant’s Research
Foundation, Research Report).Retrieved on May 8, 2012, from
http://scholar.google.com/scholar?cites=6579729753907499239&as_sdt=205&sciodt=0,1&hl =en.
Solomon, I., M. Shields, & R. Whittington. (1999). What do industry-specialist auditors know? Journal of Accounting Research, 37(1), 191-208.
Spence, M. (1973). Job market signaling.Quarterly Journal of Economics, 87(3), 355-374.
Titman, S., & B. Trueman. (1986). Information quality and the valuation of new issues.
Journal of Accounting and Economics, 8(2), 159–172.
Watts, R. L., & J. L. Zimmerman. (1983). Agency problems, auditing, and the theory of the firm: Some evidence. Journal of Law and Economics, 26(3), 613-633.
Notes
9.83%, respectively. Data obtained from NAREIT, available at www.reit.com.
Note 2. The average annual returns of the FTSE-NAREIT All-REIT Index in the years 2009, 2010, and 2011, were 27.45%, 27.58%, and 7.28%, respectively. The average annual returns of the S&P 500 Index in the years 2009, 2010, and 2011, were 23.45%, 12.78%, and 0.01%, respectively. The average annual returns of the Dow Jones Industrial Average in the years 2009, 2010, and 2011, were 18.82%, 11.02%, and 5.53%, respectively. The average annual historical returns of the NASDAQ Composite Index in the years 2009, 2010, and 2011, were 43.89%, 16.91%, and -1.80%, respectively. Data obtained from NAREIT, available at www.reit.com.
Note 3. REITs must annually elect REIT status, and disclose their election in their annual proxy statement. Data available at http://www.sec.gov.
Note 4. Data available at http://www.sec.gov.
Note 5. Data obtained by licensed access to the University of Pennsylvania’s Wharton Research Data Services, available at http://wrds-web.wharton.upenn.edu/wrds/index.cfm.
Note 6. Audit fee information comes from the Audit Analytics database.
Note 7. So as not to lose zero value observations when log transforming variables, researchers commonly compute the natural log of the sum of the variable and one (for examples, see Campbell & Shiller, 1988; Chen & Steiner, 1999; Cornett, Marcus, & Tehranian, 2008; Ritter, 1984). Throughout this paper, we follow this approach when log transforming variables.
Note 8. For the purposes of this research, auditor specialization includes auditors that performed 30% or more of all REIT audits in the sample. Table 4 groups all REIT audits by audit firm, total audit fees, and average audit fees. Of the 980 total REIT audits performed in the sample, Ernst & Young, LLP performed 327, or 33.37%. All other auditors each performed less than 18% of the total number of REIT audits in the sample. Auditor rank order is by percentage of REIT audits performed.
Note 9. The group of audit firms currently known as the “Big 4” includes Price Waterhouse Coopers, LLP, Deloitte & Touche, LLP, Ernst & Young, LLP and KPMG, LLP ranked 1 through 4 based on annual revenues, respectively (www.Big4.com, 2012).
Note 10. Ibid, Footnote 7.
Note 11. Ibid, Footnote 7.
Note 12. Ibid, Footnote 7. Note 13. Ibid, Footnote 7.
Copyright Disclaimer
Copyright for this article is retained by the author(s), with first publication rights granted to the journal.