Factors in Faculty Performance Analysis
Suman Bhatnagar
1, Prashant Sahai Saxena
21
(School of Computer and Systems Sciences, Jaipur National University, Jaipur)) 2
(School of Computer and Systems Sciences, Jaipur National University, Jaipur))
---
************************
---Abstract:
In this research paper, chi-square test is applied for analysis of performance feedback of faculty members received from the students of BCA and MCA Programmes of an institute of higher education. Two parameters namely ‘Pass and Fail’ and ‘Good Grades’ are being introduced for determining the most relevant factor of a faculty member’s academic delivery throughout the semester.
Keywords —Performance, Feedback of Faculty, Subject Command, Pass_Fail, Good_Grades,
EDA,Chi-Square.
---
************************
---I.Introduction
For any educational institute faculty performance is the major factor that directly affects the student’s performance. One can define performance as an outcome the faculty has produced over a specific period of time. It also refers to the amount of efforts, standards and commitments maintained by the faculty while performing its job. In order to maintain the minimum required standards of higher education, almost all educational institutions face the challenge of evaluating faculty performance. There has been ongoing debate for decades as to what should be the criteria and parameters of evaluation required for measuring the performance of faculty in higher education institutions.
II.Review of Literature
Kourosh Azizi et al. (2014) conducted a study in which faculty members were evaluated by the students. In this study, 23 faculty members filled out the self-assessment forms in the subjects taught by them which were then evaluated by 23 students. Data were analyzed using the SPSS statistical 14. Paired t-test was used to compare the students’ evaluation of the faculty members’ performance and the professors’ self-assessment. The outcome of this study performed shows
that teaching performance perceptions of the faculty were similar to those of the graduate students as compared to the undergraduate ones [1].
Hatfield CL. et al. (2013) performed research to determine if there exists a relationship between student’s grades, gender, age, or ethnicity and their completion of course and/or faculty evaluations. Data for 4 courses were pooled and analyzed in SAS Statistical Software. Data were analyzed in 3 groups; both evaluations completed, only course evaluations completed, and only faculty evaluations completed. The group, who did not complete any evaluations served as the control group, to which all other groups were compared. Logistic Regression model was used to analyse the data. Lack of correlation between course and faculty evaluation completion rates and course grades was an interesting finding of this research. Significant differences in completion rates were also found based on the course taken and the gender and ethnicity of the students [2]. Aslam MN. et al. (2013) determine the effectiveness of students rating as a teacher evaluation tool. He used concurrent mixed method strategy as a design based on realistic and practical knowledge claims. To conduct this research both qualitative
and quantitative data were collected simultaneously by conducting a structured in depth interview and floating a questionnaire to seek teachers' feedback. Data was analyzed using SPSS. It was found from the results obtained that student rating is an effective means of evaluating teaching. These results cannot be generalized but provide guidelines for implementing similar practices colleges [3].
Chandrani Singh et al. (2011) conducted a study using statistical tools and analyzed trends in the feedback collected from the students to differentiate between signed or unsigned faculty feedbacks. Regression Technique was used for this purpose. The important conclusion from the study was that the approach taken for taking feedback is an important component which has to be taken seriously into consideration while assessing the faculty’s performance based on students input because the behavioural pattern of the students had a marked influence on the assessment of the faculty [4].
Thuy-Van T.Duonge et al. (2015) used backward linear regression method and SPSS software to analyse the impact of each factor on the overall rating in the university. The factors are divided into five groups: course content, teaching method, study guide, the responsibility of the instructor and the behaviours of the instructor. The results obtained shows that the factor “friendly to students” and the group “behaviours” have the most important impact on the overall rating [5].
From the above discussion it can be concluded that evaluation of faculty by students is important for ongoing educational program improvement and to maintain endorsement of the subjects taught. In addition, a major portion of career advancement and faculty compensation is directly related to learners’ evaluations of their effectiveness in teaching. [6].
Faculty performance evaluation may be considered for providing increments and additional benefits also and have recently attracted considerable attention and support among researchers and stakeholders in higher education.
Performance evaluation of a faculty is a difficult task, but still it is made for years through pedagogical surveys. Evaluating the performance of a faculty is necessary due to many reasons for betterment of its stakeholders –
• Monitoring of the students
• Improvement of the student’s performance
• Increase motivation to further improve performance
• Increase self respect and ambition The most usual kind of pedagogical survey is just a set of closed-ended questions, with multiple choices that follow some order [7].
III.Objectives
The Objectives of this research paper are:
A. To find out the important factors that affect the performance of a faculty.
Fig.1 Identifying Important Factors for Faculty Performance Evaluation
IV .Methodology
A. Data Preparation
The authors have taken two factors for evaluating the performance of a faculty viz:
1) Student feedback of each subject taught by the faculty
2) Result of the previous semester
For conducting research, a database consisting of 108 (Subjects) X 41(Parameters) is taken into account for analysis. We have considered data of two consecutive sessions which contains feedback of students of MCA and BCA. It is investigated whether there is any correlation between the student’s promotion to next higher class and teacher’s performance. In all instances the faculty evaluations were collected before the end of the semester examinations and at that time students did not know their final grade. During the data pre-processing phase, student data from the two databases is extracted and organized in a new flat file. Two target variables are created in this case ‘Pass and Fail” and “Good Grades”. There are total 1,320 observations were taken into account from two consecutive sessions. A format of Feedback Form for faculty evaluation by students used in this research is given below in the Table 1.
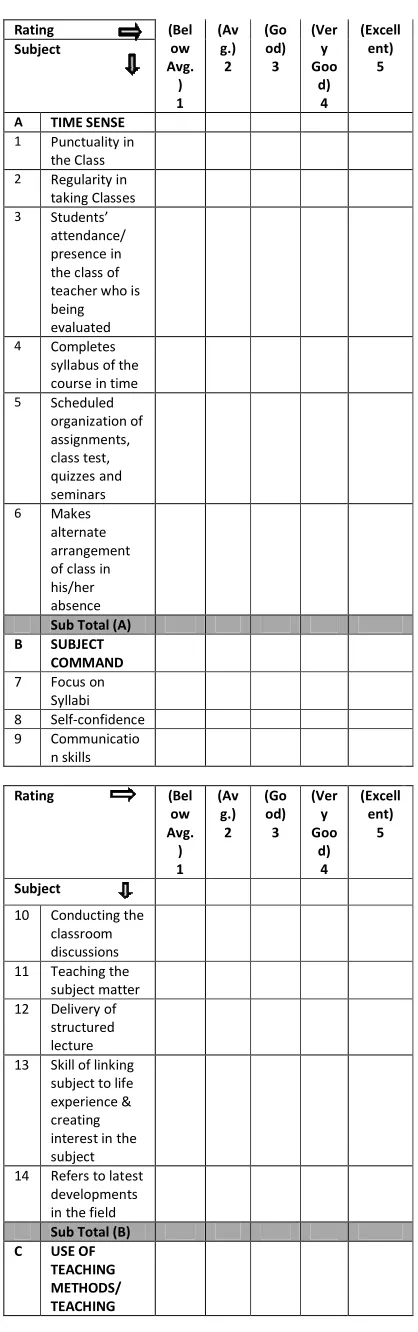
TABLE 1
QUESTIONNAIRES (FEEDBACK FORM) FOR FACULTYPERFORMANCE EVALUATION BY STUDENTS
FEEDBACK FORM FOR TEACHER EVALUATION BY STUDENTS Note: This questionnaire has been designed to seek a feedback from the student to strengthen the quality of teaching-learning environment and to look for opportunities to improve teacher’s performance in classroom engagement with students to bring excellence in teaching and learning.
---
Name of the Department/Institute Computer ScienceClass: Session: Semester : Name of teacher:
Subject taught & Course No:
Total number of lectures delivered by teacher in the session/semester:
Number of classes attended by the student filling the form with percentage :
---
IN THE FOLLWING TABLE TICK ( ) THE APPROPRIATE CHOICE FOR EACH POINT.
Rating (Bel
ow Avg. ) 1 (Av g.) 2 (Go od) 3 (Ver y Goo d) 4 (Excell ent) 5 Subject
A TIME SENSE
1 Punctuality in the Class
2 Regularity in taking Classes
3 Students’ attendance/ presencein the class of teacher who is being evaluated
4 Completes syllabus of the coursein time
5 Scheduled organization of assignments, class test, quizzesand seminars
6 Makes alternate arrangement ofclass in his/her absence
Sub Total (A)
B SUBJECT
COMMAND
7 Focus on Syllabi
8 Self-confidence
9 Communicatio n skills
Rating (Bel
ow Avg. ) 1 (Av g.) 2 (Go od) 3 (Ver y Goo d) 4 (Excell ent) 5 Subject
10 Conducting the classroom discussions
11 Teaching the subject matter
12 Delivery of structured lecture
13 Skill of linking subject to life experience & creating interest inthe subject
14 Refers to latest developments inthe field
Sub Total (B)
C USE OF
TEACHING METHODS/ TEACHING
AIDS
15 Uses of teaching aids (OHP/Blackboa rd /PPT's)
16 Blackboard/W hiteboard work interms of legibility, visibility and structure
17 Uses of innovative teaching methods 18 Shares the answers of class testsor sessional test questions after the conduct of the class tests/sessional tests.
19 Shows the evaluated answerbooks of class tests to thestudents
20 Makes sure that he/she is being understood
Sub Total (C)
D HELPING
ATTITUDE
21 Helping approach towards varied academic interests of students 22 Helps student in providing studymaterial which is not readily available in the text books say through resources, e-journals, reference books, open coursewares etc.
23 Helps students irrespective of ethnicity and culture/backgro und
24 Helps students irrespective of gender
25 Helps students facing physical, emotional and learning challenges
26 Approach
towards developing professional skills among students 27 Helps students
in realizing careergoals
28 Helps students in realizing their strengths and developmental needs
Sub Total (D)
E LABORATORY
INTERACTION
29 Regular checking of laboratory log books/ note books
30 Availability of teacher in the laboratory for whole duration oflaboratory hours 31 Helping the students in conducting experiments throughset of instructions or demonstrations
32 Helps students in exploring the area of study involved in the experiment
33 Follows open ended approach for conducting the experiments
34 Takes interests in conduct of Laboratory seminars, group discussions etc.
Sub Total (e)
F CLASS
CONTROL
35 Control mechanism in effectively conducting the class
36 Students’ participation in theclass
37 Skills of addressing inappropriate behaviour of student
38 Tendency of inviting opinion andquestion on subject matter from
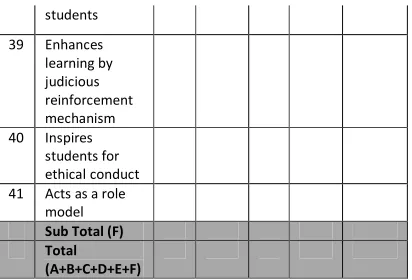
students 39 Enhances
learning by judicious reinforcement mechanism
40 Inspires students for ethicalconduct
41 Acts as a role model
Sub Total (F)
Total
(A+B+C+D+E+F)
This feedback data is then compared with the semester results obtained by the students. This study is divided into two parts. In the first part, relationship between student’s performance in the tests during the semester, and the result (i.e. pass and fail) they obtained at the end of the semester for different courses are analyzed. In the second part, relationship between student’s performance in the tests and the grade they obtained during the semester examination is analyzed.
Predictors, also known as independent variables, are being designated in order to observe the effect on dependent variables or target variables (“Pass and Fail” & “Good_Grades”). All predictors are treated as categorical variables that contain a finite number of categories.
The following table shows the attributes of faculty which are studied for measuring the performance. The data for these fields is obtained from the students in the form of feedback forms.
TABLE 2:ATTRIBUTES OF A FACULTY
Name of the Attribute Comment
Session Session (Year)
Sem Semester
Course Course
Subject Subject
Fid Faculty Id
Student Student Id
Agg_Time_Sense_RankFactor Rating for Time Punctuality (1:5) Agg_Subject_Command_Rank
Factor
Rating for Subject Command (1:5) Agg_Teaching_Methods_Rank
Factor
Rating for Teaching Methods (1:5) Agg_Helping_Attitude_RankF Rating for Helping
actor Attitude (1:5)
Agg_Laboratory_Intraction_R ankFactor
Rating for Laboratory Interaction (1:5) Agg_Class_Control_RankFact
or
Rating for Class controlling Authority (1:5)
Pass_Fail Target Variable (Pass
/Fail) (1:0)
Good_Grades Target Variable
(Marks >=80 ) (1:0)
We have performed modelling by taking six variables into account (Time Sense / Subject Command / Teaching Methods / Helping Attitude / Laboratory Interaction / Class Control). Two types of evaluation have been performed on the data and subsequently, the data in accordance with the purpose of the special analysis is selected.
The feedbacks of students are obtained in a set of questionnaires. The Questionnaire consists of six major factors and 35 sub factors. The outcome of all the subfields marked by students in the scale of {1:5} is summed in order to calculate the score of major fields. The description of the major factors is given below:
1. Time Sense (TS): It means Punctuality and regularity of the faculty in the Class; faculty should complete his/her syllabus on time.
Continuous assessment of
assignments, class test and seminars etc.
2. Subject Command (SC): This corresponds to the communication skills, self confidence in lecture delivery, giving real life examples while explaining topic, referring to latest trends and techniques in that area, etc.
is also a part of popular teaching methods.
4. Helping Attitude (HA): It includes helping attitude of faculty towards students irrespective of their social and economical background. Helping students in their studies and also assist them in facing emotional and learning challenges.
5. Laboratory Interaction (LI): Laboratory interaction includes open ended approach in conduct of experiments, conduct of seminars, group discussions etc.
6. Class Control (CC): This includes proper class control during lecture delivery, inviting opinion and question on subject matter from students, skills of addressing inappropriate behaviour of student, etc.
Data for consecutive two sessions are collected where each faculty assigns a numeric rating based on several factors asked in the survey (Time Sense / Subject Command / Teaching Methods / Helping Attitude / Laboratory Interaction / Class Control). Based on the result of a student, a categorical target variable is constructed. It has five distinct values in the scale of {1:5} (categories), as per the below:
1= Below Average 2= Average 3= Good 4= Very Good 5= Excellent
The student responses of 40 questions were summed (i.e. subtotal TS +SC+TMA+ HA+ LI+ CC is done). These responses are stored in the table along with the session, semester, course, subject, faculty_id and student_id.
We founded weighted average based on sub-factors of a factor and marked it as 1....5 by taking a threshold e.g. for factor TIME SENSE all sub-factors are
multiplied with grades (BelowAvg -1...) and a weighted score was found. Based on cut-offs again marked as 1...5. The two target variables “Pass & Fail” and “Good Grades are retrieved from two separate files:
1) Aggregated Survey Data 2) Marks
These two tables are combined based on Student ID, Faculty ID, Course, etc. In the
file named “res”, Figure 3.3 showing the combine table.
In order to find the more accurate result for any existing relationship between the fields or variables of the faculty feedback and the grades obtained by the student two types of study is carried out. Since the data does not contain any missing values therefore, no missing value handling techniques were used.
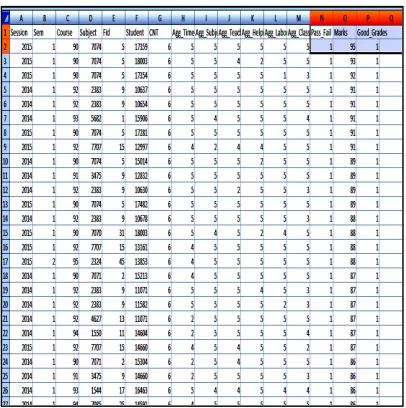
Fig 2 Snapshot of Faculty Feedback, Result and Grade of the Student (res.xls)
B. Exploratory Data Analysis (EDA)
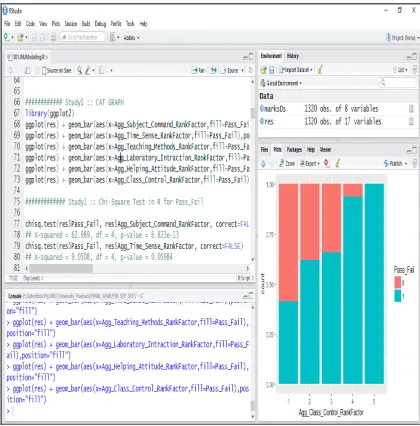
structure of data and its dynamics through which we can maximize the insights. EDA is also critical to extract important variables and detect outliers and anomalies. It is a statistical data analysis that focuses on pattern recognition and hypothesis generation. “Exploratory” and “Confirmatory” data analysis can both be viewed as methods for comparing observed data to what would beobtained under an implicit or explicit statistical model [8]. EDA was named by Tukey 1977. He defined EDA as an attitude about how data analysis should be carried out, instead of a fixed set of techniques [9]. We have performed EDA with the help of Bivariate Analysis where results are depicted in the form of bar graph. To see the trend we did a Bivariate of all numeric variables with respect to Target variable. The graphs essentially shows trend of Target Variable when we increase on variable. Here exactly two measurements are made on each observation.
C. Data Mining Tool: ‘R’
Analysis been carried out with the aid of Data Mining tool ‘R’. Bar graphs (or bar charts) are the best way to display categorical variables. The syntax of a plotting command in ggplot2 is to use ggplot() to define the data frame where variables are defined and to set aesthetics using aes() and then to add to this one or more layers with other commands. Aesthetics are characteristics that each plotted object can have, such as a 5 x-coordinate, a y-x-coordinate, a color, a shape, and so on. The layers we will use are all geometric representations of the data and have function names that have the form geom_XXX() where XXX is the name of the type of plot. File “res” consists of 1320 records and 16 columns. “Pass & Fail” variable is represented by ‘1’ and ‘0’ respectively.
Similarly, in File “res” number of students who have achieved “Good_Grades” ie. scored equal to or greater to 80% are again represented with binary values ‘1’
and ‘0’(‘1’ for >=80% and ‘0’ for less than 80%). Here, from our dataset, it was evident that students scoring “Good_Grades” were 60 in number and those not scoring “Good_Grades” were 1260 in number. Again for better presentation we construct summary table of the data obtained in ‘R’.
D. EDA using ‘R’
The goal is to investigate the most important factor in evaluation of a faculty for better academic results of students given Pass-Fail (Student Passed or Failed). For this model, Chi-Square test is used with six parameters for Target variable Pass_Fail. To better understand the importance of the input variables, it is customary to analyse the impact of input variables on the performance of teacher’s evaluation, in which the impact of input variable of the model on the output variable has been analysed.
In our case we visualize all categorical variables w.r.t. Target Variable Pass_Fail using R’s ggplot2 package. It is a data visualization package for the statistical programming language R. It was created by Leland Wilkinsons. It serves as a replacement for the basic graphics in R and contains a number of defaults for web and print display of common scales.
A very useful feature of the ggplot() function is that it can pass aesthetic roles to all the functions that are “added” to it. However, as our graphs become more complex, it can be a big time-saver to set as many aesthetic roles in the ggplot() function call and let it pass them through to various other functions that we will add on to build a more complex plot.
1) Analysis on the basis of “Pass & fail”
The goal is to investigate the most important factors while assessing a faculty for better academic result of students given variable “Pass & Fail” (Student Passed or Failed).
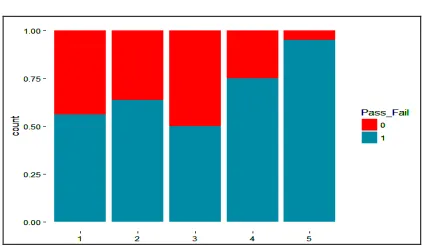
Fig. 4(a) : Agg_Subject_ Command_RankFactor
Fig. 4(b): Agg_Time Sense RankFactor
Fig. 4(c) : Agg_Teaching_ Methods_ RankFactor
Fig. 4 (d) : Agg_Laboratory_ interaction RankFactor
Fig. 4(e) : Agg_Helping_ Attitude_RankFactor
Fig. 4 (f) : Agg_Class_Control _RankFactor
In the figures 3.4.2.1(a, b, c, d, e, f) given above , we have graphed the grading awarded to the faculty by the student on ‘X’ axis whereas a count for number of students passed and failed is taken along ‘Y’ axis. It is evident from the following graphs that:
a) A good subject command implies a good result in the subject.
c) A below average Laboratory interaction implies a poor result in the subject.
d) A Helping Attitude towards students gives a good result in the subject.
e) An average time sense implies an average result in the subject. f) A below average Class Control
implies a poor result in the subject.
Again, we perform the same study on our second target variable Good_Grades and visualize all categorical variables w.r.t. Target Variable Good Grades using R’s ggplot2 package.
2) Analysis on the basis of Good Grades
The goal is to investigate the most important factors while assessing a faculty for better academic result of students given variable Good_Grades (Student Secured 80% or more).
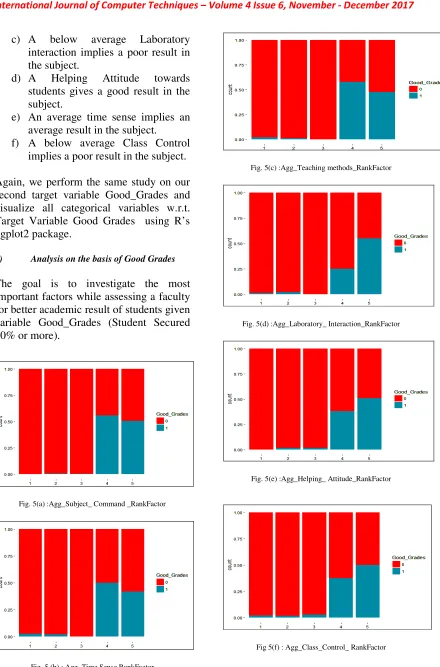
Fig. 5(a) :Agg_Subject_ Command _RankFactor
Fig. 5 (b) : Agg_Time Sense RankFactor
Fig. 5(c) :Agg_Teaching methods_RankFactor
Fig. 5(d) :Agg_Laboratory_ Interaction_RankFactor
Fig. 5(e) :Agg_Helping_ Attitude_RankFactor
In the figures 3.4.2.2(a, b, c, d, e, f) given above , we have graphed the grading awarded to the faculty by the student on ‘X’ axis whereas a count for number of students passed and failed is taken along ‘Y’ axis. It is evident from the following graphs that:
a) A good subject command implies good grades in the subject.
b) A below average teaching a method implies poor grades in the subject.
c) A below average Laboratory interaction implies a poor grades in the subject.
d) A Helping Attitude towards students gives good grades in the subject.
e) An average time sense implies an average grades in the subject. f) A below average Class Control
implies a poor result in the subject. Visualization or Bivariate graphs are used for finding trends in the dataset and increasing or decreasing trends signifies strong relationship between the independent variable (predicators) and dependent variables (target). It seems by performing visual inspection that all variables seem to be relevant. Therefore in order to formalize the findings obtained Chi-Square test is used.
We have a complete data set on the distribution of 1320 records ie. Faculty attributes and category (1:5). A Chi-square test was performed to see how likely it is that Faculty attributes and category (1:5) were completely dependent; or in other words, how likely it is that the distribution is due to chance. To evaluate this again Chi-Square test with six parameters for target variable “pass & Fail” and “Good_Grades” was applied.
E. Chi-Square Test
The chi-square test of independence is one of the most basic and common hypothesis tests in the statistical chi-squared test analysis of categorical data. Given 2 categorical random variables, X and Y, the chi-squared test of independence determines whether or not there exists a statistical dependence between them. The expected value of the two nominal variables can be calculated by:
---(eq 1)
O stands for the Observed frequency. E stands for the Expected frequency.
Expected Cell Value (E) = (row total x column total)/n --- (eq 2)
The result obtained by applying chi-squared test can be categorized in to the following:
1. Null hypothesis: Assumes that there is no association between the two variables.
2. Alternative hypothesis: Assumes that there is an association between the two variables.
Hypothesis Testing: If the value
calculated by Chi-Square test is greater than the value of the table, null hypothesis will be rejected and if it is less than the null hypothesis it will be accepted.
The p-value can be found using by calculating Degrees of Freedom(df)
known as Chi-Square Test of
Independence
df=(numberofrows−1)(numberofcolumns−1)----(eq. 3)
The probability of committing a Type I error is called the significance level, and is often denoted by α.
To determine whether a result is statistically significant, a researcher calculates a p-value, which is the probability of observing an effect given that the null hypothesis is true.[10] The null hypothesis is rejected if the p-value is less than a predetermined level, α. α is called the significance level, and is the probability of rejecting the null hypothesis
given that it is true (a type I error). It is usually set at or below 5% [11].
1) Performing Chi-Square test for faculty attributes with respect to target variable “Pass & Fail”
R chisq.test() function is used to carry out Chi-Square test of independence. We tested all our predictors’ w.r.t. our Target variable ie “Pass & Fail”. Here Degree of Freedom (df) is 4 and critical value taken is 0.1 for more precise results.
Fig. 6 Snapshot of the R performing Chi-Square test with target variable “Pass & Fail”
TABLE 3 PERFORMING CHI-SQUARE TEST FOR FACULTY ATTRIBUTES WITH RESPECT TO TARGET VARIABLE “PASS & FAIL”
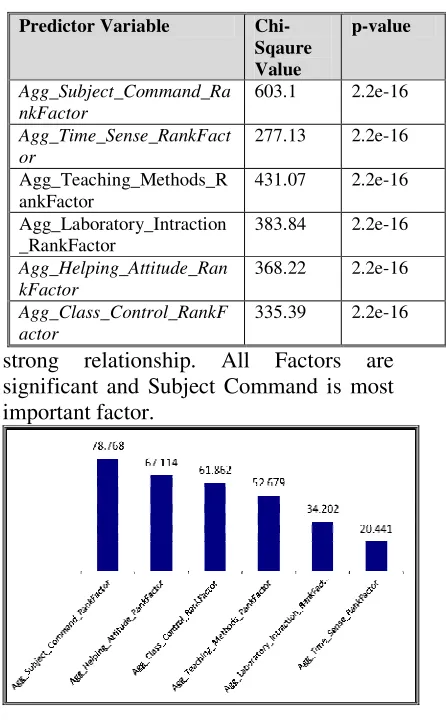
If we see p-value of less than .01 it rejects NULL hypothesis and clearly indicates
strong relationship. All Factors are significant and Subject Command is most important factor.
Fig. 6: Sorted Chi-Square Value
TABLE 3.5.3.1: CHI-SQUARE TEST FOR THE ASSESSMENT OF INPUT VARIABLES WITH RESPECT TO TARGET VARIABLE “GOOD_GRADES”
Here from the graph, it was clearly evident that all factorss are significant but Subject Command is the most important factor having chi-square value 78.768. Time_Sense factor comes out to be the lowest having value 20.441.
2) Performing Chi-Square test for faculty attributes
R chisq.test() function is used to carry out Chi-Square test of independence. We tested all our predictors’ w.r.t. our Target variable i.e.“Good_Grades”.
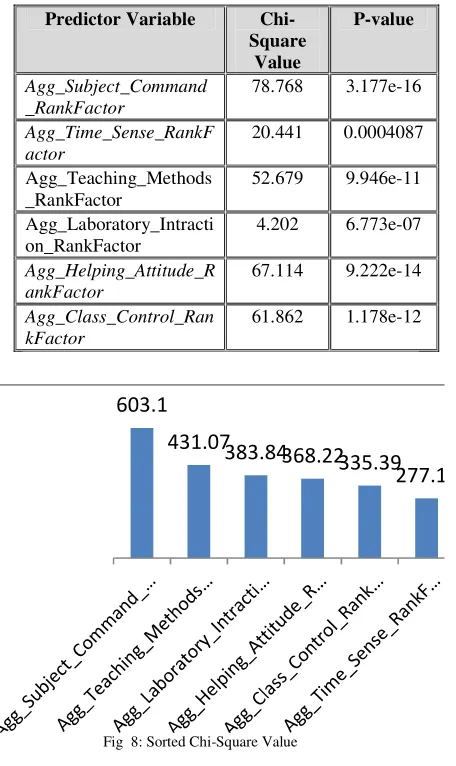
Predictor Variable Chi-Sqaure Value
p-value
Agg_Subject_Command_Ra nkFactor
603.1 2.2e-16
Agg_Time_Sense_RankFact or
277.13 2.2e-16
Agg_Teaching_Methods_R ankFactor
431.07 2.2e-16
Agg_Laboratory_Intraction _RankFactor
383.84 2.2e-16
Agg_Helping_Attitude_Ran kFactor
368.22 2.2e-16
Agg_Class_Control_RankF actor
Fig 7. Snapshot of the R performing Chi-Square test with target variable “Good Grades”
Predictor Variable Chi-Square
Value
P-value
Agg_Subject_Command _RankFactor
78.768 3.177e-16
Agg_Time_Sense_RankF actor
20.441 0.0004087
Agg_Teaching_Methods _RankFactor
52.679 9.946e-11
Agg_Laboratory_Intracti on_RankFactor
4.202 6.773e-07
Agg_Helping_Attitude_R ankFactor
67.114 9.222e-14
Agg_Class_Control_Ran kFactor
61.862 1.178e-12
603.1
431.07
383.84368.22335.39 277.13
Fig 8: Sorted Chi-Square Value
Again Subject Command comes up as most important and influential factor having Chi-Sqaure Value 603.1.
Class_Control is the lowest influential factor having Chi-Sqaure Value 335.39
V
CONCLUSIONThe aim of this analysis is to determine the importance of each variable individually i.e. the important attributes used in predicting faculty performance. It is concluded that attribute Subject Command (SC) impacts faculty performance the most. Other attributes viz Teaching Methods (TM), Laboratory Interaction (LI), Helping Attitude (LA), Class Control (CC) and Time Sense (TS) also effect the performance of faculty.
REFERENCES
[1] Kourosh Azizi , Teamur Aghamolaei,Nader Parsa and Tahereh Dabbaghmanesh, “Comparison of differences in performance evaluation of faculty by students with faculty’s self-assessment”, Journal of Advances in Medical Education & Professionalism, 2014 Jul; 2(3): 108–113. [2] Hatfield CL, Coyle EA., “Factors that influence student
completion of course and faculty evaluations”, American journal of pharmaceutical education, 2013; 77(2):27. [3] Aslam MN. “Student rating as an effective tool for teacher
evaluation”, Journal of the College of Physicians and Surgeons--Pakistan: JCPSP. 2013; 23(1):37–41.
[4] Chandrani Singh ,Arpita Gopal & Santosh Mishra, “Management Faculty Performance Evaluation with Signed and Unsigned Student Feedback using Linear Regression Technique”, International Journal of Information Technology and Knowledge Management, July-December 2011, Volume 4, No. 2, pp. 591-594.
[5] Thuy-Van T.Duong, Thuc-Doan Do, Thuc-Doan Do, “Exploiting Faculty Evaluation Forms to Improve Teaching Quality: An Analytical Review”, Science and Information Conference 2015 July 28-30, 2015 | London, UK. [6] Ajay Kumar Pal, Saurabh Pal, Ajay Kumar Pal et
al.,”Evaluation of Teacher’s Performance: A Data Mining Approach”, International Journal of Computer Science and Mobile Computing, Vol.2 Issue. 12, December- 2013, pg.359-369.
[7] P. Meena Kumari et al,” Educational Data Mining and its role in Educational Field”, International Journal of Computer Science and Information Technologies ((IJCSIT), Vol. 5 (2) , 2014, 2458-2461.
[8] Andrew GELMAN,” Exploratory Data Analysis for Complex Models”, Journal of Computational and Graphical Statistics, Volume 13, Number 4, Pages 755– 779.
[9] Chong Ho Yu, “Exploratory Data Analysis in the Context of Data Mining and Resampling”, International Joural of Pshycological Research, 2010, vol 3 No.1.
[10]Ajay Kumar Pal et al., International Journal of Computer Science and Mobile Computing, Vol.2 Issue. 12, December- 2013, pg.359-369, 2013, IJCSMC All Rights Reserved 366. [11]Ugoni A. On the subject of hypothesis testing, COMSIG
Review, 1993; 2(2): 45-8.
[13]Eva L. Baker, et. al ,Problems with the Use of Student Test Scores to Evaluate Teachers, Economic policy institute, Aug 29,2010.