INTRODUCTION
Friction stir welding (FSW) is a promising solid state process for joining materials, espe‑ cially when used on the high strength aerospace aluminum alloys that are difficult to weld [1]. The advantages of this method can include, first of all, the ease of obtaining joints with high, re‑ peatable mechanical and structural properties. This method can even be used to perform very long welds which are free from cracks and po‑ rosity and do not require the post‑weld cleaning. In addition, common faults such as cracking as‑ sociated with a conventional light metal weld‑ ing process are eliminated during welding with this method. One of the significant disadvantages of FSW is the appearance of inexpedient tensile stresses. The residual stress in the weld can result in a crack formation and propagation [2]. The sur‑ face treatment, such as shot peening (SP), is one of the methods used for mitigating tensile weld residual stresses. This process causes a beneficial
compressive residual stress, strain hardening and improves the fatigue strength of various materials [3, 4]. The SP process can be used to eliminate the costs associated with the quality control of a welding process, as well as other costs associated with the removal of a flow arm by milling [5]. The studies on the impact of various shot peening tech‑ niques, such as, for example: shot peening [3, 4], laser peening [2, 6, 7], cavitation shot peening [4, 8] or ultrasonic peening [9] on the properties of joints made with the FSW method can be found in the literature. The most commonly reported basic parameters characterizing the state and proper‑ ties of the surface layer of the welded butt joints include the following: a stereometric state of the surface, microhardness and a state of stress. The authors of the work [10] examined the effect of SP on the mechanical properties in the friction stir welded joints of 6061‑T6 aluminum alloy. The study shows that shot peening has beneficial effects on the fatigue strength, microhardness and
Analysis of the Possibilities of Improving the Selected Properties
Surface Layer of Butt Joints Made Using the FSW Method
Magdalena Bucior
1*, Rafał Kluz
1, Andrzej Kubit
1, K. Ochał
11 Rzeszow University of Technology, Faculty of Mechanical Engineering and Aeronautics, al. Powstańców Warszawy 8, 35‑959 Rzeszów, Poland
* Corresponding author’s e‑mail: [email protected]
ABSTRACT
The paper presents the results pertaining to an analysis on the influence of technological parameters of pneumatic shot peening technology on the selected properties of a surface layer of butt joints made with Friction stir weld‑ ing (FSW) method. Butt joints made of two 2024‑T3 aluminum alloy sheets with the thickness of 1 mm were shot peened with glass beads. The experiments were carried out according to the statistical 3‑level completed plan PS/DC 32. The technological parameters were changed in the range: pressure p = 0.4–0.6 MPa and peening time t = 1–3 min. As a result of the conducted research, adequate equations describing the effect of the analyzed parameters on the surface roughness were obtained. Shot peening with glass beads significantly reduced the sur‑ face roughness from Ra = 5.2 µm to Ra = 1.42 µm. This treatment provides high compressive residual stresses and the increase of the surface layer hardness. The results show that shot peening is a highly efficient and cost‑effective mechanical treatment used for improving the mechanical properties of the butt joints made with the FSW method.
Keywords: shot peening, FSW (friction stir welding), 2024, aluminum alloy
Volume 14, Issue 1, March 2020, pages 1–9 https://doi.org/10.12913/22998624/111662
Research Journal
Accepted: 2020.02.04residual stresses. The best results were obtained for the joints after SP performed with spherical ceramic shots (Z300), and Almen intensity of 0.24 A. Ali et al. [5] studied the effect of the con‑ trolled shot peening (CSP) on the fatigue behav‑ ior of 2024‑T3 aluminum friction stir welds. CSP delivers a significant improvement in terms of a fatigue life. The tensile residual stresses intro‑ duced in the thermo‑mechanically affected zone (TMAZ) during FSW were changed to compres‑ sive stresses after SP performed with shot S230 and Almen intensity of 14 A. In turn, Hatamleh et al. [2, 6] compared two peening methods: la‑ ser and shot peening. These techniques were used to introduce a compressive residual stress into FSW 7075‑T7351 and 2195‑T8 aluminum al‑ loys. The surface residual stresses resulting from SP on both alloys were higher when compared to laser peening. Likewise, Liu et al. [11] pre‑ sented the properties in the weld surface of FSW 7050‑T7451 aluminum alloys after laser peen‑ ing. The results of the tests indicated that hard‑ ness increased after laser peening by 9 HV. The fatigue life after this treatment was increased by 30%, 27% and 5% when the loading stress was 200 MPa, 250 MPa and 300 MPa, respectively. The residual stress in the weld zone (WZ) gen‑ erated a compressive residual stress that reached the largest value of 100 MPa, after this treatment. Kawashima et al. [7] studied the effect of fem‑ tosecond laser peening on the mechanical prop‑ erties of base and FSW 7075 aluminum alloys. They concluded that femtosecond laser peening enhanced the fatigue strength of the FSW speci‑ men by approximately 15 MPa compared to that of the base metal. This technique increased the surface hardness and induced a compressive re‑ sidual stress of approximately ‑330 MPa on the surface of FSW specimen.
The surface roughness is another important parameter affecting the surface quality of a com‑ ponent because a significant proportion of a com‑ ponent failure already starts on the surface due to discontinuity. The authors of the work [12] focused on the surface roughness in the peened FSW 2195‑T8 aluminum alloy. They observed that peening with glass beads with a diameter of 0.59 mm caused a significant increase in the
surface roughness compared to laser peening and non‑peened surfaces. The authors of the papers [2, 5÷7, 10÷12] mainly focused on the study of the impact of peening methods on the mechanical properties of the joints welded with FSW meth‑ od. Most of them follow traditional experimental methods i.e. varying one peening parameter at a time while other parameters remain constant. This conventional parametric design of an experiment approach is time consuming. The selection of ap‑ propriate technological parameters of the shot peening process is an important issue because wrong parameters can cause numerous defects and cracks, thus they may reduce the strength of the connection. Therefore, the shot peening stud‑ ies were performed according to the complete sta‑ tistical plan PS/DC 32. This plan is an effective tool for identifying significant factors by conduct‑ ing a relatively smaller number of experiments.
In this work, the shot peening method was used in order to improve the properties of the butt joints of 2023‑T3 aluminum alloy welded struc‑ ture. The experiments were conducted according to the statistical 3‑level completed plan PS/DC 32. The roughness, residual stresses and microhard‑ ness were analyzed after SP.
METHOD
The effect of the selected technological pa‑ rameters of shot peening on the roughness, resid‑ ual stress and microhardness after FSW process were examined with 1 mm thick sheets made of 2024‑T3 aluminum alloy. The chemical compo‑ sition and mechanical properties are presented in Tables 1 and 2, respectively. 2024 aluminum alloy in T3 state belongs to the group of hardly workable materials with low resistance to oxida‑ tion. It is used mainly in aviation for the elements of aircraft equipment, such as: steering columns, seat frames, covers, turn‑over mechanisms as well as for structural elements such as: plating of wings, fuselage, carriers or control rods
The FSW process was carried out on a uni‑ versal vertical milling machine with the use of a tool in the shape of a pin with a helix on the end (Fig. 1). Two sheets, 1 mm thick, were butt‑welded
Table 1. Chemical composition of the 2024 aluminum alloy (wt%).
Zn Fe Ti Cr Mg Mn Cu Si Al
in a perpendicular direction to the line of the weld formed. The welding tests were carried out for the following parameters: rotational speed n = 1300 rpm, feed rate f = 50 mm / min, inclina‑ tion angle of the tool of 3o. Next, the 12.5 mm
test specimens were cut from the welded sheets (Fig. 2).
In order to improve the properties of the joints made with the FSW method, they were subjected to the SP process in accordance with the research plan PS / DK 32 (Table 3).
The plan of the experiment assumes the adop‑ tion of three levels of control factors coded as x [13]:
• the minimum (‑), • the central (0), • the maximum (+).
The main aim of the test was to attain an ad‑ equate mathematical model in the form of the sec‑ ond degree polynomial with a significance level of α = 0.05:
j k kj k
kk k
k
o
b
x
b
x
b
x
x
b
y
2
(1)where: xk, xj – input factors, bo, bk, bkk, bkj – regres‑ sion function coefficients, y – an output factor (measured value).
Pneumatic shot peening was carried out on a special device designed for this type of tests. The technological parameters were changed in the range: shot peening time t = 1÷3 min and pres‑ sure p = 0.4÷0.6 MPa. The diameter of the glass beads, which was in the db = 500÷900 μm range, was a constant parameter in the experiment. The distance of the specimen to the nozzle was l = 250 mm.
The geometric surface structure investiga‑ tions were carried out using the Talysurf CCI Lite optical profilometer according to ISO 4287 [14]. The tests included measurements of the selected roughness parameters, profilograms, 3D views and contour maps. The residual stress was mea‑ sured with non‑destructive methods. The X‑ray diffractometer Proto iXRD Combo and computer software XRD Win 2.0 by Proto Manufacturing were used for this research. The research was carried out at the Department of Materials Sci‑ ence at Rzeszow University of Technology. The measurements were conducted in a longitudinal and transverse direction on a weld center before and after shot peening for some variants. The sin2Ψ [15] method was used to calculate the val‑ ues of residual stresses at a given measurement point. This is a standard method based on the use of Bragg‑Brentan symmetrical diffraction. This method uses Ψ type goniometer which enables to obtain appropriate inclinations of a diffrac‑ tion vector by angles Ψi in the plane perpendic‑ ular to the diffraction plane [16]. A lamp with a chrome anode and a beam of characteristic radia‑ tion CrKα with a wave length λ = 2.291 Å with
Table 2. Mechanical properties of 2024‑T3 aluminum alloy.
Tensile stress Rm
(MPa) Yield stress (MPa) Re Elongation A (%)
360 ÷ 425 250 ÷ 290 12 ÷ 14
a collimator diameter of 2 mm was used in the tests. The anode current was 4 mA, and the an‑ ode voltage was 20 kV. The stresses were deter‑ mined for the constant values of the angle Ψ in the range within 25° to ‑25°. Elastic deformation in the studied part was carried out for a diffraction line from the plane family {311} at the angle of 2θ = 139.3°. The values of Poisson’s ratio ν = 0.33 and Young’s modulus E = 73.1 GPa [17] were used in the measurements of the residual stress. A Vickers microhardness tester PMT‑3 was used to measure the hardness distribution according to ISO 6507 – 1: 2005 [18]. The microhardness of
the FSW and SP samples was measured across the weld zone at the distance of 0.15 mm from the top of the weld joint. The applied load was F = 2.94 N, for the time of 10 s.
RESULTS AND DISCUSSION
Surface roughness
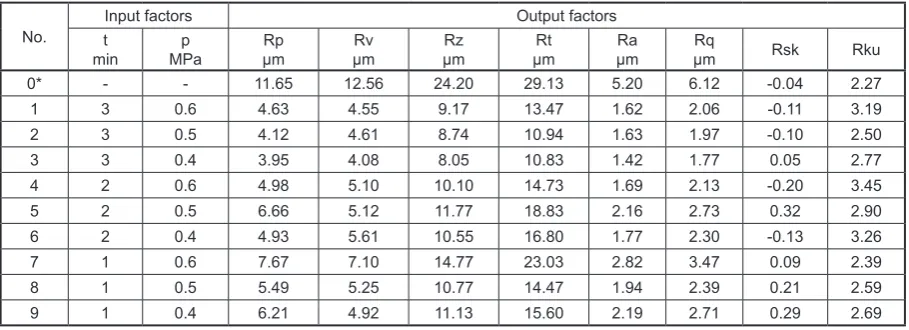
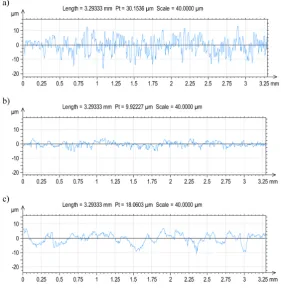
The average values of the selected rough‑ ness parameters of the joint made with the FSW method after SP with glass beads for different pa‑ rameters of a strengthening process and for the base variant (surface after welding) according to the plan PS/DC 32 are shown in Table 4. The ex‑ amples of the roughness profiles for the selected variants presented in Figure 3 and Table 5 show a 3D view of the surface, contours maps and se‑ lected parameters of 5 variants.
The presented surface roughness tests results showed that shot peening with glass beads has a positive effect on the condition of the surface layer of the joints made with the FSW method. The most frequently quoted roughness param‑ eters used to assess the surface condition after SP include the Ra parameter describing an average
Table 4. Average values of the selected surface roughness parameters obtained after a shot peening process according to plan PS/DC 32
No. tInput factors Output factors
min MPap µmRp µmRv µmRz µmRt µmRa µmRq Rsk Rku
0* ‑ ‑ 11.65 12.56 24.20 29.13 5.20 6.12 ‑0.04 2.27
1 3 0.6 4.63 4.55 9.17 13.47 1.62 2.06 ‑0.11 3.19
2 3 0.5 4.12 4.61 8.74 10.94 1.63 1.97 ‑0.10 2.50
3 3 0.4 3.95 4.08 8.05 10.83 1.42 1.77 0.05 2.77
4 2 0.6 4.98 5.10 10.10 14.73 1.69 2.13 ‑0.20 3.45
5 2 0.5 6.66 5.12 11.77 18.83 2.16 2.73 0.32 2.90
6 2 0.4 4.93 5.61 10.55 16.80 1.77 2.30 ‑0.13 3.26
7 1 0.6 7.67 7.10 14.77 23.03 2.82 3.47 0.09 2.39
8 1 0.5 5.49 5.25 10.77 14.47 1.94 2.39 0.21 2.59
9 1 0.4 6.21 4.92 11.13 15.60 2.19 2.71 0.29 2.69
0* – base variant (before shot peening)
Fig. 2. The sample used in the shot peening treatment
Table 3. Matrix of PS/DC 32 plan
No. x0 x1 x2 x12 x
22 x1x2
1 + + + + + +
2 + + 0 + 0 0
3 + + – + + –
4 + 0 + 0 + 0
5 + 0 0 0 0 0
6 + 0 – 0 + 0
7 + – + + + –
8 + – 0 + 0 0
9 + – – + + +
where: x1 – coded value of time t,
arithmetic deflection of the roughness profile and the Rz parameter representing the profile height according to ten points. The lowest roughness value was obtained for the SP time t = 3 min and the pressure p = 0.4 MPa (variant 3), where Ra and Rz were Ra = 1.42 μm and Rz = 8.05 μm, which is a decrease by 73% for Ra and by 67% for Rz, respectively, compared to the base vari‑ ant. In turn, the highest value of the Ra and Rz parameters was obtained for the variant No. 7 (t = 1 min. p = 0.6 MPa), where Ra = 2.82 μm and Rz = 14.77 μm, which is a decrease of 46% for Ra and 39% for Rz compared to the surface after welding. While analyzing the presented re‑ sults, it can be noticed that the smallest rough‑ ness was obtained for the peening time t = 3 min (variant 1–3). Reducing the shot peening time increases the surface roughness. For the variants 1–3, 7 and for the base sample, the topographic maps and the selected amplitude parameters were presented. The topographic maps (Table 3a) show a significant difference between the shot peened surface and the surface after welding with the FSW method. The process of SP results in the reduction of sharp peaks in the unevenness of the surfaces created during the welding. The sur‑ faces, according to the variants 2 and 3, do not have the remains of the roughness tops from the
preceding operation, so they are surfaces typical for shot peening. The values of the Sa parame‑ ter (average arithmetic deflection of the surface roughness) for these variants are in the range of Sa = 1.643–1.982 μm, which is a decrease in the range of 56–63% compared to the sample after welding, where Sa = 4.5 μm. The contour maps (Table 3b) also confirm that the highest degree of the surface coverage after SP, amounting to more than 90%, was obtained for the time of peening t = 3 min and the pressure in the range of 0.4–0.5 MPa.
As a result of the regression, a functional rela‑ tion between the process parameters (t, p) and the values of height roughness parameters (Rp, Rv, Rz, Rt, Ra, Rq, Rsk, Rku) were determined.
The obtained relations are described with the following equations (Eq. 2÷9):
𝑅𝑅𝑅𝑅 = 7.763 − 1.111𝑡𝑡 (2)
𝑅𝑅𝑅𝑅 = 0.414 + 1.464𝑡𝑡 + 12.1𝑝𝑝 − 4.27𝑡𝑡𝑝𝑝 (3)
𝑅𝑅𝑅𝑅 = 4.381 + 1.356𝑡𝑡 + 19.75𝑝𝑝 − 6.28𝑡𝑡𝑝𝑝 (4)
𝑅𝑅𝑅𝑅 = 13.813 + 5.287𝑅𝑅 − 2.066𝑅𝑅2 (5)
𝑅𝑅𝑅𝑅 = 2.631 − 0.382𝑡𝑡 (6)
𝑅𝑅𝑅𝑅 = 3.281 − 0.462𝑡𝑡 (7)
𝑅𝑅𝑅𝑅𝑅𝑅 = −3.30 − 0.125𝑡𝑡 + 14.2𝑝𝑝 − 14.2𝑝𝑝2 (8)
𝑅𝑅𝑅𝑅𝑅𝑅 = 8.322 + 2.06𝑡𝑡 − 29.5𝑝𝑝 − 0.515𝑡𝑡2 + 29.5𝑝𝑝2
𝑅𝑅𝑅𝑅𝑅𝑅 = 8.322 + 2.06𝑡𝑡 − 29.5𝑝𝑝 − 0.515𝑡𝑡2 + 29.5𝑝𝑝2 (9)
While analyzing the obtained equations, it can be concluded that both analyzed technologi‑ cal parameters of the shot peening process (time
and pressure) had an effect on the roughness of the joints made with the FSW method. The time of peening had a significant influence on the am‑ plitude parameters such as Rp, Rt, Ra and Rq. However, in the case of Rv, Rz, Rsk and Rk pa‑ rameters, pressure played a significant role.
Residual stress
Figures 4 and 5 illustrate the residual stresses in a longitudinal (σy) and transverse (σx) direction for some variants. The measurements of the resid‑ ual stresses were made on a weld center. The re‑ sults show that after welding with the FSW meth‑ od in a longitudinal direction, unfavorable tensile residual stresses, reaching σy = 5.46 MPa, were created. In turn, shot peening caused compres‑ sive residual stresses with relatively large values reaching σy = ‑166.15 MPa on the surface layer. For the peened variants, there is a minor differ‑ ence in the residual stress values between the lon‑ gitudinal and transverse directions. The direction
of the stress measurement is important in the case of the welded surface, where a significant differ‑ ence between the measurements can be observed. Compressive stresses of σx = ‑64.24 MPa were observed in the transverse welding direction for the base variant. While analyzing the presented variants after burnishing, it can be concluded that the most favorable stresses were obtained for the time of peening t = 3 min and the pressure p = 0.4 MPa (variant 3), where σx = ‑169.06 MPa and σy = ‑166.15 MPa. In turn, the lowest val‑ ues of the shot peening stress were observed for the variant 1 (t = 3 min, p = 0.6 MPa), where σx = ‑93.72 MPa and σy = ‑121.18 MPa. Shot peening causes a favorable compressive stress in‑ crease from 31 to 62% in the transverse direction, and about 95 ÷ 97% in the longitudinal direction, compared to the stress of the FSW method.
Figure 6 presented the distribution of mi‑ crohardness profiles across the weld zone at the distance of 0.15 mm from the top of the weld joint for some variants. The results indicate that
Fig. 4. Residual stress in a longitudinal direction
the hardness of the heat‑affected zone (HAZ), thermo‑mechanically affected zone (TMAZ) and weld zone (WZ) increased after SP. Peen‑ ing pressure is an important parameter that posi‑ tively affects the microhardness. For the pressure p = 0.6 MPa (variant 1) ,the average microhard‑ ness in WZ increased by 2.4 HV in comparison to the base variant, and by 2 HV compared to the variant 3 (p = 0.4 MPa). A decrease in the micro‑ hardness – typical for this process – ranging from 3.5 to 15 HV can observed in HAZ.
CONCLUSIONS
The results show that shot peening is a highly efficient and cost‑effective mechanical treatment used for improving the mechanical properties of butt joints made with the FSW method. In sum‑ mary, it can be concluded that the use of glass beads with the granulation of 500 ÷ 900 μm sig‑ nificantly reduced the surface roughness, caused high compressive residual stresses and increased the microhardness of the surface layer. The best results were obtained for the samples peened at the time t = 3 min under the pressure p = 0.4 MPa (variant 3). In this case, the surface roughness was reduced to Ra = 1.42 µm and Rz = 8.05 µm, compared to the base variant of Ra = 5.2 µm and Rz = 24.2 µm, respectively. SP also provides com‑ pressive residual stresses σy = ‑166.15 MPa and σx = ‑169.06 MPa (variant 3) which are increased by about 31–62% in the transverse direction and about 95–97% in the longitudinal direction compared to welding of butt joints. Shot peening positively affects microhardness. It has increased by 2.4 HV in WZ in comparison to the joint af‑ ter welding with the FSW method. The conduct‑ ed research plan PS/DC 32 pointed out that both analyzed technological parameters of the pneumo
shot peening process have a significant impact on the surface roughness after welding.
REFERENCES
1. Sue J. Q., Nelson T.W., Mishra R., Mahoney M.: Microstructural investigation of friction stir welded 7050‑ T651 aluminum. Acta Materialia 51, 2003, p. 713–29.
2. Hatamleh O., DeWald A.: An investigation of the peening effects on the residual stresses in friction stir welded 2195 and 7075 aluminum alloy joints. Journal of Materials Processing Technology 209, 2009, p. 4822–4829.
3. Bucior M., Kubit A., Stachowicz F., Zielecki W.: The impact of heat treatment and shot peening on the fatigue strength of 51CrV4 steel. Procedia Struc‑ tural Integrity. 2016, Vol. 2, p. 3330–3336. 4. Takahashi K., Osedo H., Suzuki T., Fukuda S.: Fa‑
tigue strength improvement of an aluminum alloy with a crack‑like surface defect using shot peening and cavitation peening. Engineering Fracture Me‑ chanics 193, 2018, p. 151–161.
5. Ali A., An X., Rodopoulos C. A., Brown M.W., O’Hara P., Levers A., Gardiner S.: The effect of controlled shot peening on the fatigue behavior of 2024‑T3 aluminium friction stir welds. International Journal of Fatigue 29, 2007, p. 1531–1545. 6. Hatamleh O., Lyons J., Forman R.: Laser and shot
peening effects on fatigue crack growth in friction stir welded 7075‑T7351 aluminum alloy joints. In‑ ternational Journal of Fatigue 29, 2007, p. 421–434. 7. Kawashimaa T., Sanoa T., Hirosea A., Tsutsumib S.,
Masakic K., Arakawad K., Hori H.: Femtosecond Laser Peening of Friction Stir Welded 7075‑T73 Aluminum Alloys. Journal of Materials Processing Tech. 262, 2018, p.111–122.
8. Soyama H.: Comparison between the improvements made to the fatigue strength of stainless steel by cavitation peening, water jet peening, shot peening and laser peening. Journal of Materials Processing
Technology 269, 2019, p. 65–78.
9. Yin F., Liu Y., Xu R., Zhao K., Partin A., Han Q.: Nanograined surface fabricated on the pure copper by ultrasonic shot peening and an energy‑density based criterion for peening intensity quantification. Journal of Manufacturing Processes 32, 2018, p. 656–663.
10. Mustafa A. Abdulstaar., Khaled J. Al‑Fadhalah., Lothar Wagner.: Microstructural variation through weld thickness and mechanical properties of peened friction stir welded 6061 aluminum alloy joints. Ma‑ terials Characterization 126, 2017, p. 64–73. 11. Liu P., Sun S., Xu S., Li Y., Ren G.: Microstruc‑
ture and properties in the weld surface of friction stir welded 7050‑T7451 aluminium alloys by laser shock peening. Vacuum 152, 2018, p. 25–29. 12. Hatamleh O., Smith J., Cohen D., Bradley R.: Sur‑
face roughness and friction coefficient in peened friction stir welded 2195 aluminum alloy. Applied Surface Science 255, 2009, p. 7414–7426.
13. Korzyński M.: Experiment methodology. WNT. Warsaw, 2013 (in Polish).
14. PN‑EN ISO 4287: 1999. Geometrical product spec‑ ifications (GPS). Surface texture: Profile method. Terms. definitions and surface texture parameters. 15. Bonarski J. T.: Measurement and use of the tex‑
ture‑stress microstructure characteristics in materi‑ als diagnostics. Institute of Metallurgy and Mate‑ rials Science of the Polish Academy of Sciences. Cracow, 2013 (in Polish).
16. Skrzypek S. J.: New possibilities of measuring mac‑ ro stress of materials using X‑ray diffraction in the geometry of a constant angle of incidence. Publisher AGH. Cracow, 2002 (in Polish).
17. Kłysz S.: Basics of strength of materials. Publisher: Technical Institute of Air Forces. Warsaw, 2015 (in Polish).