R E S E A R C H
Open Access
Multiple peer effects in the diffusion of
innovations on social networks: a simulation
study
Hang Xiong
1*, Puqing Wang
2and Georgiy Bobashev
3*Correspondence:[email protected] 1Agricultural Economics and Policy Group, ETH Zurich, 8092 Zurich, Switzerland
Full list of author information is available at the end of the article
Abstract
Peer effects in innovation adoption decisions have been extensively studied. However, the underlying mechanisms of peer effects are generally not explicitly accounted for. Gaps in this knowledge could lead to misestimation of peer effects and inefficient interventions. This study examined the role of two mechanisms—sharing experiences (namely, experience effect) and externalities—in the adoption of an agricultural innovation. By referring to the diffusion process of a new crop in Chinese villages, we developed a simulation model that incorporated experience effect and externality effect on a multiplex network. The model allowed us to estimate the influence of each specific effect and to investigate the interplay of the positive and negative directions of the effects. The main results of simulation experiments were the following: (1) a negative externality effect in the system caused the diffusion of innovation to vary around a middle-level rate, which resulted in a fluctuating diffusion curve rather than a commonly found S-shaped one; (2) in the case of full diffusion, experience effect significantly shaped the diffusion process at the early stage, while externality effect mattered more at the late stage; and (3) network properties (i.e. connectivity, transitivity, and network distance) imposed indirect influence on diffusion through specific peer effects. Overall, our study illustrated the need to understand specific causal mechanisms when studying peer effects. Simulation methods such as
agent-based modelling provide an effective approach to facilitate such understanding.
Keywords: Peer effects, Innovation diffusion, Social network, Agent-based simulation
Background
Social interactions can significantly shape individuals’ economic behaviours. This is espe-cially true when an individual behaves upon situations with uncertainties. In particular, an individual’s decision on whether to adopt an innovation (i.e. the idea, practice, or object that are perceived as new (Rogers2003)) often depends on the decisions of their friends, relatives, colleagues, etc. Such social influence is referred to aspeer effects. Exist-ing studies have examined peer effects on the diffusion of innovations in varied settExist-ings, including products and services (Goolsbee and Klenow1999; Sorensen2006; Kremer and Levy2008; Luan and Neslin2009), technologies (Munshi2004; Bandiera and Rasul2006; Conley and Udry2010), financial services (Banerjee et al.2013), and social programmes (Dahl et al.2014). In these studies, many forms of peer effects, including word of mouth (Luan and Neslin2009; Banerjee et al.2013), social learning (Bandiera and Rasul2006;
Conley and Udry 2010), and network externalities (Goolsbee and Klenow 1999), are discussed1.
The work by (Xiong et al.2016) distinguishes three basic interactions through which peer effects take place in the diffusion of innovations: transmitting information, sharing experiences and externalities. They are termed asinformation effect,experience effect, and
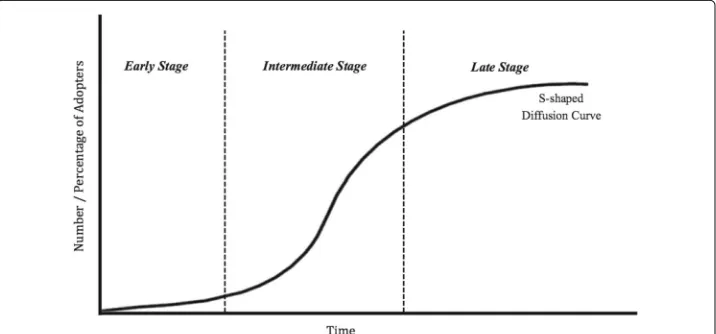
externality effect, respectively. Specifically, information effect refers to the influence of the transmission of awareness information of the innovation and general information about the cost and benefit of adopting the innovation. The effect can occur through any relation-ship ties through which individuals can communicate. Experience effect characterises the influence that one obtains by sharing experiential knowledge (e.g. know-how, localised techniques) or physical resources (e.g. seeds of a new crop, tools) from earlier adopters. Such knowledge and resource are generally scarce at this stage of the diffusion process. Experience effect thus mainly occurs through close social relationships, such as kinship or close friendship. In addition, an individual’s adoption behaviour can lead to positive or negative externalities. They can affect other individuals regardless of whether those indi-viduals also adopt the innovation. Negative externalities leads to the reduction of payoff when staying on the original choice, and consequently increases individuals’ propensity to choosing the innovation, which in turn increases the diffusion in the group, generating a positive externality effect. Likewise, positive externalities can generate a negative exter-nality effect. In empirical studies, negative exterexter-nality effect is rarely considered mainly due to the difficulty of collecting data. In general, the three effects have significant impacts on different stages of the diffusion process. Information effect shapes the process mainly at the early stage, experience effect at the intermediate stage, and externality effect at the late stage as depicted in Fig.1.
Peer effects were previously studied either as a composite of different mecha-nisms or in a specific form (such as social leaning or network externalities). Typi-cally only one mechanism was considered. However, a diffusion process is very often shaped by multiple mechanisms simultaneously, and each mechanism could play a different role at a different phase of the evolution of the process. Different mecha-nisms may potentially have different policy implications (Carrell et al. 2013; Alcalde 2013). This paper is a theoretical study to examine the roles of multiple peer effects
in the diffusion of innovations. We have chosen a case of the adoption of a new crop in rural China to set up our simulation model and to select key experimental parameters. In this case, all households were well informed of the new crop at the beginning of the diffusion, and thus, information effect is excluded from our model. Our model and estimation are therefore focused on experience effect and externality effect.
Background and data
This paper use the case of the diffusion of a high-value crop (a crop with high eco-nomic return) in 10 villages in rural China to demonstrate multiple types of peer effects in the adoption of an innovation. The farmers in these villages traditionally farmed staple rice and cotton. The new vegetable, Artemisia selengensis (AS), was introduced into the villages in 2001. To encourage farmers to grow AS, village lead-ers distributed some seed-stalks to each household for free. This action informed all households about the new crop. However, as the farmers were not certain about the profitability of farming a new crop, there were only one or two households in each vil-lage (the average number of households was 37, with a standard deviation of 14) who adopted in the first year. These earlier adopters were mainly motivated by the aware-ness information they obtained. Their adoption behaviour was thus the result of the information effect.
When other farmers realised that farming the AS was much more profitable, they also started to farm in subsequent years. However, they encountered difficulty in obtaining seed-stalks, which can only remain fresh for a few days. It turned out that the only reli-able source at the time was the earlier adopters in their villages. The seed-stalks were so scarce at the time that a household could obtain them exclusively from its close rela-tives. Those who managed to obtain the seed-stalks in a given year then shared them with other households next year, and so forth. Meanwhile, new adopters were often benefited by obtaining techniques and tacit knowledge from their relatives and house neighbours who have adopted earlier. Overall, the sharing of such experiential resources provided the main motivation for farmers’ adoption in this stage. By 2005, more than 70% of the households had adopted AS.
When the majority of the households by then had adopted, the non-adopters were put under some pressure to join in, mainly through the use of irrigation. There was nearly a half-year period during which both AS and cotton were active on the land. However, farming AS required much more water than farming cotton. A plot for farming cotton could thus be over flooded as its adjacent plots were planted with AS. Therefore, house-holds farming cotton in this situation would be ‘coerced’ into adopting AS. Such adoption was thus attributed to positive externality effect.
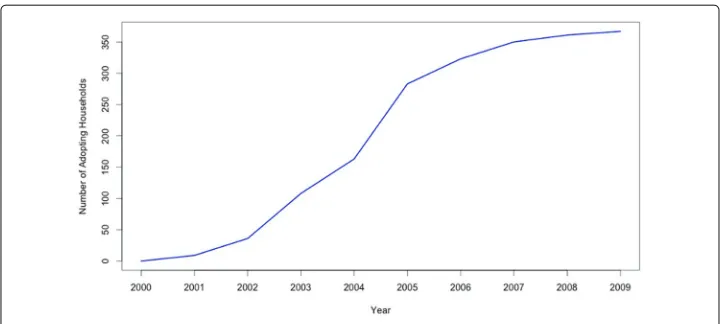
Figure2presents adoption rates of the new crop throughout the entire diffusion period. It shows an S-shaped diffusion curve as many other studies do. This case provides an excellent demonstration for the study of different types of peer effects in a complete diffusion process.
Fig. 2Diffusion of the new crop in the Chinese villages
Methods and model
In this section, we first justify our choice of agent-based modelling for conducting this study. We then described how agents’ behavioural environment (i.e. the social networks) and agents’ decision-making are represented in our model. Finally, we present how parameters in the model are set up.
Agent-based modelling approach
The underlying mechanisms following which peer effects occur in a diffusion process are generally nuanced and subtle. Empirical analysis is largely restricted because of the difficulty of data collection. Moreover, traditional approaches such as regression anal-ysis are not capable to explicitly represent dynamic behavioural mechanisms of such. Additionally, negative peer effects in diffusions seldom enter researchers’ notice. This is because failed or incomplete diffusions, which negative effects often end up with, do not draw much attention. In this study, we conducted a theoretical study following the agent-based modelling approach. This approach is able to incorporate micro-level adop-tion mechanisms, individuals’ heterogeneity, and social relaadop-tionships among individuals (Kiesling et al.2012). Particularly for this study, it allows for the incorporation of the nega-tive externality effect. This approach has been used to examine, for instance, the neganega-tive effects of word of mouth (Goldenberg et al.2001; Deffuant et al.2005).
We developed an agent-based model with peer interactions being structured in a mul-tiplex network, that is, a network consisting of multiple layers, on each of which a type of relationship is mapped (Arenas et al.2014). This approach allows us to identify different peer effects in the system (Bramoulle et al.2009; Goldsmith-Pinkham and Imbens2013). To keep the model simple, we only include two effects: experience and externality. The development of our model is based on two assumptions.
Assumption 1: Peer effects exist and impose impacts on the diffusion process in the social system in study.
Assumption 2: Different types of specific peer effect (mainly) occur through different types of social relationship.
In our study, specific peer effects are distinguished according to the kind of social interactions through which they take place. It is observed that a particular type of social interaction tends to mainly take place through a particular type of social relationship (or a particular set of different types). Therefore, it is plausible that researchers are able to spec-ify through which type(s) of relationship different specific peer effect occur in a system. This assumption enables us to model different specific peer effects on different network layers and examine how the characteristics of a network layer shape the peer effect on that layer.
Setup of network structure
We took the real-world case described in the “Background and data” section as a reference to design the simulation. We modelled the diffusion of the new crop using an agent-based model. In the model, the social system (environment) is village, represented as a social network. The agents were the households in the village, represented as nodes on the social network. In the villages, the interactions among households that substantially shape the diffusion mainly occurred through kinship ties, house neighbourhood ties and land plot neighbourhood ties2.
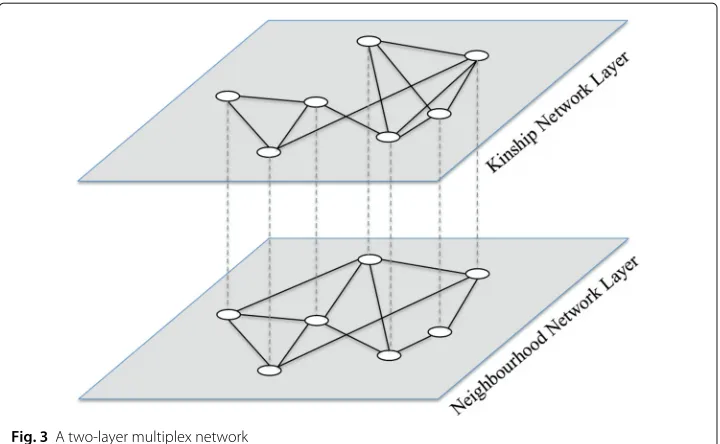
In the model, a small portion of households are set to have adopted the innovation in the initial time. They can be considered as those adopted due to the awareness of the innovation. In other words, our model ignores information effect and focuses on expe-rience effect and externality effect. According to the previous discussion, we reasonably assumed that experience effect occurs through kinship ties and house neighbourhood ties, whereas externality effect occurs through land plot neighbourhood ties. Since the kinship ties and house neighbourhood ties are highly overlapped in these villages (as the land for building houses were to large extent allocated based on extended family, house neighbours are often family members), we term the network consists of the two types of ties as kinship network for the sake of simplicity. The network consists of land plot neigh-bourhood ties is thus termed as neighneigh-bourhood network. The social network on which the peer effects occur are structured thus has two layers: the kinship network layer and the neighbourhood network layer, as demonstrated in Fig.3.
We then simulated the kinship network as a Watts-Strogatz (WS) small-world network (Watts and Strogatz1998) and simulated the neighbourhood network as an Erdös-Rényi (ER) random network (Erd˝os and Rényi1959). These settings are reasonable. First, the kinship networks in these villages are very similar to small-world networks according the empirical study (Xiong and Payne2017) and this finding echoes the classic theory of ‘acquaintance society’ on the structure of traditional Chinese structure. Second, the land plot neighbourhood networks are close to random networks according to the same empirical study. This is the case because the plots were originally distributed by lot. The parameters defining the network structures were roughly calibrated according to the network characteristics of the villages in our real-world case.
Simulation of agents’ decision-making
Fig. 3A two-layer multiplex network
probability of adopting the innovation increases as the fraction of peers that adopt increase. The other is a threshold-based approach (e.g. (Granovetter1978; Singh et al. 2013)), where individuals change their adoption state when a certain threshold of utility is reached. In the case of this study, on the kinship network, the more an individual’s peers have adopted the new crop, the more likely that the individual gains information and thus follow suit. We therefore simulated experience effect on the kinship network following the probability-based approach. The probability for an individual to adopt is proportional to the fraction of his family members who have adopted. Meanwhile, the externalities of planting the new crop are mainly determined by the nature of the crop itself, such as its compatibility with the existing crop. This can be viewed as a threshold that all practi-tioners face. Once the fraction of one’s neighbours who adopt reaches the threshold, an individual will adopt for sure. Thus, the externality effect occurring on the neighbourhood network is modelled using a threshold.
Suppose there areNnodes in the network, i.e. on each of the two layers. On the kinship network, node (household)ichooses to adopt the innovation with a probabilitypi. The probability is determined by the fraction of his adopting peersfikinas well as his risk pref-erence (a representative of the individual’s personal characteristics)xi∈(0, 1). Therefore, pi = θfikinxi, whereθ ∈(0, 1)is a coefficient indicating the degree of information effect (namelyinformation coefficient). On the neighbourhood network, householdichanges his adoption state when the fractions of his adopting neighboursfigeo reaches a unified adoption threshold (namelyexternality threshold, denoted byδ), which is determined by the characteristics of the new crop. When the threshold is reached, in the scenario of the positive externality effect, thenon-adoptersswitch to adopting state; in the scenario of negative externality effect, theadopterschange back to non-adopting.
A household has two adoption status:adoptingornon-adopting. We track households’ adoption states and the ratio of adopting households (namely theadoption rate) at the village level. The basic algorithm of the simulation is as follows:
A fractionλof seed adopters is selected from the population of the households at random. Meanwhile, their adoption states are set to be adopting.
(ii) Iteration at timet,
Households update their state through kinship ties and neighbourhood ties simultaneously.
(a) Updating on the kinship network
The non-adopters adopt with probabilitypit=θfitkinxi. (b) Updating on the neighbourhood network
In the scenario of positive externality effect, non-adopting householdi transmits to adopting state once the fraction of his adopting neighbours reaches the externality threshold, i.e.fitgeo> δ.
In the case of negative externality effect, adopting householdi transmits to non-adopting state once the fraction of his adopting neighbours reaches the externality threshold, i.e.fitgeo> δ.
The two updating mechanisms occur simultaneously in reality, so we set the order to be random when updating on the two layers in the model. The process repeats until any of the following termination rules is satisfied: (i) the adoption rate is lower than 5% (which is the lowest ratio of seed adopters), (ii) the adoption rate is higher than 95% (i.e. complete diffusion), and (iii) it iterates for 20 times—this is sufficient for the system to converge in most cases (both in the simulation and in the real world).
Model parameterisation
The parameters in the simulation model are set using the survey data from the 10 reference villages. Parameter values are set to the mean estimates from the data. The parameters were set up as follows:
• Number of nodes (the population)N∈[ 20 : 20 : 80]
• Fraction of rewiring nodes in the generation of WS small-world networks WSf ∈ {0.05, 0.s, 0.15}
• Rewiring probability in the generation of ER random networks
ERprob∈ {0.10, 0.15, 0.20}
• Experience coefficientθ ∈[ 0.05 : 0.05 : 0.25] • Externality thresholdδ∈[ 0.6 : 0.05 : 0.80] • Ratio of seed adopterss∈[ 0.05 : 0.05 : 0.20]
• Risk preference of householdi,xi. The value is generated as a positive random number with normal distribution (mean 1 and standard deviation 0.3; truncated to 0 and 2 for values less than 0 and greater than 2 respectively).
We run each parameter combination 100 times. There are 3600 (full factorial) combina-tions in total, and the model runs each of these combinacombina-tions 100 times. Finally, 360,000 sets of simulation results were generated.
Results and discussion
Convergence adoption rates and diffusion curves
Scenario of positive externality effect
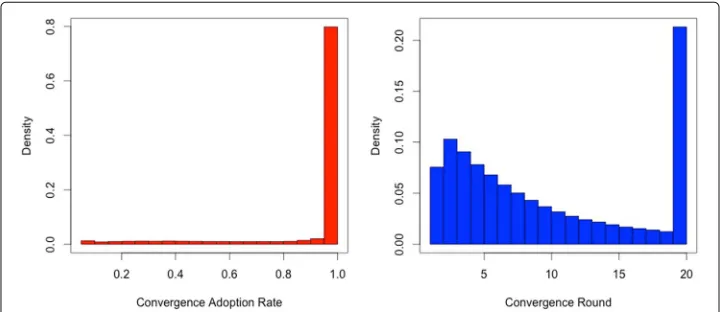
runs converge tofull adoption(that is, as we defined, more than 90% of the population have adopted) within 20 iterations. It means that most individuals adopt eventually. The right panel indicates how many rounds it takes for the runs to converge. More than 40% of the runs converge in five rounds. The density decreases with the number of rounds3. In this scenario, both the two diffusion mechanisms are positive feedback mechanisms, so it is very likely that the system will converge to complete diffusion.
S-shaped diffusion curves. The S-shaped adoption curve is a typical pattern of the dif-fusion. It holds because most innovations bear the following feature: The adoption rate grows slowly at the beginning of the diffusion process. When the diffusion reaches the
critical mass, it will have a sharp increase. After that, it will slowly approach complete diffusion. The variance lies in the slope of the curve. The innovations diffusing rapidly generate steep curves, whereas those diffusing slowly generate flat curves. Our simula-tions successfully generate S-shaped diffusion curves. Figure 5displays the curves for the diffusions converge at the sixth round, and the ratio of seed adopters is 0.05 and 0.1, respectively4.
Scenario of negative externality effect
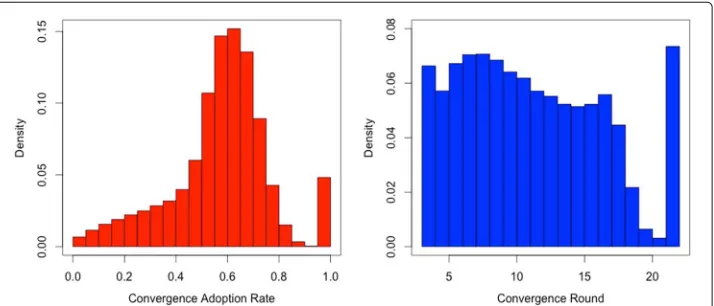
Convergence adoption rates. The diffusion converges to diverse adoption rates in this scenario. As shown in Fig.6, nearly 70% of the simulations converge to an adoption rates between 40 and 80%. Specifically, more than 25% converge to a value in the interval of 50−60% and more than 25% converge to a value between 60 and 70%. Only about 5% end up with full adoption. More than 90% of the simulations converged within 20 rounds.
When a negative effect is introduced, the diffusion curve dramatically changes its shape. Converging to full adoption is not a certain outcome any more. At which adoption rate the diffusion will converge depends on the competition between the positive effect and the negative effect. This result provides an interpretation of the incomplete diffusion phe-nomena in the real world. For instance, in the case of mircofinance (Banerjee et al.2013), the average take-up rate is 18.5% over all rural communities that were studied. Most inno-vations end up with not been taken up by all potential adopters in the social group. New fashionable clothes can be a typical example. When they go from high fashion to street
Fig. 5S-shaped diffusion curves (convergence round = 6)
fashion, they are not considered fashionable any more, and thus become less attractive. This negative effect leads the diffusion to converge before reaching full adoption.
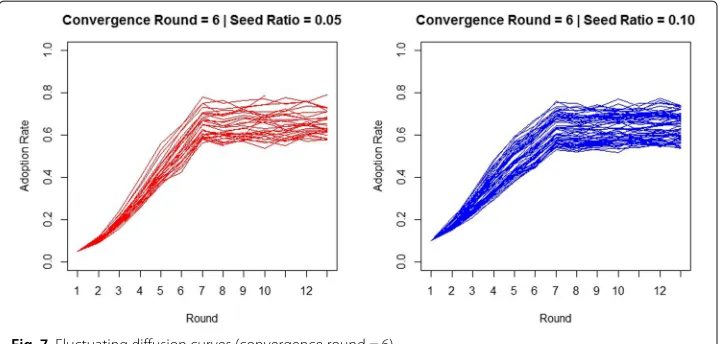
Fluctuating diffusion curves. Figure7displays the diffusion curves for the simulations that converge, again, at the sixth round with the ratios of seed adopters 0.05 and 0.1, respectively. To exhibit the trends of the curves, the adoption rates after the convergence are also plotted. The graph shows that the diffusion curves fluctuate around a value in the middle of 0 and 1 (approximately 0.6 in our case). The specific convergence value depends on the relative strength of the two opposite effects in the diffusion process.
Overall, when all specific diffusion mechanisms in the system are in favour of diffusion, the system will almost always converge to complete diffusion, and an S-shaped diffusion curve will be generated. When there is a negative mechanism, it reshapes the diffusion to fluctuate around a middle-level rate, hence generating fluctuating diffusion curves.
Experience effect and externality effect
We explore how experience effect and externality effect influence the effectiveness of dif-fusion, which is measured by the reach of the diffusion and its speed. The two measures are both related toadoption rate, the fraction of households that have adopted at a round
Fig. 7Fluctuating diffusion curves (convergence round = 6)
to the whole population. Specifically,convergence adoption rate, reflecting the reach of the diffusion, is defined as the adoption rate at which the diffusion converges.Diffusion speedis defined as the increase of the adoption rate per round, or namely, the expression of the adoption rate achieved by the number of rounds to achieve it5. However, the two metrics cannot be both used in positive and negative externality effect at the same time. When the externality effect is positive, the diffusion almost always converges to 100%, so the convergence adoption rate is not a feasible metric. Likewise, the diffusion speed does not apply when the externality effect is negative because the adoption rate oscillates over the diffusion process, but we can useconvergence speed(how fast the diffusion process converges) as a substitute. It is the quotient of convergence adoption rate by the number of rounds it takes to achieve the rate. Therefore, the diffusion speed is used in the scenario of positive externality effect, whereas the convergence adoption rate and convergence speed are employed in the scenario of negative externality effect.
In the model, the experience effect and the externality effect are reflected by the experi-ence coefficient and the externality threshold, respectively. Higher experiexperi-ence coefficient indicates higher experience effect, whereas higher externality threshold indicates lower externality effect. To estimate their impact on the effectiveness of diffusion, we run a multivariate regression using the following equation:
y=α0+α1θ+α2δ+α3s+Wα4+ (1)
whereyis the diffusion speed (in the scenario of positive externality effect) or the con-vergence adoption rate (in the scenario of negative externality effect),θ is the experience coefficient,δ is the externality threshold,sis the ratio of initial seed adopters, andW
is the network characteristic controls, including number of nodesN, parameters used in generating ER network (i.e. rewiring probability ERprob), and WS network (i.e. fraction of rewiring nodesWSf).
values significantly large than MME signify significant difference, and when the statisti-cal significance is not achieved, it signifies that no conclusion could be made given the data. Under such paradigm, the increase in the number of simulations will increase the precision and reduce thepvalues but will not produce artificially significant small-effect sizes (Wellek2010). Such approach is also the basis for a classic power analysis, which requires to explicitly define a minimally meaningful effect size. In our study, we have selected the MME to be 0.1 standard deviation. Our judgement on the significance of estimated values in the regression results in this study are based on the minimum-effect test (whether they are significantly larger than the minimal effect defined as 0.1 of the standard deviation).
Scenario of positive externality effect
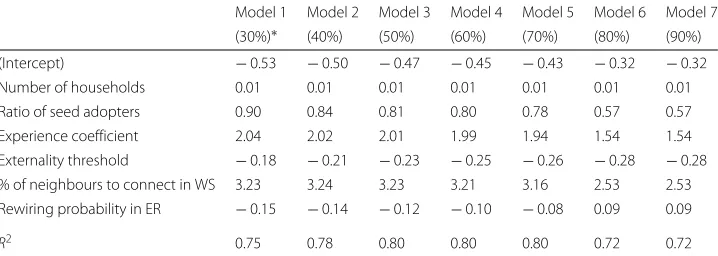
We regress the diffusion speed when the adoption rate reaches 30%, 40%, up to 90%. Table 1 presents the results6. First, all the estimated values were significantly larger than the minimal effect defined as 0.1 of the standard deviation. Specifically, both the experience coefficient and the externality threshold in the simulation are highly sig-nificantly associated with the diffusion speeds, and the signs are in accordance with expectations. This indicates that they both impose a significant influence on the diffu-sion. More importantly, we found the influence of the experience effect wanes as the adoption rate increases (i.e. the diffusion process), while the influence of the exter-nality effect continuously grows. At the earlier stage, the adopters are few, so only a small number of households can reach the externality thresholds. Consequently, the externality effect has a limited impact on the diffusion. Meanwhile, the experience effect, which is continuous and steady, has a major contribution. At the later stage, there are more adopters; thus, more households can reach the externality thresh-old. Externality effect, therefore, become relatively higher. However, this could under-mine the influence of experience effect, because the two effects can substitute each other—a household can make the adoption decision because of either experience effect or externality effect. Such a substitution effect becomes larger as the adoption rate increases.
Scenario of negative externality effect
We run the regression also using Eq. (1). The same explanatory variables as in the scenario of positive externality effect (the experience coefficient, the externality threshold, the ratio
Table 1Regressions of adoption speed at different diffusion levels (positive externality effect)
Model 1 Model 2 Model 3 Model 4 Model 5 Model 6 Model 7 (30%)∗ (40%) (50%) (60%) (70%) (80%) (90%)
(Intercept) −0.53 −0.50 −0.47 −0.45 −0.43 −0.32 −0.32
Number of households 0.01 0.01 0.01 0.01 0.01 0.01 0.01
Ratio of seed adopters 0.90 0.84 0.81 0.80 0.78 0.57 0.57
Experience coefficient 2.04 2.02 2.01 1.99 1.94 1.54 1.54
Externality threshold −0.18 −0.21 −0.23 −0.25 −0.26 −0.28 −0.28 % of neighbours to connect in WS 3.23 3.24 3.23 3.21 3.16 2.53 2.53 Rewiring probability in ER −0.15 −0.14 −0.12 −0.10 −0.08 0.09 0.09
R2 0.75 0.78 0.80 0.80 0.80 0.72 0.72
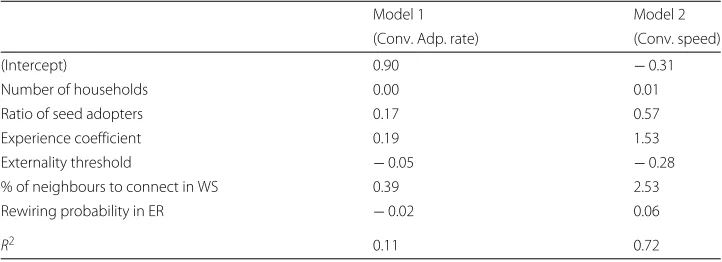
of initial seed adopters, and the network characteristics) are employed. They are regressed against two response variables, the convergence adoption rate (model 1 in Table2) and the convergence speed (model 2 in Table2). The results show that both the experience effect and the externality effect are significantly correlated to these response variables with expected signs, suggesting that they both have significant impacts on diffusion7.
Network characteristics and peer effects
The diffusion of innovation is usually influenced by the structure of the network in which it takes place (Peres2014). We measure the structure of the networks used in our simulation using three metrics: average degree, clustering coefficient, and average path length. They are chosen because they reflect different aspects of the characteristics of a network: average degree indicates how connected the network is (i.e. the connectivity); clustering coefficient measures how clustered the nodes are and thus how well the infor-mation can transmit (i.e. the transitivity); and average path length represents how many intermediaries it needs for one node to reach another (i.e. the network distance).
To estimate the impact of these network topological metrics on the corresponding net-work layer, we introduce a interaction term into the regressions. The interaction term is generated by multiplying the experience coefficient or the externality threshold by each of the topological metrics on the corresponding network layer. The interaction effect can be interpreted from the regression coefficients of the interaction terms. As different topolog-ical metrics and the network generation parameters are highly correlated with each other (as presented in Table3for the scenario of positive externality effect, and those for the sce-nario of negative externality effect are similar), we run the regression for each topological metric separately (and drop the network generation parameters served as controls).
The resultant regression equation is the following:
y=β0+β1θ+β2δ+β3Net_char+β4Inter_term+β5s+ (2)
whereNet_chardenotes the vector of topological metrics on the kinship network and the neighbourhood network, respectively, andInter_termdenotes the vector of interaction terms. The interaction term is the product of a topological metric and the corresponding peer effect indicator occurring on the network. For instance, the interaction term of aver-age degree and peer effect on kinship network is(average degree of kinship network)×θ. One topological metric is run for each regression. As there are two scenarios, the regression runs in a total of 6 times (3×2).
Table 2Regressions of convergence adoption rate and convergence speed (negative externality
effect)
Model 1 Model 2
(Conv. Adp. rate) (Conv. speed)
(Intercept) 0.90 −0.31
Number of households 0.00 0.01
Ratio of seed adopters 0.17 0.57
Experience coefficient 0.19 1.53
Externality threshold −0.05 −0.28
% of neighbours to connect in WS 0.39 2.53
Rewiring probability in ER −0.02 0.06
Table 3Correlations between network characteristics (positive externality effect)
(Var 1) (Var 2) (Var 3) (Var 4) (Var 5) (Var 6) (Var 7) (Var 8)
WSf 1
Avg. Dg. of Kin. 0.65 1
Clu. Coef. of Kin. 0.83 0.69 1
APL of Kin. −0.73 −0.64 −0.86 1
ERprob 1
Avg. Dg. of Nei. 0.49 1
Clu. Coef. of Nei. 0.71 0.43 1
APL of Nei. −0.65 −0.76 −0.58 1
Scenario of positive externality effect
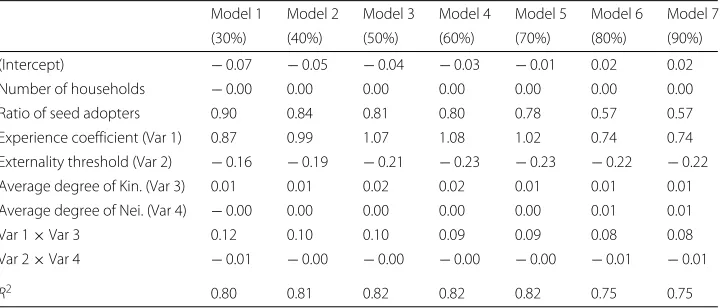
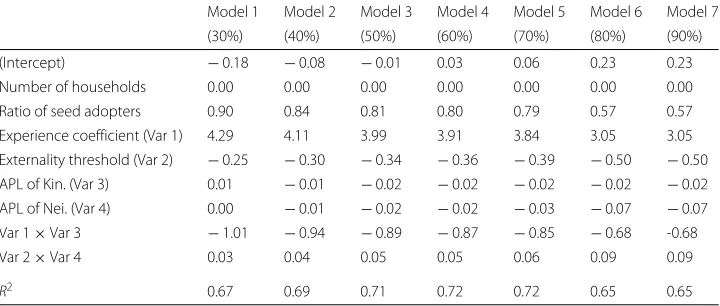
As discussed previously, we use the diffusion speed as the response variable in the regres-sions. Results for average degree, clustering coefficient, and average path length are displayed in Tables4,5, and6, respectively.
First, the coefficients of all the interaction terms with the three metrics are signifi-cant, indicating that interaction effects do exist. Specifically, average degree significantly enhances both the experience effect and the externality effect, that is, with the increase of average degree, their impacts on diffusion speed grow. As the system proceeds to a higher diffusion level, the interaction effect on the experience effect shrinks, while that on the externality effect grows. The degree of clustering also strengthens these two effects, although the influence is not significant for the externality effect when the dif-fusion is at the early stage. As the overall adoption rate grows, it turns significant and becomes stronger, while the influence for the experience effect falls gradually. The dis-tance between households also significantly affects the performance of the two effects, but in an opposite direction (i.e. a lower distance corresponds to a higher experience effect or externality effect and vice versa). Comparing the three metrics, the clustering coeffi-cient produces a much higher impact (while it is significant) than the others, whereas the average degree and the average path length have a weak influence. In other words, the transitivity of the network matters more than the connectivity and the distance in shaping peer effects.
Table 4Regressions of adoption speed on average degree (positive externality effect)
Model 1 Model 2 Model 3 Model 4 Model 5 Model 6 Model 7
(30%) (40%) (50%) (60%) (70%) (80%) (90%)
(Intercept) −0.07 −0.05 −0.04 −0.03 −0.01 0.02 0.02
Number of households −0.00 0.00 0.00 0.00 0.00 0.00 0.00
Ratio of seed adopters 0.90 0.84 0.81 0.80 0.78 0.57 0.57
Experience coefficient (Var 1) 0.87 0.99 1.07 1.08 1.02 0.74 0.74 Externality threshold (Var 2) −0.16 −0.19 −0.21 −0.23 −0.23 −0.22 −0.22 Average degree of Kin. (Var 3) 0.01 0.01 0.02 0.02 0.01 0.01 0.01 Average degree of Nei. (Var 4) −0.00 0.00 0.00 0.00 0.00 0.01 0.01
Var 1×Var 3 0.12 0.10 0.10 0.09 0.09 0.08 0.08
Var 2×Var 4 −0.01 −0.00 −0.00 −0.00 −0.00 −0.01 −0.01
Table 5Regressions of adoption speed on clustering coefficient (positive externality effect) Model 1 Model 2 Model 3 Model 4 Model 5 Model 6 Model 7
(30%) (40%) (50%) (60%) (70%) (80%) (90%)
(Intercept) −0.17 −0.17 −0.17 −0.16 −0.15 −0.08 −0.08
Number of households 0.00 0.00 0.00 0.00 0.00 0.00 0.00
Ratio of seed adopters 0.91 0.84 0.81 0.80 0.78 0.57 0.57
Experience coefficient (Var 1) 0.21 0.35 0.43 0.45 0.41 0.31 0.31
Externality threshold (Var 2) −0.18 −0.20 −0.21 −0.22 −0.23 −0.25 −0.25 Clustering coefficient of Kin. (Var 3) 0.12 0.22 0.29 0.31 0.30 0.24 0.24 Clustering coefficient of Nei. (Var 4) −0.10 −0.03 0.04 0.07 0.12 0.22 0.22
Var 1×Var 3 7.06 6.47 6.10 5.9 5.80 4.77 4.77
Var 2×Var 4 −0.00 −0.08 −0.16 −0.20 −0.24 −0.25 −0.25
R2 0.70 0.72 0.74 0.75 0.75 0.68 0.68
Scenario of negative externality effect
In the scenario of negative externality effect, the converged adoption rate and the speed of convergence are used as response variables to run regression using the Eq. (2). Results are presented in Table7 (average degree), Table8 (clustering coefficient), and Table9 (average path length).
We also found that interaction effects with all the three metrics are significant. Specifi-cally, on the kinship network, average degree undermines the impact of experience effect on the converged adoption rate, but enhances its impact on convergence speed. On the neighbourhood network, the average degree enlarges the impact of externality effect on converged adoption rate, but dilutes its impact on convergence speed. Interaction effects with clustering and distance between households are more prominent. On the kinship network, the interaction effect largely reduces the impact of experience effect on the converged adoption rate and raises it on diffusion speed, thus contributing to a reduced converged adoption rate and helping speed up the convergence of the system. On the neighbourhood network, interaction effect amplifies the impact of externality effect on converged adoption rate and largely reduces that on diffusion speed, which leads the adoption rate to converge to a lower value but at a higher speed. The interaction effect with average path length follows the same pattern but in an opposite direction. The shorter path length is generally associated with lower converged adoption rate and higher
Table 6Regressions of adoption speed on average path length (positive externality effect)
Model 1 Model 2 Model 3 Model 4 Model 5 Model 6 Model 7
(30%) (40%) (50%) (60%) (70%) (80%) (90%)
(Intercept) −0.18 −0.08 −0.01 0.03 0.06 0.23 0.23
Number of households 0.00 0.00 0.00 0.00 0.00 0.00 0.00
Ratio of seed adopters 0.90 0.84 0.81 0.80 0.79 0.57 0.57
Experience coefficient (Var 1) 4.29 4.11 3.99 3.91 3.84 3.05 3.05 Externality threshold (Var 2) −0.25 −0.30 −0.34 −0.36 −0.39 −0.50 −0.50 APL of Kin. (Var 3) 0.01 −0.01 −0.02 −0.02 −0.02 −0.02 −0.02 APL of Nei. (Var 4) 0.00 −0.01 −0.02 −0.02 −0.03 −0.07 −0.07
Var 1×Var 3 −1.01 −0.94 −0.89 −0.87 −0.85 −0.68 -0.68
Var 2×Var 4 0.03 0.04 0.05 0.05 0.06 0.09 0.09
Table 7Regressions of convergence adoption rate and convergence speed on average degree (negative externality effect)
Model 1 Model 2
(Conv. Adp. rate) (Conv. speed)
(Intercept) 0.85 0.08
Number of households 0.00 0.00
Ratio of seed adopters 0.50 0.34
Experience coefficient (Var 1) 0.50 0.90
Externality threshold (Var 2) −0.05 −0.28
Average degree of Kin. (Var 3) 0.01 0.02
Average degree of Nei. (Var 4) 0.01 −0.01
Var 1×Var 3 −0.03 0.02
Var 2×Var 4 −0.04 0.09
R2 0.11 0.74
diffusion speed. Overall, these results suggest that stronger connectivity, higher transitiv-ity, or shorter distance shape the peer effects in a way that the system converges at a lower adoption rate and more speedily.
Conclusions
This study distinguishes three basic underlying mechanisms through which peer effects in the diffusion of innovation occur: information transmission, experience sharing, and externalities. Correspondingly, peer effects are classified as information effect, experience effect, and externality effect. In the case of diffusion of a rural innovation, we found that each of the three effects played a dominant role at the early, intermediate, and late stages, respectively. Peer effects can be better understood by investigating the specific effects and their roles at different stages of the dynamic diffusion process.
By referring to the diffusion process of a rural innovation in the real world, we devel-oped an agent-based model that incorporates experience and externality effects on a multiplex network. The model allows us to estimate the influence of each specific effect and investigate the interplay of positive and negative effect. In particular, we examined how experience effect and externality effect shape the diffusion jointly. By conducting experiments using the model, we obtained several findings. First, our model successfully replicates the widely acknowledged S-shaped diffusion curve in the scenario of positive
Table 8Regressions of convergence adoption rate and convergence speed on clustering coefficient
(negative externality effect)
Model 1 Model 2
(Conv. Adp. rate) (Conv. speed)
(Intercept) 0.78 −0.18
Number of households 0.00 0.00
Ratio of seed adopters 1.02 0.24
Experience coefficient (Var 1) 0.20 1.43
Externality threshold (Var 2) −0.05 −0.28
Clustering coefficient of Kin. (Var 3) 0.66 0.79
Clustering coefficient of Nei. (Var 4) 0.00 −0.08
Var 1×Var 3 −3.29 1.29
Var 2×Var 4 −0.10 0.72
Table 9Regressions of convergence adoption rate and convergence speed on average path length (negative externality effect)
Model 1 Model 2
(Conv. Adp. rate) (Conv. speed)
(Intercept) 1.28 0.04
Number of households 0.00 0.00
Ratio of seed adopters −0.98 0.97
Experience coefficient (Var 1) −0.44 2.87
Externality threshold (Var 2) −0.05 −0.28
APL. of Kin. (Var 3) −0.10 −0.10
APL. of Nei. (Var 4) −0.04 0.08
Var 1×Var 3 0.52 −0.18
Var 2×Var 4 0.28 −0.59
R2 0.22 0.63
externality effect. This finding is consistent with the pattern argued in the theory of diffu-sion of innovations (Rogers2003). However, when there is a negative effect in the system (the negative externality effect, in our case), the diffusion will vibrate around a middle-level rate between 0 and 100%. Accordingly, the diffusion curve will be a fluctuating one. This curve demonstrates the trajectory of the interplay of opposite effects. In reality, many innovations do not end up being adopted by the whole population of potential adopters. This could be accounted for by the existence of negative effects. However, the role of negative effects is usually left undiscussed in literature.
Second, our simulation results show that experience effect has a relatively higher influ-ence on diffusion at the earlier stage, whereas externality effect dominates at the later stage in the scenario of positive externality effect. Along with the findings regarding the information effect we learnt in the real-world case, it is likely to be true that each of the three effects plays a dominant role at a different stage of a complete diffusion pro-cess, one after another. This pattern is not found in the scenario of negative externality effect, although both influences are still significant. This is perhaps due to the fact that the opposite effects can offset each other in the diffusion process, which leaves the feature associated with the strength of the effects inconspicuous. In general, the result suggests that a diffusion process should be examined from a dynamic perspective, and the influ-ence of each specific peer effect needs to be estimated by the period in the diffusion process. Although a couple of attempts to distinguishing mechanisms underlying peer effects can be found (Banerjee et al.2013; Bursztyn et al.2014), none of them examines the mechanisms at different periods of the diffusion process.
could reach. These together suggest that each specific peer effect is reshaped by the struc-ture of the network where it occurs. This could further influence the effectiveness of the diffusion.
Overall, our study shows that it needs to delve into the specific underlying causal mech-anisms when we study peer effects. The influence of each underlying mechanism varies by the stages of the diffusion process and by the topological characteristics of the underly-ing network. In addition, the negative effect, if exists, should be taken into account. It can substantially modify how the diffusion proceeds and its outcome. Our study also suggests that it could be an effective approach to investigate specific peer effects by conducting simulation on social networks.
Endnotes
1Refer to Xiong et al. (2016) for a detailed survey.
2This is what is found in the empirical study. Refer to Xiong and Payne (2017) for a
detailed discussion.
3The density at the 20th round is as high as over 15% because it also contains the cases
that take more than 20 rounds to converge and those do not converges to full adoption.
4To have a better visualisation, we average the adoption rates over repetitive runs. The
speed at which the adoption rate grows varies significantly over different settings, so a fat midsection of the integrated graph is observed when plotting all the curves in one frame of axes.
5To measure the number of rounds over all runs with a unified standard, we split the
values of adoption rate into 10 diffusion bins. The values higher than 10% and less than 20% are in the 10% bin, those higher than 20% and less than 30% are in the 20% bin, and so on, up to the 90% bin. For instance, it takes 4 rounds for the diffusion to first achieve the diffusion level of, say, 58%. The actual adoption rate at the 4th round is 58%. Suppose the seed ratio is 10%, then the growth rate for the system to achieve 50% diffu-sion in this setting is(58%−10%)/4 = 12%. There are cases that the diffusion speed is the same for several diffusion bins. For instance, suppose the adoption rate jumps from 34 to 66% at the fourth round, and the seed ratio is 10%, the diffusion speed for the 30% bin is thus(34%−10%)/3 = 8%, and that for the 40%, 50%, and 60% bins are all (66%−10%)/4=14%.
6All effect sizes reported in the table were significantly larger than the minimally
mean-ingful effect of 0.1 standard deviations. This is the same for all the following tables that report regression results.
7The quality of fit for the models using convergence adoption rate as the response
vari-able (model 1 in Tvari-able2, 7,8, and9) is low. Other factors or non-linear structures could provide a better model fit. However, in here, we have focused on specific models, and the exploration of the best fitted models is beyond the scope of the study.
Acknowledgements
This work was supported by the key project of scientific research sponsorship programme of Hubei Province, China: Governance on Farmers’ Pesticide Use Behaviour: A Social Network Analysis Perspective (ID: D20151706).
Authors’ contributions
HX led the writing of the manuscript with all other authors contributing to ideas and writing. All authors read and approved the final manuscript.
Competing interests
Publisher’s Note
Springer Nature remains neutral with regard to jurisdictional claims in published maps and institutional affiliations.
Author details
1Agricultural Economics and Policy Group, ETH Zurich, 8092 Zurich, Switzerland.2School of Economics and
Management, Wuhan Polytechnic University, Wuhan, 430048 China.3Center for Data Science, RTI International, Durham,
27709-2194 USA.
Received: 14 September 2017 Accepted: 21 February 2018
References
Alcalde, P (2013).A behavioral model of non-linear peer effects in cognitive achievement. PhD thesis: University of Pennsylvania.http://repository.upenn.edu/dissertations/AAI3565014. Accessed 24 Feb 2018.
Arenas, A, BarthelemyY, M, Gleeson, JP, Moreno, Y, Porter, MA (2014). Multilayer networks.Journal of Complex Networks, 2, 203–271.
Bandiera, O, & Rasul, I (2006). Social networks and technology adoption in northern Mozambique.The Economic Journal, 116(514), 869–902.
Banerjee, A, Chandrasekhar, AG, Duflo, E, Jackson, MO (2013). The diffusion of microfinance.Science,341(6144), 1236498-1–1236498-7.
Bramoulle, Y, Djebbari, H, Fortin, B (2009). Identification of peer effects through social networks.Journal of econometrics, 150(1), 41–55.
Bursztyn, L, Ederer, F, Ferman, B, Yuchtman, N (2014). Understanding mechanisms underlying peer effects: evidence from a field experiment on financial decisions.Econometrica,82(4), 1273–1301.
Carrell, SE, Sacerdote, BI, West, JE (2013). From natural variation to optimal policy? The Lucas critique meets peer effects. Econometrica,81(3), 855–882.
Conley, TG, & Udry, CR (2010). Learning about a new technology: Pineapple in Ghana.The American Economic Review, 100(1), 35–69.
Dahl, GB, Lken, KV, Mogstad, M (2014). Peer effects in program participation.American Economic Review,104(7), 2049–74. Deffuant, G, Huet, S, Amblard, F (2005). An individual-based model of innovation diffusion mixing social value and
individual benefit.American Journal of Sociology,110(4), 1041–1069.
Erd ˝os, P, & Rényi, A (1959). On random graphs.Publicationes Mathematicae (Debrecen),6, 290–297.
Goldenberg, J, Libai, B, Muller, E (2001). Talk of the network: a complex systems look at the underlying process of word-of-mouth.Marketing Letters,12(3), 211–223.
Goldsmith-Pinkham, P, & Imbens, GW (2013). Social networks and the identification of peer effects.Journal of Business & Economic Statistics,31(3), 253–264.
Goolsbee, A, & Klenow, PJ (1999). Evidence on learning and network externalities in the diffusion of home computers. National bureau of economic research. Technical report.
Granovetter, M (1978). Threshold models of collective behavior.American Journal of Sociology,83(6), 1420.
Guryan, J, Jacob, B, Klopfer, E, Groff, J (2008). Using technology to explore social networks and mechanisms underlying peer effects in classrooms.Developmental Psychology,44(2), 355.
Heard, D, Bobashev, GV, Morris, RJ (2014). Reducing the complexity of an agent-based local heroin market model.PloS ONE,9(7), 102263.
Janssen, MA, & Jager, W (2003). Simulating market dynamics: interactions between consumer psychology and social networks.Artificial Life,9(4), 343–356.
Kiesling, E, Günther, M, Stummer, C, Wakolbinger, LM (2012). Agent-based simulation of innovation diffusion: a review. Central European Journal of Operations Research,20(2), 183–230.
Kremer, M, & Levy, D (2008). Peer effects and alcohol use among college students.The Journal of Economic Perspectives, 22(3), 189–189.
Laciana, CE, Rovere, SL, Podest, GP (2013). Exploring associations between micro-level models of innovation diffusion and emerging macro-level adoption patterns.Physica A: Statistical Mechanics and its Applications,392(8), 1873–1884. Luan, YJ, & Neslin, S (2009). The development and impact of consumer word of mouth in new product diffusion. Tuck
School of Business Working Paper No. 2009-65.https://doi.org/10.2139/ssrn.1462336. Accessed 24 Feb 2018. Munshi, K (2004). Social learning in a heterogeneous population: technology diffusion in the Indian Green Revolution.
Journal of Development Economics,73(1), 185–213.
Peres, R (2014). The impact of network characteristics on the diffusion of innovations.Physica A: Statistical Mechanics and its Applications,402(0), 330–343.
Rogers, EM (2003).Diffusion of innovations, 5th edn. New York: Free Press.
Singh, P, Sreenivasan, S, Szymanski, BK, Korniss, G (2013). Threshold-limited spreading in social networks with multiple initiators.Science Report,3(2330).
Sorensen, AT (2006). Social learning and health plan choice.RAND Journal of Economics,37(4), 929–945. Watts, DJ, & Strogatz, SH (1998). Nature,393(6684), 440–442.
Wellek, S (2010).Testing statistical hypotheses of equivalence and noninferiority, 2nd edn. New York: CRC Press. Xiong, H, Paynea, D, Kinsellac, S (2016). Peer effects in the diffusion of innovations: theory and simulation.Journal of
Behavioral and Experimental Economics,63, 1–1713.