Theoretical Calculations for the Acidity of
Cyanopolyynes HC
2n+1
N (n = 0–5) in Gas and
Aqueous Phases Using Ab initio Methods
Hassan H. Abdallah
Department of Chemistry, College of Education, Salahaddin University-Erbil, Kurdistan Region - F.R. Iraq
Abstract—Cyanopolyynes have been found in the interstellar medium, cold dust cloud Taurus Molecular Cloud-1, and the Titan’s atmosphere. Theoretical calculations are carried out to predict gas and aqueous phase acidities of a series of cyanopolyynes acids. Two levels of theory were used in this study, with the combination of density functional theory, and Møller–Plesset perturbation (MP2) theory, MP2 methods with two types of basis set, namely, Pople’s 6–311++g (d, p) basis set and Dunning’s aug-cc-pVTZ basis set. The calculations of these molecules reveal that pKa values varying from 12.25 to 17.25 and indicate that the acidity of these molecules in aqueous phase increases whereas the acidity in gas phase decreases with an increasing chain length of these acids.
Index Terms—Ab initio, Acidity, Cyanopolyynes, Density functional theory, Møller–Plesset perturbation.
I. Introduction
Cyanopolyynes with the general formula, HC2n+1N (n = 0–5), have been detected in the interstellar medium. The larger HC11N was observed in cold dust cloud Taurus molecular cloud (TMC)-1 (Bell et al., 1997). Cyanopolyynes are also discovered in the Titan’s atmosphere, which is rich in elements such as carbon, hydrogen, and nitrogen (Kunde et al., 1981). The origin of these large carbon chains with alternating single and triple carbon-carbon (C-C) bonds is still unclear but ion-molecule reactions especially those involving C+ are presumed to be the main source. However, recent studies indicate that neutral-neutral reactions may also lead to such carbon chains (McCarthy and Thaddeus, 2001; Mendoza et al., 2018; and Skomorowski et al., 2018).
The detection of long linear carbon-chain molecules in interstellar and circumstellar clouds has come as a surprise. Ab initio calculations show that long linear species
are usually more energetic than their ring or ring-chain counterparts and were observed to be less stable in the earthbound environment. In contrast, many linear chains such as the cyanopolyynes HC2n+1N were found to be widespread and abundant in the cold circumstellar and interstellar clouds (Kunde et al., 1981 and McCarthy and Thaddeus, 2001). The abundance of these long chains and the scarcity of their ring counterparts in the cold ultraviolet-shielded clouds yield keys to the formation of large molecules in interstellar space and can potentially help us in understanding the origin of diffuse interstellar bands (Botschwina, 2003).
Carbon chain molecules can be classified into several families, depending on a few factors such as the structure of their linear backbone (acetylenic backbone with alternating single and triple C-C bonds, or cumulenic backbone with double bonds), their electronic ground state (open shell or closed shell) and the groups at the end of the chain (H, CN, CH2, or CH3). The two most widespread families are the polyynes (HC2n+1N and CH3C2n+1H) and the polyacetylene radicals (CnH). The most abundant is presumably the family of polyacetylenes (HC2nH), which unfortunately are non-polar and hence not detectable at radio wavelengths. Note, however, that these species have been detected in mid-infrared spectrum with the infrared space observatory (Botschwina and Horn, 1997).
It has been proposed that the polyynes and carbon-chain radicals formed directly in the gas phase through reactions of CCH with polyynes, polyacetylenes, and/or polyacetylene ions (for example, HC2n+1N + CCH → HC2n+3N + H) (Botschwina et al., 1997). Such reactions tend to insert two triply bonded carbon atoms into the carbon backbone, uncoupling the formation of chains with an odd number of C-atoms from those with an even number, which could explain the alternating high and low abundances observed as the length of the C backbone increases. For example, in the molecular shell around IRC+10216 and the dark cloud TMC-1, the two main astronomical sources of carbon chain molecules, the abundance of the CnH radicals with an even number of C-atoms is about 30 times larger than that of radicals of similar size with an odd number of carbon atoms. In contrast, the decrease in abundance between successive species within the even (or odd) number of C-atoms families,
ARO-The Scientific Journal of Koya University
Volume VII, No.1(2019), Article ID: ARO.10484, 7 pages DOI: 10.14500/aro.10484
Received 24 December 2018; Accepted 17 April 2019 Regular research paper: Published 01 May 2019
Corresponding author’s email: [email protected]
CnH/Cn+2H, is found to be only 4–6 (Botschwina, 2003 and McCarthy and Thaddeus, 2001).
Electronic structure calculations in cyanopolyynes were also reported and guided the discovery of some cyanopolyynes in the interstellar medium (McCarthy and Thaddeus, 2001). The HC9N molecule was already investigated with the Coupled Cluster Theory, at the CCSD (T)/cc-pVTZ level of theory (Botschwina et al., 1997), and the results were employed to determine cyanopolyyne column densities in TMC-1 (Bell et al., 1997). This CCSD (T)/cc-pVTZ study presents the equilibrium geometry and the dipole moment for HC9N (Botschwina et al., 1997). Another study compares dipole moments obtained for small cyanopolyynes with perturbation theory, Møller–Plesset perturbation (MP2), and density functional theory (DFT), through the BP86 functional, using a small basis set, 6–31G*. The results showed that MP2 yields more accurate dipole moment values than BP86 (Moliner et al., 1996). More recent articles also deal with the electronic structure of some cyanopolyynes using DFT and CCSD (T) (Botschwina, 2003, Qi et al., 2009, Woon and Herbst, 2009, and Scemama et al., 2002). Other works deal only with the stretching modes of a few cyanopolyynes such as HCN, HC3N (Botschwina et al., 1995), HC5N (Botschwina et al., 1997), and HC7N (Botschwina et al., 1997) using the CCSD (T) method with triple-zeta basis sets or some combined treatment.
Moreover, DFT calculations also indicated that the alternation between C-C bonds that maintain characteristics of single and triple bonds persists in polyynes as large as HC30H (Scemama et al., 2002). Interestingly, the difference between the bond lengths for either single and triple C-C bonds near the center of polyynes (HC2nH) and cyanopolyynes are predicted as being equal to only 0.1 Å. Another interesting characteristic of these molecules has large molecular dipole moments that facilitate their detection (Arnau et al., 1990). Unfortunately, the experimental values of this quantity are only limited to the smallest cyanopolyynes.
The deprotonation energies of organic acids and the proton affinities of the corresponding conjugate bases are widely used for the prediction of gas phase and aqueous phase Bronsted acidities (Smith and March, 2007, Dewar and Dieter, 1986, Siggel et al., 1988, Kass, 1990, Burk and Koppel, 1993, Koppel et al., 1994, and Burk et al., 1996). Strong acids have small values of deprotonation energy (that is, the release of the proton is easier) whereas strong bases have large values of proton affinity (that is, the binding to the proton is stronger). Several works on the prediction of the acidity of organic and inorganic acids can be found in literature. For instance, Smith and Radom (Smith and Radom, 1995 and Smith and Radom 1995) have shown that the G2 and G2 (MP2) methods provide excellent results for both deprotonation enthalpies and proton affinities of small molecules.
Catalan and Palomar (Catalan and Palomar, 1998) have investigated gas-phase acidities of a number of species and have shown that the calculations at B3LYP/6–311+G (d) and 6–311+G (3df, 3pd) level of theory correlate well with the experimental data. Good correlations have been obtained
between experimental pKa values of a wide range of organic Bronsted acids and their calculated gas-phase deprotonation enthalpies (Choho et al., 1996). Correlations between theoretical results and gas-phase acid-base equilibrium constants of organic compounds have been reported for amines, alcohols, and thiols (Yang and Mortier, 1986, Contreras et al., 1999, and Pérez et al., 2000). An excellent correlation was obtained between the aqueous-phase acidity calculated with the HF/3–21G (d) method and experimental pKa values for a series of nitrogen bases (D’Souza et al., 2000).
Recently, a reasonable correlation was obtained between the deprotonation energies of the compounds calculated at the HF/3–21G and B3LYP/6–31G (d) levels of theory and their aqueous pKa values (Rezende, 2001 and Rezende 2001). The ability to predict acidity using a coherent, well-defined theoretical approach, without external approximation or fitting to experimental data would be very useful to chemists. Due to the rapid development of computational chemistry, the acidity of small molecules in the gas phase can be calculated with equivalent or greater accuracy than can be obtained experimentally. However, the current situation is less satisfactory in solution, mostly due to the difficulty of calculating solvation energies with adequate accuracy.
In this study, the acidy of six cyanopolyynes acids is predicted in the gas and aqueous phases using DFT and MP2 methods with two basis sets, 6–311++g (d, p) and aug-cc-pVTZ. The charge distribution and the effect of the length of the cyanopolyynes on the acidy of these compounds are elucidated.
II. Computational Methods
A. Gas-phase Acidity Calculations
Calculations are performed with the Gaussian 09 W software package (Frisch et al., 2009). The geometries of the neutral and deprotonated species are fully optimized using DFT and MP2 theory, MP2 level of theory at the 6–311++G (d, p) and aug-cc-pVTZ basis sets. Frequency calculations are performed at the same level of theory to characterize the stationary points obtained. The gas-phase Gibbs free energy change (G
gas) of Scheme 1 is calculated using Eq. (1). For G
gas (H+) the experimental value of −6.28 kcal/mol is used
(Liptak et al., 2002).
AH(gas)A H
gas gas
( ) ( )
G G
A G
H G AHgas gas gas gas( ) (1)
B. Aqueous-phase Acidity Calculations
radii when constructing the solvent cavity for the calculation of the Gibbs free energy of solvation. A common practice to calculate the aqueous Gibbs free-energy change of an acid dissociation (G
aq), see Eq. (2) is by combining the Ggas
of the deprotonation process with the change in Gibbs free energy of solvation G
solv using the thermodynamic cycle
of Scheme 1 and Eq. (3). ForG
solv (H+) the experimental
value of −264.61 kcal/mol is used (Liptak et al., 2002). The aqueous pKa is calculated according to Eq. (5). All the calculations and experimental data reported in this paper are at 298.15 K.
Gaq Gaq
A Gaq
H Gaq(AH) (2)G G G
aq gas solv (3)
G G A G H G AH
G A G H
aq gas gas gas
solv solv
( ) ( ) ( )
( ) ( )) Gsolv(AH) (4)
pKa
G RT
aq
ln10 (5)
Charif and his group (Charif et al., 2007) have found a correlation between these two Gibbs free energy changes with
R2 = 0.947 that might be very helpful to be used as a scale factor to get values closer to the experimental results. They found a correlation between the experimental and calculated aqueous pKa values. The regression equation with the
corresponding standard deviation and correlation coefficient
(R2) values is given in Eq. (6).
pKa = 0.8755 pKa (calc.)−1.7563
(R2 = 0.934, SD = 4.80) (6)
III. Results and Discussion
A. Optimized Geometry
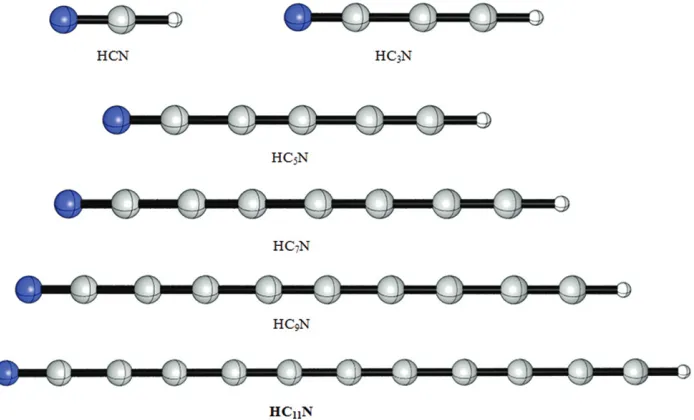
The molecules under study were optimized to obtain their ground state structures, with the levels of theory aforementioned in the methods of calculations. Fig. 1 shows the optimized geometry of the studied cyanopolyynes. The optimized structures were at the ground state with no imaginary frequencies. The bond lengths of the studied molecules are listed in Table I.
The vibrational modes of the optimized structures were carefully examined. The most important vibrational mode belongs to the CH stretching. The frequencies of the stretching vibration are listed in Table II. In addition, the values of the dipole moment of these compounds are also listed. It is clear that the value of the stretching frequency is increasing from HCN to the HC5N, whereas for the molecules beyond that the value is constant. This indicates that the strength of the CH bond increases with the length of the chain, resulting in difficulty for the proton to dissociate as the chain becomes longer until it becomes constant at a certain length. On the other hand, the dipole moments of the molecules show a different trend whereby the dipole moment is increasing as the length of the molecule increases.
Scheme 1. Gsolv° (X) represents the Gibbs free energy of solvation of species X.
A. Gas-phase Acidities
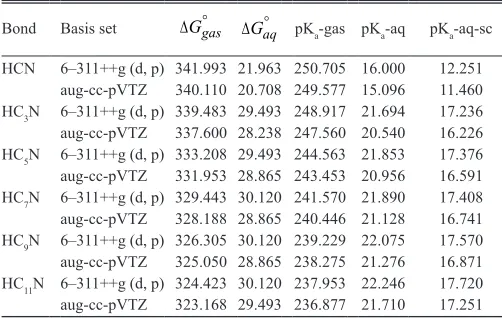
The calculated gas-phase G
gasof the acid dissociation
and aqueous pKa values (relative to water) at 298.15 K is reported in Tables III and IV. Besides that, the last column is for the scaled values which were calculated according to the Equation (6).
A satisfactory linear correlation is obtained showing that the gas-phase Gibbs free energy change of deprotonation generally increases when the acidity of these compounds decreases. It should be noted that very accurate aqueous pKa values (relative to water) can only be obtained for acids weaker than the hydronium ion (pKa = −1.74) and stronger than water
(pKa = 15.74) (Bell et al., 1997). It is well known that in the gas phase, acidity orders may be much different than in aqueous solution for certain families of compounds. Simple alcohols are an example of this: Whereas tertiary alcohols are more acidic than secondary and primary alcohols in the gas phase, in aqueous solution the acidity order is reversed because the much bulkier tertiary anion is poorly solvated. A similar pattern is found in simple aliphatic carboxylic acids and when analyzing the basicity order of amines (Bell et al., 1997).
From the results we have obtained, we can infer that the aqueous phase acidity order of the family of cyanopolyynes acids is very similar to that in the gas phase. Hence, it might be possible to use gas-phase calculations to predict the aqueous pKa values of carbon acids.
As shown in Fig. 2, the pKa values of the studied cyanopolyynes are generally decreasing with the increase of the chain length in the gas phase in parallel behavior with the values of the G
gas. Fig. 2 shows that the calculated pKa values using DFT method are lower than the MP2 method. The general behavior of the plot may be attributed to the TABLE I
Bond Lengths in a of the Optimized Structures of the Studied Cyanopolyynes in the Gas-Phase and the Values Between Brackets are for the Aqueous Phase
Bond HCN HC3N HC5N HC7N HC9N HC11N
H–C 1.078 (1.081) 1.076 (1.078) 1.066 (1.068) 1.066 (1.068) 1.066 (1.068) 1.066 (1.068) C1≡C2 1.236 (1.236) 1.226 (1.227) 1.228 (1.228) 1.229 (1.229) 1.229 (1.229)
C2–C3 1.386 (1.385) 1.363 (1.363) 1.360 (1.360) 1.358 (1.358) 1.358 (1.358)
C3≡C4 1.232 (1.232) 1.238 (1.238) 1.241 (1.241) 1.242 (1.242)
C4–C5 1.368 (1.367) 1.352 (1.352) 1.347 (1.347) 1.344 (1.344)
C5≡C6 1.236 (1.236) 1.243 (1.243) 1.247 (1.246)
C6–C7 1.365 (1.364) 1.348 (1.347) 1.341 (1.341)
C8≡C9 1.238 (1.238) 1.246 (1.246)
C9–C10 1.364 (1.363) 1.346 (1.345)
C10≡C11 1.239 (1.239)
C11–C12 1.364 (1.362)
C≡N 1.183 (1.181) 1.193 (1.192) 1.184 (1.183) 1.186 (1.184) 1.186 (1.185) 1.186 (1.185)
TABLE II
Dipole Moment (μ) and the Stretching Frequencies in the Gas and
Aqueous Phases
Bond HCN HC3N HC5N HC7N HC9N HC11N
μ (gas) (debye) 3.333 4.273 5.021 5.657 6.186 6.636 μ (aq) (debye) 4.103 5.560 6.599 7.395 7.978 8.412 C-H str. (gas) (cm−1) 3452.76 3472.67 3487.72 3486.33 3486.02 3486.25
C-H str. (aq) (cm−1) 3428.35 3450.98 3467.33 3466.35 3466.01 3466.14
TABLE III
Density Functional Theory results of the Gibbs Free Energy in (kcal/mol), PKa Values in the Gas and Aqueous Phases and the Scaled
Values of PKa in the Aqueous Phase
Bond Basis set Ggas Gaq pKa-gas pKa-aq pKa-aq-sc
HCN 6–311++g (d, p) 341.993 21.963 250.705 16.000 12.251 aug-cc-pVTZ 340.110 20.708 249.577 15.096 11.460 HC3N 6–311++g (d, p) 339.483 29.493 248.917 21.694 17.236 aug-cc-pVTZ 337.600 28.238 247.560 20.540 16.226 HC5N 6–311++g (d, p) 333.208 29.493 244.563 21.853 17.376
aug-cc-pVTZ 331.953 28.865 243.453 20.956 16.591 HC7N 6–311++g (d, p) 329.443 30.120 241.570 21.890 17.408
aug-cc-pVTZ 328.188 28.865 240.446 21.128 16.741 HC9N 6–311++g (d, p) 326.305 30.120 239.229 22.075 17.570
aug-cc-pVTZ 325.050 28.865 238.275 21.276 16.871 HC11N 6–311++g (d, p) 324.423 30.120 237.953 22.246 17.720 aug-cc-pVTZ 323.168 29.493 236.877 21.710 17.251
effect of the solvent molecules on the acidity of these compounds. In conclusion, in the gas phase, the acidity of these compounds increases with increasing chain length; however, this may be attributed to the method and the type of the basis set used in the calculations.
B. Aqueous-phase Acidities
The calculated aqueous phase G
aq of the acid dissociation
and pKa values of the compounds under study (using Eq. 4 and 5) at 298.15 K are reported in Tables III and IV using DFT and MP2 methods, respectively. According to both
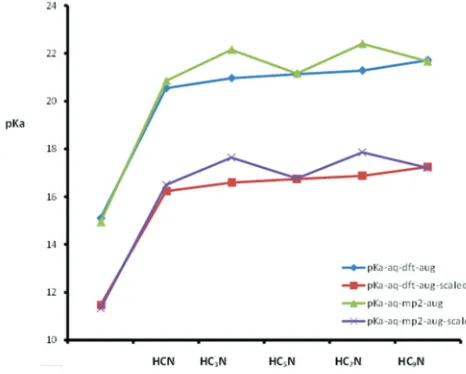
Fig. 3. The correlation between the pKa values and chain length of the cyanopolyynes in the aqueous phase.
Fig. 4: The charge distribution on atoms in the gas and aqueous phases as found in the natural bond orbital analysis. TABLE IV
Møller–Plesset Perturbation Results of the Gibbs Free Energy in (kcal/mol), pKa Values in Gas and Aqueous Phases and the Scaled
Values of PKa in the Aqueous Phase.
Bond Basis set Ggas Gaq pKa-gas pKa-aq pKa-aq-sc.
HCN 6–311++g (d, p) 343.875 23.845 252.213 17.409 13.485 aug-cc-pVTZ 340.110 20.080 249.457 14.935 11.319 HC3N 6–311++g (d, p) 342.620 32.631 251.424 23.704 18.997
aug-cc-pVTZ 338.228 28.238 248.235 20.844 16.493 HC5N 6–311++g (d, p) 338.228 33.258 248.084 24.333 19.547
aug-cc-pVTZ 334.463 30.120 245.472 22.150 17.636 HC7N 6–311++g (d, p) 334.463 33.258 245.198 24.407 19.612 aug-cc-pVTZ 329.443 28.865 241.699 21.154 16.764 HC9N 6–311++g (d, p) 332.580 33.886 244.002 24.724 19.890
aug-cc-pVTZ 328.815 30.748 241.178 22.400 17.855 HC11N 6–311++g (d, p) 330.698 33.886 242.468 24.730 19.895
methods, the values have an opposite trend to the values in the gas phase in which the change in Gibbs free energy increases with the increase in the length of the molecule. Tables III and IV also show the results of the scaled values of the pKa. The scaled values are smaller than those calculated with Equation (6) which indicates that the calculated change in Gibbs free energy of solvation might be slightly overestimated. The reason for this lies in the inadequacy of continuum solvation models to accurately calculate solvation energies since explicit solute– solvent interactions are ignored. The inclusion of continuum solvent effects in the geometry optimizations and frequency calculations might improve these results slightly. The plot of the pKa values versus the studied molecules is displayed in Fig. 3.
A satisfactory correlation is obtained between the length of the carbon chain and the values of pKa. However, there are some points to be highlighted. The scaled values are lower than the calculated raw values. Furthermore, the DFT method has shown lower values of pKa than the MP2 method. Finally, the pKa values are slightly increasing with the increase of the chain length starting from HC3N and beyond and hence the acidity is decreasing with increasing the chain length.
For more understanding to the properties of these molecules, natural bond orbital method was used to calculate the charge distribution on each atom of the molecules and shown in Fig. 4 at the gas and solution phases. As shown in Fig. 4, there is no single trend for the charge distribution on the atoms. However, in general, the N and H atoms have the highest negative and positive charges, respectively.
IV. Conclusions
In the present work, we have shown satisfactory values of aqueous pKa values of cyanopolyynes in the gas and aqueous phases through the calculation of the change in Gibbs free energy for these molecules and their deprotonated form. The correlation equation between the experimental aqueous pKa values and the calculated values was used to predict better pKa values. To assess the validity of our results, further experimental work is required. The difference in the acidity of the compounds studied can be interpreted through the charge distribution and conjugation effects. In the gas phase, the pKa values decrease and the acidity increase with the increase of conjugation or the molecule length, whereas, in the aqueous phase, the pKa values increase and the acidity decrease with increasing the chain length.
References
Arnau, A., Tu˜non, I., Silla, E., and Andres, J.M., 1990. HCnN: The largest
molecules in the interstellar medium. Journal of Chemical Education, 67, pp.905-906.
Bell, M., Feldman, P., Travers, M., McCarthy, M., Gottlieb, C., and Thaddeus, P., 1997. Detection of HC11N in the Cold Dust Cloud TMC-1. The Astrophysical
Journal, 483(1), pp.L61-L64.
Botschwina, B., Horn, M., and Oswald, K., 1997. Coupled cluster calculations for HC7N, HC7NH+ and C7N, molecules of interest to astrochemistry. Molecular Physics, 92(3), pp.381-392.
Botschwina, P., 2003. Spectroscopic properties of interstellar molecules: Theory and experiment. Physical Chemistry Chemical Physics, 5(16), pp.3337-3348.
Botschwina, P., and Horn, M., 1997. Accurate equilibrium structure and electric dipole moment of HC9N: Predictions on the basis of large-scale coupled cluster calculations. Journal of Molecular Spectroscopy, 185(1), pp.191-193. Botschwina, P., Heyl, Ä., Oswald, M., and Hirano, T., 1997. Ab initio anharmonic
force fields and spectroscopic properties for HC5N and HC5NH+, molecules
of interest to astrochemistry. Spectrochimica Acta Part A: Molecular and Biomolecular Spectroscopy, 53(8), pp.1079-1090.
Botschwina, P., Schulz, B., Horn, M., and Matuschewski, M., 1995. Ab initio calculations of stretching vibrational transitions for the linear molecules HCN, HNC, HCCF and HC3N up to high overtones. Chemical Physics, 190(2-3), pp.345-362.
Burk, P., and Koppel, I., 1993. Critical test of PM3 calculated gas-phase acidities. Theoretica Chimica Acta, 86(5), pp.417-427.
Burk, P., Koppel, I., Koppel, I., Yagupolskii, L., and Taft, R., 1996. Super acidity of neutral Bronsted acids in gas phase. Journal of Computational Chemistry, 17(1), pp.30-41.
Catalan, J., and Palomar, J., 1998. Gas-phase protolysis between a neutral
Brønsted acid and a neutral Brønsted base. Chemical Physics Letters, 293, pp.511-514.
Charif, I., Mekelleche, S., Villemin, D., and Mora-Diez, N., 2007. Correlation of aqueous pKa values of carbon acids with theoretical descriptors: A DFT study. Journal of Molecular Structure: THEOCHEM, 818(1-3), pp.1-6.
Choho, K., Van Lier, G., Van de Woude, G., and Geerlings, P., 1996. Acidity of hydro fullerenes: A quantum chemical study. Journal of the Chemical Society, Perkin Transactions II,pp.1723-1732.
Contreras, R., Fuentealba, P., Galván, M., and Pérez, P., 1999. A direct evaluation of regional Fukui functions in molecules. Chemical Physics Letters, 304(5-6), pp.405-413.
Cossi, M., Barone, V., Cammi, R., and Tomasi, J., 1996. Ab initio study of
solvated molecules: A new implementation of the polarizable continuum model. Chemical Physics Letters, 255(4-6), pp.327-335.
D’Souza, F., Zandler, M., Deviprasad, G., and Kutner, W., 2000. Acid base properties of fuller opyrrolidines: Experimental and theoretical investigations. The Journal of Physical Chemistry A, 104(29), pp.6887-6893.
Dewar, M., and Dieter, K., 1986. Evaluation of AM1 calculated proton affinities
and deprotonation enthalpies. Journal of the American Chemical Society, 108(25), pp.8075-8086.
Frisch, M.J., Trucks, G.W., Schlegel, H.B., Scuseria, G.E., Robb, M.A., Cheeseman, J.R., Scalmani, G., Barone, V., Mennucci, B., Petersson, G.A., Nakatsuji, H., Caricato, M., Li, X., Hratchian, H.P., Izmaylov, A.F., Bloino, J., Zheng, G., Sonnenberg, J.L., Hada, M., Ehara, M., Toyota, K., Fukuda, R., Hasegawa, J., Ishida, M., Nakajima, T., Honda, Y., Kitao, O., Nakai, H., Vreven, T., Montgomery, J.A Jr., Peralta, J.E., Ogliaro, F., Bearpark, M., Heyd, J.J., Brothers, E., Kudin, K.N., Staroverov, V.N., Kobayashi, R., Normand, J., Raghavachari, K., Rendell, A., Burant, J.C., Iyengar, S.S., Tomasi, J., Cossi, M., Rega, N., Millam, J.M., Klene, M., Knox, J.E., Cross, J.B., Bakken, V., Adamo, C., Jaramillo, J., Gomperts, R., Stratmann, R.E., Yazyev, O., Austin, A.J., Cammi, R., Pomelli, C., Ochterski, J.W., Martin, R.L., Morokuma, K., Zakrzewski, V.G., Voth, G.A., Salvador, P., Dannenberg, J.J., Dapprich, S., Daniels, A.D., Farkas, Ö., Foresman, J.B., Ortiz, J.V., Cioslowski, J., and Fox, D.J., 2009. Gaussian
09, Revision E.01. Gaussian, Inc., Wallingford CT.
Kass, S.R., 1990. Hydrocarbon acidities calculated with MINDO/3, MNDO, and AM1. Journal of Computational Chemistry,11, pp.94-104.
Kunde, V., Aikin, A., Hanel, R., Jennings, D., Maguire, W., and Samuelson, R.,
1981. C4H2, HC3N and C2N2 in Titan’s atmosphere. Nature, 292(5825), pp.686-688.
Liptak, M., Gross, K., Seybold, P., Feldgus, S., and Shields, G., 2002. Absolute pKa determinations for substituted phenols. Journal of the American Chemical Society, 124(22), pp.6421-6427.
McCarthy, M., and Thaddeus, P., 2001. Microwave and laser spectroscopy of carbon chains and rings. Chemical Society Reviews, 30(3), pp.177-185.
Mendoza, E., Lefloch, B., Ceccarelli, C., Kahane, C., Jaber, A.A., Podio, L.,
Benedettini, M., Codella, C., and Viti, S., 2018. A search for Cyanopolyynes in L1157-B1. Monthly Notices of the Royal Astronomical Society, 475(4), pp.5501-5512.
Miertus̃, S., and Tomasi, J., 1982. Approximate evaluations of the electrostatic
free energy and internal energy changes in solution processes. Chemical Physics, 65(2), pp.239-245.
Miertuš, S., Scrocco, E., and Tomasi, J., 1981. Electrostatic interaction of a solute
with a continuum. A direct utilizaion of AB initio molecular potentials for the prevision of solvent effects. Chemical Physics, 55(1), pp.117-129.
Moliner, V., Andrés, J., Arnau, A., Silla, E., and Tuñón, I., 1996. Rotational
constants and dipole moments of interstellar polyynes: A comparative MP2 and density functional (BP86) study. Chemical Physics, 206(1-2), pp.57-61.
Pérez, P., Simón-Manso, Y., Aizman, A., Fuentealba, P., and Contreras, R., 2000.
Empirical energy density relationships for the analysis of substituent effects in chemical reactivity. Journal of the American Chemical Society, 122(19), pp.4756-4762.
Qi, J., Chen, M., Wu, W., Zhang, Q., and Au, C., 2009. Parity alternation of
interstellar molecules cyanopolyynes HCnN (n=1–17). Chemical Physics, 364(1-3), pp.31-38.
Rezende M.C., 2001. The acidity of carbon acids in aqueous solutions: Correlations with theoretical descriptors. Tetrahedron, 57, pp.5923-5930. Rezende, M., 2001. A theoretical HSAB study of the acidity of carbon acids CH3Z. Journal of the Brazilian Chemical Society, 12(1), pp.73-80.
Scemama, A., Chaquin, P., Gazeau, M., and Bénilan, Y., 2002. Theoretical study of the structure and properties of polyynes and monocyano and dicyanopolyynes: Predictions for long chain compounds. The Journal of Physical Chemistry A, 106(15), pp.3828-3837.
Siggel, M.R., Thomas, T.D., and Saethre, L.J., 1988. Ab initio calculation of
Broensted acidities. Journal of the American Chemical Society, 110, pp. 91-96. Skomorowski, W., Gulania, S., and Krylov, A., 2018. Bound and continuum-embedded states of cyanopolyyne anions. Physical Chemistry Chemical Physics, 20(7), pp.4805-4817.
Smith, B., and Radom, L., 1995. Calculation of proton affinities using the
G2 (MP2, SVP) Procedure. The Journal of Physical Chemistry, 99(17), pp.6468-6471.
Smith, B., and Radom, L., 1995. Gas-phase acidities: A comparison of density functional, MP2, MP4, F4, G2 (MP2, SVP), G2 (MP2) and G2 procedures. Chemical Physics Letters, 245(1), pp.123-128.
Smith, M.B., and March, J., 2007. March’s Advanced Organic Chemistry. 6th ed.
John Wiley, New York, pp.359-364.
Woon, D., and Herbst, E., 2009. Quantum chemical predictions of the properties of known and postulated neutral interstellar molecules. The Astrophysical Journal Supplement Series, 185(2), pp.273-288.