RESEARCH
A new genome-scale metabolic
model of
Corynebacterium glutamicum
and its
application
Yu Zhang
1,2, Jingyi Cai
3, Xiuling Shang
1, Bo Wang
1,2, Shuwen Liu
1, Xin Chai
1,2, Tianwei Tan
3, Yun Zhang
1*and Tingyi Wen
1,4*Abstract
Background: Corynebacterium glutamicum is an important platform organism for industrial biotechnology to pro-duce amino acids, organic acids, bioplastic monomers, and biofuels. The metabolic flexibility, broad substrate spec-trum, and fermentative robustness of C. glutamicum make this organism an ideal cell factory to manufacture desired products. With increases in gene function, transport system, and metabolic profile information under certain condi-tions, developing a comprehensive genome-scale metabolic model (GEM) of C. glutamicum ATCC13032 is desired to improve prediction accuracy, elucidate cellular metabolism, and guide metabolic engineering.
Results: Here, we constructed a new GEM for ATCC13032, iCW773, consisting of 773 genes, 950 metabolites, and 1207 reactions. Compared to the previous model, iCW773 supplemented 496 gene–protein-reaction associations, refined five lumped reactions, balanced the mass and charge, and constrained the directionality of reactions. The simulated growth rates of C. glutamicum cultivated on seven different carbon sources using iCW773 were consistent with experimental values. Pearson’s correlation coefficient between the iCW773-simulated and experimental fluxes was 0.99, suggesting that iCW773 provided an accurate intracellular flux distribution of the wild-type strain growing on glucose. Furthermore, genetic interventions for overproducing l-lysine, 1,2-propanediol and isobutanol simulated using OptForceMUST were in accordance with reported experimental results, indicating the practicability of iCW773
for the design of metabolic networks to overproduce desired products. In vivo genetic modifications of i CW773-predicted targets resulted in the de novo generation of an l-proline-overproducing strain. In fed-batch culture, the engineered C. glutamicum strain produced 66.43 g/L l-proline in 60 h with a yield of 0.26 g/g (l-proline/glucose) and a productivity of 1.11 g/L/h. To our knowledge, this is the highest titer and productivity reported for l-proline produc-tion using glucose as the carbon resource in a minimal medium.
Conclusions: Our developed iCW773 serves as a high-quality platform for model-guided strain design to produce industrial bioproducts of interest. This new GEM will be a successful multidisciplinary tool and will make valuable contributions to metabolic engineering in academia and industry.
Keywords: Corynebacterium glutamicum, Genome-scale metabolic model, l-proline production, Model-driven experimentation, Metabolic engineering
© The Author(s) 2017. This article is distributed under the terms of the Creative Commons Attribution 4.0 International License (http://creativecommons.org/licenses/by/4.0/), which permits unrestricted use, distribution, and reproduction in any medium, provided you give appropriate credit to the original author(s) and the source, provide a link to the Creative Commons license, and indicate if changes were made. The Creative Commons Public Domain Dedication waiver (http://creativecommons.org/ publicdomain/zero/1.0/) applies to the data made available in this article, unless otherwise stated.
Open Access
*Correspondence: [email protected]; [email protected]
1 CAS Key Laboratory of Pathogenic Microbiology and Immunology,
Institute of Microbiology, Chinese Academy of Sciences, Beijing 100101, China
4 Savaid Medical School, University of Chinese Academy of Sciences,
Beijing 100049, China
Background
Corynebacterium glutamicum, a Gram-positive soil bac-terium, is an important platform organism for industrial biotechnology and environmental remediation [1, 2]. This microorganism is generally recognized as safe and is used in the fermentative production of l-glutamate and l-lysine on a million-ton scale and l-threonine, l-leucine and l-valine on a thousand-ton scale in the food, feed and pharmaceutical industries [1, 3]. Due to the meta-bolic flexibility, broad substrate spectrum, and fermenta-tive robustness of C. glutamicum cells, this bacterium has attracted attention as a potential cell factory to manufac-ture organic acids, bioplastic monomers (e.g., putrescine and cadaverine), and biofuels including ethanol, isobu-tanol, 1,2-propanediol, and 1-propanol [1, 4, 5]. Based on the knowledge of biochemical pathways and microbial fermentation processes, new technologies such as systems metabolic engineering and high-throughput analyses at the genome, transcriptome, proteome, and fluxome levels have been applied to strain development to improve the yield and productivity of desired products [6–10]. In silico genome-wide predictive simulation of metabolic profiles is expected to enable the design of artificial metabolic net-works for desired product synthesis [11].
A genome-scale metabolic model (GEM) is con-structed based on experimental data and information on gene annotations and functions, metabolites, reac-tions, enzymes, and their interactions [11, 12]. GEM has become an essential tool for understanding cellular metabolism, characterizing cell phenotypes, designing mutant strains with desired properties, and assessing the effects of genetic intervention and environmental pertur-bation on cellular metabolism [13]. The quality of a GEM determines the accuracy of outcomes for describing the genotype–phenotype relationship of a given strain [13, 14]. The first GEM of Escherichia coli (iJE660) con-sisted of 660 genes, 627 reactions, and 438 metabolites. iJE660 was constantly updated to iJO1366 by increasing the numbers of new genes and reactions, expanding the gene-protein-reaction associations (GPRs), balancing the reactions and compartmentalizing metabolites, among other updates [15–18]. The updated GEM accurately characterized E. coli growth metabolic profiles and was used to perform computational and quantitative analyses to resolve problems [14]. When coupled with metabolic flux constraints and a cellular objective, GEM analy-sis using computational algorithms [e.g., flux balance analysis (FBA), OptKnock, or OptForce] can predict the modification of targets in a metabolic network and suc-cessfully improve the production of succinic acid, etha-nol, and malonyl-CoA in E. coli [19–21].
The initial GEM of C. glutamicum ATCC13032 (ModelCg 1) consisted of 247 genes, 446 reactions, and
411 metabolites and was updated to ModelCg 2 (277
genes, 502 reactions, and 423 metabolites) by revising inadequate reaction loops [22, 23]. Although these two models are useful, they have several limitations due to previously inadequate information. Annotated genes known to participate in different metabolic pathways, such as pyruvate kinase isoenzyme, glycerol-3-phos-phatase, and (S,S)-butanediol dehydrogenase, were not included in ModelCg 1 or in ModelCg 2 [24–26]. The
defi-ciency of corresponding metabolic pathways in the two models prevented the prediction of cell growth on cer-tain carbon sources (e.g., acetate, lactate, and xylose). The imbalance of the mass and charge in a few reactions (e.g., synthesis of RNA, protein, and biomass) and the direc-tionality of certain reactions without thermodynamic constraints had a negative effect on genome-wide pre-diction using the two models. Moreover, the two models have incomplete l-glutamate metabolic systems, which prevented their application in studies of the metabolic state of l-glutamate production in the stationary phase [22, 27]. In 2016, Mei et al. constructed iJM658 based on the genome information of C. glutamicum S9114, which was generated by mutagenesis and is widely used for industrial l-glutamate production [27]. iJM658 con-tains l-glutamate secretion and uptake systems, which could be more suitable for studying l-glutamate pro-duction [27]. iJM658 is not applicable for the predic-tion of metabolic profile of C. glutamicum ATCC13032 due to the presence of numerous differences in the genome sequences between C. glutamicum S9114 and ATCC13032. Therefore, it is necessary to expand the scope of C. glutamicum ATCC13032’ GEM to metabolic engineering for the desired products.
In this study, we present an updated model of the C. glutamicum ATCC13032 metabolic network reconstruc-tion. This new model, named iCW773, accurately pre-dicted the growth ability and flux distributions of cells cultivated under different growth conditions. iCW773 simulations of genetic interventions for the overproduc-tion of l-lysine, 1,2-propanediol, and isobutanol were highly consistent with experimental data. Along with wet-lab practices, genetic modifications were performed to generate a de novo l-proline-overproducing strain that exhibited the highest reported titer and productivity using a minimal medium in fed-batch fermentation.
Results and discussion
A new genome‑scale metabolic model of C. glutamicum
ATCC13032
considerable increases in the numbers of genes, reactions and metabolites by 2.79-, 2.41-, and 2.25-fold, respectively, over ModelCg 2 (Additional file 1: Table S1). In the internal
reactions of iCW773, 709 ORFs (89.18%) were extracted from the KEGG and UniProt databases [28]. The total ORF coverage was 25.75% in iCW773, which was 16.52% higher than that in ModelCg 2 (Additional file 1: Table S1). Five
lumped reactions for fatty acids biosynthesis in ModelCg
2 were refined in iCW773 by replacing each lumped reac-tion with several sequential reacreac-tions in iCW773 (Addi-tional file 2). Additionally, the charge and mass of reactions
in iCW773 were balanced, and the mass of reactions
related to biomass was tested to be 1.00 g/g dry cell weight (DCW) (Additional file 3). The directionality of reactions was constrained by the Gibbs free energy ΔrG′, which was
calculated using eQuilibrator2.0 [29]. A complete list of all
the reactions and metabolites for iCW773 is provided in Additional file 3, and the central carbon metabolic path-way is presented in Additional file 4: Figure S1.
Prediction of growth rates under different culture conditions
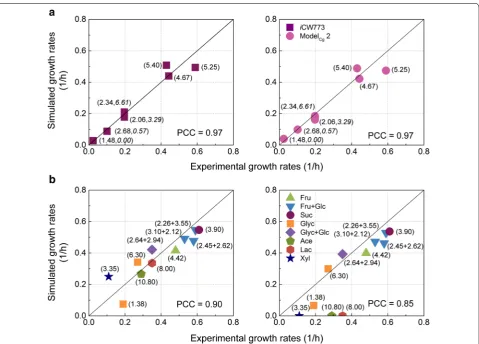
To evaluate the quality of iCW773, the growth rates of C. glutamicum ATCC13032 cultivated on different carbon sources were predicted through FBA simulations using biomass maximization as the objective function. First, we calculated the growth rates on glucose using GEMs by setting the glucose and oxygen consumption rates as the experimental values [22, 30–32]. As shown in Fig. 1a, the Pearson’s correlation coefficient (PCC) between the experi-mental and iCW773-simulated data was consistent with that between the experimental and ModelCg 2-simulated
data. When fructose, fructose mixed with glucose, sucrose, acetate, and lactate were set as the carbon sources, the cell growth rates on acetate or lactate could be calculated only by iCW773, rather than ModelCg 2 (Fig. 1b) [33–37].
It has been reported that C. glutamicum was able to grow on non-native glycerol or xylose as the sole carbon source after expressing heterologous-related enzymes [38–40].
When the three reported reactions catalyzed by glycerol kinase, glycerol 3-phosphate dehydrogenase, and aquaglyc-eroporin from E. coli were added, both GEMs could cal-culate the biomass from glycerol [38, 39]. In contrast, only iCW773 could simulate the biomass accumulation from xylose (Fig. 1b) when two reported reactions catalyzed by xylose isomerase and xylulokinase from E. coli were added [40]. These results provided evidence that supplemental reactions in iCW773 coupled the metabolism of the corre-sponding substrates (e.g., acetate, lactate, and xylose) with the central carbon metabolism (Additional file 5), resulting in the realization of growth simulations on these substrates.
Metabolic profile prediction using iCW773
Next, we compared model-predicted metabolic flux distributions to 13C-tracer metabolic flux data from
ATCC13032 cultivated in minimal medium using glucose
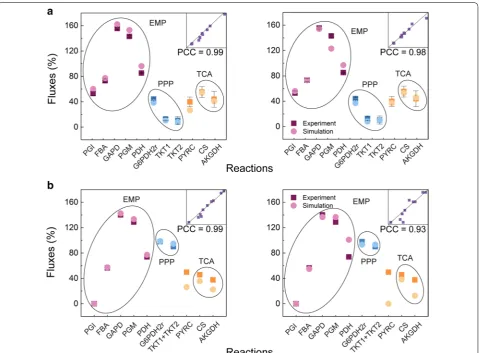
as the sole carbon source [8, 31, 41]. The biomass produc-tion was used as the objective funcproduc-tion, and all flux data were normalized to the glucose uptake rate (100%). Nota-bly, the PCC between the experimental and iCW773-simulated fluxes was 0.99, suggesting that iCW773 provided an accurate intracellular flux distribution of the WT strain growing on glucose (Fig. 2a).
It has been reported that the inactivation of pgi-encoding glucose-6-phosphate isomerase can lead to a significant metabolic flux disturbance, blocking the EMP pathway and redirecting the carbon flux from glucose-6-phosphate toward the PPP pathway in C.
glu-tamicum [31]. To analyze the metabolic disturbance
by gene knockout, the pgi gene was deleted in iCW773 and ModelCg 2. When FBA was used to calculate the
intracellular metabolic flux, the iCW773-predicted flux toward the PPP pathway increased from 38.49 to 98.59%,
which was consistent with the experimental values (from 44.10 to 97.80%) (Fig. 2b) [31]. Moreover, the simulated amount of NADPH generated from the PPP pathway in WT∆pgi was 1.97 mol/mol glucose, which was 2.30-fold higher than that generated from the PPP pathway in WT (0.77 mol/mol glucose). Due to the requirement for a cer-tain amount of NADPH to generate biomass in the sim-ulation (e.g., 4 mol NADPH per mol l-lysine and 2 mol NADPH per mol l-valine), the NADPH generated from isocitrate dehydrogenase in the TCA cycle decreased from 0.41 mol/mol glucose to 0.22 mol/mol glucose to maintain a stoichiometric balance [42, 43]. This dif-ference in NADPH generation resulted in a smaller deviation from the iCW773-simulated TCA flux to the experimental value, as shown in Fig. 2b (left). Notably, the flux of pyruvate carboxylase (PYRC) in iCW773 was efficiently generated, while no PYRC flux from pyru-vate to oxaloacetate was calculated in ModelCg 2. These
results illustrate the suitability of iCW773 for predicting intracellular metabolic flux distribution.
Validation of iCW773 simulation for amino acid
overproduction
To investigate whether iCW773 is an efficient tool to design strategies for the metabolic engineering of C. glu-tamicum, the ranges of flux variability in the network for the WT and l-lysine overproducing strains were calculated using OptForceMUST (Additional file 6). As
shown in Fig. 3, the gap between the flux ranges of the WT and overproducing network quantified the degree of required reaction flux modification. In the simulations of iCW773, the upregulation of aspartokinase (encoded
by lysC), dihydrodipicolinate synthase (encoded by
dapA), dihydrodipicolinate reductase (encoded by dapB), diaminopimelate dehydrogenase (encoded by ddh), and diaminopimelate decarboxylase (encoded by lysA) in the l-lysine synthesis pathway were consistent with previous reports [8, 44, 45]. Downregulation of homoserine dehy-drogenase (encoded by hom) decreased the flux toward the competitive pathway [8, 44, 46]. Moreover, deletion of phosphoenolpyruvate carboxykinase (encoded by pck) and upregulation of pyruvate carboxylase (encoded by pyc) directed the flux toward oxaloacetate formation at the pyruvate node for l-lysine synthesis [8, 47]. Down-regulation of aconitase (encoded by acn) and isocitrate dehydrogenase (encoded by icd) further minimized car-bon loss from pyruvate [48]. In addition, upregulation of the entire transketolase operon and fructose-1,6-bi-sphosphatase (encoded by fbp) enhances the NADPH supply via PPP to increase l-lysine production [8, 49]. In contrast, ModelCg 2 failed to predict the deletion of
pck, the downregulation of hom and the upregulation
of lysC, ddh, dapB, and fbp. Therefore, the predictions
by iCW773 were highly consistent with experimental
results. For l-valine and l-serine overproduction, the modification targets predicted by iCW773 were identi-cal to the reported experimental results (Additional file 1: Table S2).
Validation of iCW773 simulation for non‑native
1,2‑propanediol and isobutanol synthesis
Corynebacterium glutamicum has previously been engi-neered for non-native 1,2-propanediol and isobutanol production [50, 51]. Therefore, we performed a com-parison between iCW773-simulated and experimentally performed genetic modification strategies with respect to 1,2-propanediol and isobutanol overproduction [50,
51]. As previously reported, a three-reaction synthesis route by the heterologous genes mgsA, gldA, and yqhD, which encode methylglyoxal synthase, glycerol dehy-drogenase, and alcohol dehydrogenase from E. coli, was added to iCW773 to synthesize 1,2-propanediol from dihydroxyacetone phosphate (dhap) [50]. Then, the ranges of flux variability in the network for the WT and 1,2-propanediol-overproducing strains were calculated by OptForceMUST (Additional file 7). As shown in Fig. 4a,
upregulation of mgsA, gldA, and yqhD directed the flux toward 1,2-propanediol synthesis, which was consist-ent with the finding that the heterologous expression of these three genes in the WT strain led to a product yield of 0.13 mol/mol (1,2-propanediol/glucose) [50]. Moreo-ver, model simulation showed that the deletion of hdpA encoding dihydroxyacetone phosphate phosphatase could increase the precursor (dhap) supply by preventing glycerol formation from dhap, which was supported by the experimental results that 1,2-propanediol production increased by 90.08% in strain WT∆hdpA
(pEKEx3-mgsA-gldA-yqhD) [50]. The OptForceMUST analysis indicated
that knockout of ldh encoding lactate dehydrogenase could further decrease the formation of byproducts and increase 1,2-propanediol production. This prediction was validated by the experimental finding that ldh deletion increased 1,2-propanediol by 37.75% [50]. In addition, downregulation of tpiA, gap, pgk, and gpmA would be novel targets for 1,2-propanediol overproduction.
As reported previously, the isobutanol pathway in iCW773 was constructed by kivd-encoding keto acid decarboxylase from Lactococcus lactis and native adhA-encoding alcohol dehydrogenase catalyzing 3-methyl-2-oxobutanoate to isobutanol [52]. The predicted knockout, upregulation, and downregulation of target genes by OptForceMUST are shown in Fig. 4b (Additional
analysis indicated that the decrease in pyruvate con-sumption caused by inactivating ldh-encoding lactate dehydrogenase and downregulating the aceE-encoding pyruvate dehydrogenase subunit would increase tanol synthesis. In vivo ldh deletion increased the isobu-tanol yield by 23%, while deletion of aceE led to pyruvate
simulation, might be a better alternative [53]. In addi-tion, the iCW773-simulated strategy to improve isobu-tanol synthesis included an increase in the intracellular NADPH pool by downregulation of pgi in combination with upregulation of zwf. This combined regulation mode for pgi and zwf had been demonstrated to increase intra-cellular NADPH levels by redirecting carbon flux toward PPP [9]. In contrast, deletion of pgi together with aceE severely inhibited growth and eliminated isobutanol production [52]. Taken together, these data indicate that downregulation of aceE and pgi together with upregu-lation of zwf would contribute to isobutanol synthesis and simultaneously maintain growth. In summary, the iCW773-designed strategy could provide insights into future work for the optimization of 1,2-propanediol and isobutanol production in C. glutamicum.
In silico design and wet‑lab construction of an
l‑proline‑overproducing strain
Despite the strong flux toward l-glutamate formation in C. glutamicum, l-proline converted from l-glutamate under three sequential catalytic reactions by γ-glutamyl kinase (proB), glutamate-5-semialdehyde dehydroge-nase (proA), and pyrroline-5-carboxylate reductase (proC) has not been efficiently synthesized by the engi-neered strain derived from C. glutamicum ATCC13032 [54–56]. The heterologous expression of ornithine cyclodeaminase merely made an l-ornithine-producing strain overproduce l-proline by six enzymatic reac-tions from l-glutamate, which was not an economically feasible means of carbon utilization in l-proline syn-thesis [56, 57]. Thus, iCW773 was applied to identify metabolic interventions that led to the overproduction of Fig. 4 Application for overproduction of the non-natural products 1,2-propanediol (a) and isobutanol (b) using OptForceMUST. Genes encoding relevant enzymes are depicted with italics next to the arrows: aceE: pyruvate dehydrogenase complex; adhA: alcohol dehydrogenase; alaS: acetolac-tate synthase; gap: glyceraldehyde-3-phosphate dehydrogenase; gldA: glycerol dehydrogenase; gpmA: phosphoglycerate mutase; hdpA: dihydroxy-acetone phosphate phosphatase; ilvC: acetohydroxyacid isomeroreductase; ilvD: dihydroxyacid dehydratase; ilvE: valine transaminase; kivD: keto acid decarboxylase; ldh: lactate dehydrogenase; mgsA: methylglyoxal synthase; pgi: glucose-6-phosphate isomerase; pgk: phosphoglycerate kinase;
tpiA: triose-phosphate isomerase; yqhD: aldehyde reductase. For other genes, see Fig. 3. 12ppd: 1,2-propanediol; 13dpg: 3-phospho-d-glyceroyl
l-proline via OptForceMUST (Additional file 8). As shown
in Fig. 5a, the upregulation of five reactions in the glyco-lytic pathway and citrate synthase (CS, encoded by gltA) and downregulation of α-oxoglutarate dehydrogenase (AKGDH, encoded by kgd) predicted by iCW773 were consistent with those predicted by ModelCg 2. The
differ-ences between the iCW773 and ModelCg 2 simulations
were the downregulation of reactions from pyruvate to l-valine and l-alanine and upregulation of aconitase [ACONTa(b), encoded by acn] and isocitrate dehydro-genase (ICDHyr, encoded by icd), which converts citrate to α-oxoglutarate. The largest difference between the two models was the knockout of the putA gene to block the conversion of Δ1-pyrroline-5-carboxylate to glutamate. PutA is a bifunctional enzyme with both proline dehy-drogenase and Δ1-pyrroline-5-carboxylate dehydroge-nase activities, which catalyzes the two-step oxidation of l-proline to glutamate in E. coli [58]. In iCW773, the reaction from l-glutamate to Δ1-pyrroline-5-carboxylate formed a cycle in the presence of PutA, which made it inefficient to convert Δ1-pyrroline-5-carboxylate to l-proline. Blocking this conversion and upregulation of
Δ1-pyrroline-5-carboxylate reductase (encoded by proC), the flux could be efficiently directed toward l-proline synthesis. Then, the PutA reactions were deleted in both models to predict the metabolic profile of overproduc-ing l-proline (Additional file 9). As shown in Fig. 5b, one difference between the iCW773 and ModelCg 2
simulations was the upregulation of ProB to direct the metabolic flux from l-glutamate toward l-proline syn-thesis. However, the reaction from glutamate-5-semi-aldehyde to Δ1-pyrroline-5-carboxylate, which differed in the ModelCg 2 simulation, was impossible to control
by genetic modification because this reaction occurred spontaneously without enzymatic catalysis.
To validate the accuracy of the iCW773 prediction for l-proline overproduction, different targets between the iCW773 and ModelCg 2 simulations were chosen for
genetic modification. Because the enzymatic activity of ProB is strictly restricted to feedback inhibition by l-pro-line, no accumulation of l-proline will occur in WT [59]. Therefore, the feedback inhibition of ProB by l-proline was first released through the introduction of the nucle-otide substitution G446A into the chromosomal proB
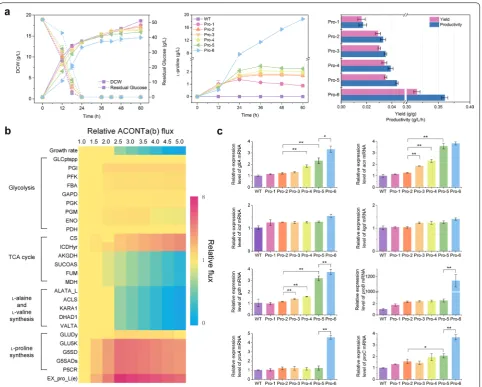
gene [60]. The Pro-1 strain accumulated a small amount of l-proline compared with the WT (Table 1). Notably, the l-proline titer dropped after 36 h (Fig. 6a), indicat-ing that l-proline may be converted to l-glutamate under PutA catalysis as simulated by iCW773. When putA was knocked out in Pro-1, the l-proline production of Pro-2 was 1.92-fold higher than that of Pro-1 (Table 1), which was consistent with a previous report that deletion of putA significantly increased the formation of trans-4-l-hydroxyproline derived from l-proline in recombinant E.
coli BL21 [61]. In addition, the product yield of l-proline
from glucose was improved 1.94-fold upon deleting putA (Fig. 6a).
Upregulation of gltA, acn, and icd expression was simulated by iCW773 to drive more carbon flux to α-oxoglutarate formation for l-proline synthesis. It has been demonstrated that CS flux in vivo is not strictly controlled by the amount of gltA expression [62], while the transcription of the acn gene is subjected to com-plex regulations mediated by the AcnR, RipA, and GlxR repressors [63, 64]. Thus, aconitase-catalyzed reactions should be a major control point in the TCA cycle dur-ing growth on glucose [64, 65]. The effects of increased ACONTa(b) flux on cell metabolism and l-proline syn-thesis were simulated using FBA. The fluxes toward CS and ICDHyr were enhanced with the increase in the relative ACONTa(b) flux, and maximum extracellular l-proline production was achieved when the relative ACONTa(b) flux was improved by 2.5-fold compared with WT (Fig. 6b). Conversely, the fluxes toward l-valine and l-alanine synthesis decreased. After the native pro-moter of the acn gene was replaced with three promot-ers of varying strength (PglyA, Ppck, and Peftu) and the
start codon was changed from TTG to ATG in Pro-2, the mRNA levels of the acn gene increased by 1.47-, 1.82-, and 2.83-fold in the Pro-3, Pro-4 and Pro-5 strains, respectively (Fig. 6c). With upregulation of the acn gene, the mRNA levels of gltA in Pro-4 and Pro-5 increased by 50.82 and 88.52%, respectively, consistent with a previ-ous observation that the expression of gltA and acn were simultaneously increased and might be controlled by a similar mechanism [65]. However, no significant changes were observed in the mRNA level of icd or kgd (Fig. 6c). When the mRNA levels of acn were increased, Pro-5 pro-duced 2.26 ± 0.03 g/L l-proline with a 33.73% increase over Pro-2. Correspondingly, the byproducts of l-alanine and l-valine decreased by 16.95 and 8.09%. The extracel-lular metabolites exhibited a 73.34% decrease in citrate and a 1.37-fold increase in α-oxoglutarate.
Finally, to validate the positive correlation between GLU5K flux and l-proline yields (Additional file 4: Fig-ure S2), the mutant proB (G446A) under the control of Ptac on a plasmid was induced to overexpress the
feedback-resistant γ-glutamyl kinase. When the mRNA level of proB* was significantly increased, the mRNA levels of the proA, proC, and gdh genes were simulta-neously increased (Fig. 6c). The resultant Pro-6 strain showed an 8.27-fold increase in l-proline production (18.71 ± 0.21 g/L), with 8.18- and 9.03-fold increases in yield (0.36 g/g) and productivity (0.32 g/L/h), respec-tively, compared with Pro-5 (Fig. 6a). In addition, there were 85.55 and 45.42% decreases in extracellular α-oxoglutarate and succinate, respectively.
The performance of Pro‑6 in fed‑batch fermentation
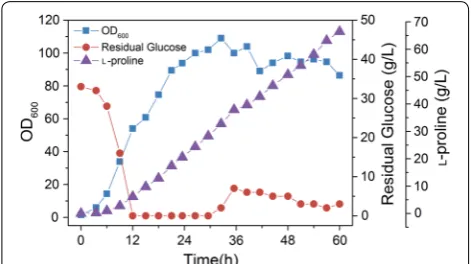
The production performance of the final Pro-6 strain was investigated in fed-batch fermentation. As shown in Fig. 7, the strain grew continuously from 0 to 32 h and reached a cell concentration of OD600 = 109.02 at 32 h.
The assimilated glucose was efficiently channeled to the l-proline biosynthetic pathway; l-proline produc-tion began at an early stage and continuously increased throughout the fermentation period. A major and con-stant increase in l-proline production was achieved dur-ing the feeddur-ing phase, which was initiated after the initial sugar (40 g/L) in the batch medium was consumed. The maximal specific growth rate of strain Pro-6 was 0.40 h−1,
and the maximal specific glucose consumption rate was 5.46 mmol/gDCW/h. The maximal l-proline titer reached 66.43 g/L at 60 h with a yield of 0.26 g/g glucose (0.41 mol/mol glucose) and a productivity of 1.11 g/L/h. Consequently, the genetically engineered Pro-6 strain in this study was demonstrated to be an efficient l-pro-line-producing strain without any nutrition-auxotroph and with the highest titer and productivity reported on minimal medium with glucose as the sole carbon source (Table 2).
Conclusions
In this study, we reconstructed a genome-scale metabolic model of C. glutamicum ATCC13032 with an expanded size and scope compared with the previous ModelCg 2.
The iCW773-simulated results of growth rates, metabolic flux profiles, and modification targets for overproducing natural and non-natural products were much more con-sistent with experimental data than those of ModelCg 2.
Table 1 C omparison of f ermen ta tion par amet ers of diff er en t str ains in shak
e flask cultiv
Methods
Genome‑scale metabolic model reconstruction
The reconstruction of the C. glutamicum ATCC13032 metabolic network was conducted based on the model of Shinfuku et al. [22]. A 96-step procedure for metabolic net-work reconstruction was recently published [66], and the appropriate steps were followed after new genes, reactions, and metabolites were added to generate iCW773. The KEGG (http://www.genome.jp/kegg/) and UniProt (http:// www.uniprot.org/) databases were referenced to obtain reaction information and reaction-gene associations
during the draft reconstruction stage, and iJO1366 was referenced to obtain the abbreviations of the same metab-olites between C. glutamicum and E. coli [17]. The charge and mass of reactions in iCW773 were automatically bal-anced using the CheckMassChargeBalance command in Cobra Toolbox, and reversibility was assigned based on the Gibbs free energy by the eQuilibrator database (http:// equilibrator2.milolab.webfactional.com/). Cobra Tool-box 2.05 with MatLab 2010b (MathWorks Inc.) was used for additional model testing [67], and the glpk solvers were used for the optimization procedures [68].
Fig. 6 Analysis of l-proline-overproducing strains. a Flask cultivation of different C. glutamicum strains. b Simulation of the impact of increased ACONTa(b) flux on cellular metabolism for robustness analysis was investigated with increasing relative ACONTa(b) fluxes (between 1.0 and 5.0).
X-axis relative ACONTa(b) flux (the ratio of the test ACONTa(b) flux to the native ACONTa(b) flux). Relative ACONTa(b) flux = 1.0 served as the control
Flux balance analysis
The growth rates and metabolic flux distribution of C. glutamicum ATCC13032 were calculated using FBA with commercially available glpk and Matlab software [16, 18]. To simulate growth rates and metabolic flux distribu-tions, biomass production was set as the objective func-tion. For the simulation of growth rates under different glucose and oxygen levels, glucose and oxygen uptake rates were set as the experimental values, as shown in Fig. 1a. For the simulation of growth rates on different carbon sources, the uptake rate of related carbon source was set as the experimental value, as shown in Fig. 1b. Small molecular external metabolites such as CO2, H2O,
SO3, NH3, and PO4 were allowed to be freely transported
across the cell membrane.
OptForceMUST
The flux variability analysis was conducted to calculate each reaction’s flux span for both the wild-type and overproducing strains. A 13C flux and a relatively high
secretion rate analyses were employed to constraint the wild-type and overproducing-type simulations, respectively [69]. The flux ranges for each reaction were compared, and some reactions of the overpro-ducing strain need to be genetically modified through
up/downregulation or knockout if no overlap between the flux range of the wild-type strain and that of the overproducing strain was found. A pool of modified reactions to construct the overproducing-type strain was produced.
To analyze the overproductions of the native and non-native metabolites, 13C flux data of the wild-type strain
on glucose under aerobic condition were used as the con-straints of the maximal range of flux variability [8, 31, 41]. For the non-native product, simulations of 1,2-propan-ediol and isobutanol production were performed after the heterogeneous reactions were added to iCW773, as described in Additional file 10. We imposed a minimum production yield of 98% of the theoretical maximum for l-lysine, l-valine, l-serine, l-proline, 1,2-propanediol, and isobutanol; the biomass flux was constrained to at least 1% of its theoretical maximum; and the l-lysine, l-valine, l-serine, l-proline, 1,2-propanediol, and isob-utanol transport reactions were set as the target reac-tions, respectively. The upper and lower bounds of the
13C-tracer experimental fluxes are listed in Additional
file 10 [8, 31, 41]. OptForceMUST was used to identify the
reactions/genes that required to be up/downregulated or knocked out to maximize the production of the targeted metabolites.
Strains and plasmids
Wild-type C. glutamicum ATCC13032 (American Type and Culture Collection, Manassas, VA, USA) was used as the parental strain for strain engineering. The E. coli strain EC135 was used as the cloning host, and the pXMJ19 and pK18mobsacB plasmids were applied for gene overexpression with induction of isopropyl-β-d-thiogalactopyranoside (IPTG) and gene deletion, respec-tively [70]. All of the strains and plasmids used in this study are listed in Additional file 1: Table S3.
Constructions of plasmids and strains
Total genomic DNA was extracted from C.
glutami-cum according to a previously described procedure [71].
Fig. 7 Fed-batch culture of Pro-6 in a 7.5-L bioreactor
Table 2 Overview of l-proline-producing strains
a Estimated from reference
b Achieved in fed-batch fermentation
Strain Breeding Medium Titer (g/L) Yield (g/g) Productivity (g/L/h) References
Pro-6 Metabolic engineering Minimal medium 18.71 ± 0.21 0.36 ± 0.01 0.32 ± 0.01 This work
66.43b 0.26b 1.11b
Corynebacterium glutamicum Metabolic engineering Minimal medium 0.25–0.30a 0.25–0.30a [57]
Corynebacterium glutamicum Metabolic engineering Minimal medium 12.70 0.36 0.42 [56]
Corynebacterium
acetoacido-philum l-Histidine auxotroph; muta-tion YPD medium 42
b 1.66b [55]
To construct a C. glutamicum strain carrying a point mutation resulting in an amino acid substitution from glycine to aspartate at position 149 of the ProB polypep-tide, the proB gene was first deleted in the WT strain. The upstream and downstream homologous fragments
of proB were amplified using PCR with primers P1/P2
and P3/P4. The amplified DNA fragments were spliced using overlap extension PCR and were ligated into the suicide vector pK18mobsacB [72]. The plasmids were verified by DNA sequencing and then transformed into the WT strain through electroporation to generate the WTΔproB strain, which was further verified by sequenc-ing. In a second step, the mutation was introduced into
the proB gene by PCR amplification with the primers
P1/P7 and P8/P4. The amplified DNA fragments were spliced using overlap extension PCR and ligated into the suicide vector pK18mobsacB. The obtained plasmid was transformed into the WTΔproB strain to generate the Pro-1 (WTproB*) strain [60]. For deletion of the putA gene, previously isolated WT genomic DNA was amplified using PCR with primers P9/P10 and P11/P12. The ampli-fied DNA fragments were spliced using overlap extension PCR and ligated into the suicide vector pK18mobsacB. The plasmids were verified by DNA sequencing and then transformed into the Pro-1 (WTproB*) strain through electroporation to generate the Pro-2 (WTproB*∆putA) strain, which was further verified by sequencing.
To replace the native promoter of the acn gene with the promoter of pck, the RBS sequence with ‘AAAGGAGGA,’ and the start codon with ATG, three fragments corre-sponding to the upstream region of acn, the introduced modulation element including the pck promoter and the RBS as well as the acn gene were amplified with prim-ers P15/P16, P17/P18, and P19/P20, respectively. These fragments were spliced using overlap extension PCR and ligated into the suicide vector pK18mobsacB. The plas-mids were verified by DNA sequencing and then trans-formed into the Pro-2 (WTproB*∆putA) strain through electroporation to generate the Pro-3 (WTproB*Ppck:
:Pacnacn*∆putA) strain, which was further verified by
sequencing. Similarly, the promotor of the acn gene was altered in Pro-2 (WTproBG446A∆putA), which
gener-ated Pro-4 (WTproB*PglyA::Pacnacn*∆putA) and Pro-5
(WTproB*Peftu::Pacnacn*∆putA).
The C. glutamicum and E. coli shuttle vector pXMJ19
was used for the overexpression of the proB* gene [73]. For amplification of the proB* gene, genomic DNA isolated from Pro-1 (WTproB*) was amplified using PCR with prim-ers P31/P32. Then, the amplified DNA fragment was ligated into the shuttle vector pXMJ19. The plasmids were verified by DNA sequencing and then transformed into the Pro-5 (WTproB*Peftu::Pacnacn*∆putA) strain through
electropora-tion to generate the Pro-6 (WTproB*Peftu::Pacnacn*∆putA/
pXMJ19-proB*) strain. When needed, 0.1 mM IPTG was added to the culture medium to induce target gene over-expression. The primers used in this study are provided in Additional file 1: Table S4.
Media and cultivation
The E. coli strains were aerobically grown at 37 °C in
Luria–Bertani medium [74]. The C. glutamicum strains were cultivated in brain heart infusion (BHI) medium (37 g/L brain heart infusion with 91 g/L sorbitol) at 30 °C for genetic disruption and complementation [75]. As a minimal medium, CGXII medium was used with 40 g/L glucose [76]. When necessary, antibiotics were added at the following concentrations: 50 μg/mL kanamycin or 20 μg/mL chloramphenicol for E. coli and 25 μg/mL kan-amycin or 10 μg/mL chloramphenicol for C. glutamicum. In the shake-flask growth experiment, C. glutamicum strains were precultured in the CGIII seed medium at 30 °C and 200 rpm until the OD600 reached 12. One milliliter of
seed culture was inoculated in a 500-mL baffled shake flask with 30 mL of CGXII minimal medium. The cells were cul-tured in triplicate at 30 °C and shaken at 220 rpm. The pH was maintained at 7.0–7.2 via ammonia supplementation.
The fed-batch fermentation was performed in a 7.5-L bioreactor (BioFlo®/CelliGen®115, New Brunswick, USA) with a working volume of 2 L of CGX medium contain-ing 40 g/L glucose. After 3 h of growth, 0.1 mmol/L IPTG was added for the induction of Ptac. The concentration
of glucose over all of the fed-batch cultures was main-tained within the range of 5 ± 5 g/L by supplying 800 g/L of glucose reservoir. The glucose reservoir was fed into the fermenter at the rate of 0.2–0.5 mL/min according to the residual glucose concentration. The temperature was maintained at 32 °C using cold water circulation. The pH was maintained at 6.9 via the automated addition of ammonia and 100 mmol/L H3PO4. Dissolved oxygen was
determined using a pO2 electrode and maintained above
30% saturation via variation of the stir speed.
Analytical methods
The glucose concentration was measured using an SBA-40D biosensor analyzer (Institute of Biology of Shan-dong Province Academy of Sciences, ShanShan-dong, China). The cell concentration was determined by measuring the absorbance at 600 nm (OD600) using a
spectropho-tometer (V-1100D; Mapada Instruments, Shanghai, China). The dry cell weight (DCW) per liter was calcu-lated using an experimentally determined formula: DCW (g/L) = 0.27 × OD600 [77]. The amino acids in the culture
supernatant were determined using high-performance liquid chromatography with a Zorbax Eclipse XDB-C18
Mobile phase A was 55% (v/v) acetonitrile, and mobile phase B consisted of 40 mmol/L KH2PO4 at pH 7.0–7.2.
The flow rate of the mobile phase was 1 mL/min. The organic acids in the culture supernatant were determined using high-performance liquid chromatography with a SB-Aq column (4.6 × 250 mm; 5 μm; Agilent) at 40 °C and 210 nm. Mobile phase A was acetonitrile, and mobile phase B consisted of 20 mmol/L KH2PO4 at pH 2.3. The
flow rate of the mobile phase was 1 mL/min.
RNA preparation and quantitative RT‑PCR
Corynebacterium glutamicum strains were grown to the exponential phase in CGXII minimal medium as described above. The cells were harvested and the total RNA was isolated using an RNAprep Pure Cell/Bacteria Kit (Tiangen, China). Reverse transcription of approxi-mately 400 ng of RNA was performed with the primers listed in Additional file 1: Table S4 using a FastQuant RT Kit (Tiangen, China). Quantitative PCR was performed using GoTaq qPCR master mix (Promega, USA) in a 20-μL mixture with a LightCycler® 96 Real-Time PCR System (Roche, Switzerland). The C. glutamicum rpoB gene was used as the reference gene to normalize the gltA,
acn, icd, kgd, gdh, proB, proA, and proC mRNA levels [70].
Negative controls were used in each PCR run to exclude DNA and other contaminants. The qPCR products were verified via a melting curve analysis. Data collection and analyses were conducted using LightCycler® 96 software (Roche, Switzerland) with the 2−∆∆CT method [78].
Additional files
Additional file 1: Table S1. Comparison of GEM attributes among
vari-ous C. glutamicum models. Table S2. Comparison between the in silico
prediction of the genes and proteins involved in the overproduction of
l-valine and l-serine with the experimental data. Table S3. Strains and
plasmids used in this study. Table S4. Primers used in this study. Additional file 2. The lumped reactions of ModelCg 2. Additional file 3. The reactions and metabolites of iCW773. Additional file 4: Figure S1. The central metabolic network of C.
glu-tamicum. Fig. S2. Robustness analysis of GLU5K flux on l-proline
produc-tion rate by Pro-2 and Pro-5.
Additional file 5. The flux distribution values for simulations on acetate,
lactate and xylose using FBA by iCW773.
Additional file 6. Overproduction of l-lysine in WT using OptForceMUST
by iCW773 and ModelCg 2.
Additional file 7. Overproduction of 1,2-propanediol and isobutanol in
WT using OptForceMUST by iCW773.
Additional file 8. Overproduction of l-proline in WT using OptForceMUST
by iCW773 and ModelCg 2.
Additional file 9. Overproduction of l-proline in WTΔputA using
OptForceMUST by iCW773 and ModelCg 2.
Additional file 10. The upper and lower bounds of the 13C-tracer
experimental fluxes used by OptForceMUST and the added reactions used
in this study.
Abbreviations
Δ: deletion; ACONTa(b): aconitase; C. glutamicum: Corynebacterium
glutami-cum; CS: citrate synthase; DCW: dry cell weight; E. coli: Escherichia coli; FBA: flux
balance analysis; FVA: flux variability analysis; GEM: genome-scale metabolic model; GLU5K: γ-glutamyl kinase; HPLC: high-performance liquid
chroma-tography; IPTG: isopropylthio-β-d-galactopyranoside; NADPH and NADP:
reduced and oxidized form of nicotinamide adenine dinucleotide phosphate,
respectively; OD600: optical density at wavelength (λ) 600 nm; ORF: open
read-ing frame; PPP: pentose phosphate pathway; PYRC: pyruvate carboxylase; TCA: tricarboxylic acid cycle; WT: wild-type.
Authors’ contributions
TW and YZ conceived the study. TW, YZ, YZ, and TT designed the study. YZ, JC, YZ, XS, BW, SL, and XC performed the experiments. YZ, JC, and YZ per-formed all data analysis. YZ, YZ, and TW wrote the paper. All authors read and approved the final manuscript.
Author details
1 CAS Key Laboratory of Pathogenic Microbiology and Immunology, Institute
of Microbiology, Chinese Academy of Sciences, Beijing 100101, China.
2 University of Chinese Academy of Sciences, Beijing 100049, China. 3 Beijing
University of Chemical Technology, Beijing 100029, China. 4 Savaid Medical
School, University of Chinese Academy of Sciences, Beijing 100049, China.
Acknowledgements
The authors would like to thank Siu Hung Joshua Chan and Professor
Pengcheng Fu for discussion with the reconstruction of iCW773.
Competing interests
The authors declare that they have no competing interests.
Availability of supporting data
Data supporting the results of the article are included within this manuscript.
Consent for publication
All authors have approved the manuscript for publication.
Funding
This work was supported by grants from National Hi-Tech Research and Development Program of China (2014AA021203), the Science and Technology Service Network Initiative of the Chinese Academy of Sciences (KFJ-STS-QYZD-047 and KFJ-EW-STS-078), and National Natural Science Foundation of China (31100074, 21390202 and 21436002).
Publisher’s Note
Springer Nature remains neutral with regard to jurisdictional claims in pub-lished maps and institutional affiliations.
Received: 14 February 2017 Accepted: 22 June 2017
References
1. Becker J, Giesselmann G, Hoffmann SL, Wittmann C. Corynebacterium
glutamicum for sustainable bioproduction: from metabolic physiology to
systems metabolic engineering. Advances in Biochemical Engineering/ Biotechnology. Berlin: Springer;2016. P. 1–47. doi:10.1007/10_2016_21. 2. Villadangos AF, Ordonez E, Pedre B, Messens J, Gil JA, Mateos LM.
Engi-neered coryneform bacteria as a bio-tool for arsenic remediation. Appl
Microbiol Biotechnol. 2014;98:10143–52.
3. Hirasawa T, Shimizu H. Recent advances in amino acid production by microbial cells. Curr Opin Biotechnol. 2016;42:133–46.
4. Lee JY, Na YA, Kim E, Lee HS, Kim P. The actinobacterium Corynebacterium
glutamicum, an industrial workhorse. J Microbiol Biotechnol. 2016;26:807–22.
5. Nguyen ADQ, Schneider J, Wendisch V. Identification of engineering
targets for improving putrescine production by Corynebacterium
6. Shi S, Chen T, Zhao X. Comparative transcriptome analysis for metabolic engineering. Methods Mol Biol. 2013;985:447–58.
7. Lee SH, Kang KH, Kim EY, Chae TU, Oh YH, Hong SH, Song BK, Jegals J,
Park SJ, Lee SY. Metabolic engineering of Escherichia coli for enhanced
biosynthesis of poly(3-hydroxybutyrate) based on proteome analysis. Biotechnol Lett. 2013;35:1631–7.
8. Becker J, Zelder O, Hafner S, Schroder H, Wittmann C. From zero to
hero—design-based systems metabolic engineering of Corynebacterium
glutamicum for l-lysine production. Metab Eng. 2011;13:159–68.
9. Park SH, Kim HU, Kim TY, Park JS, Kim SS, Lee SY. Metabolic engineering
of Corynebacterium glutamicum for l-arginine production. Nat Commun.
2014;5:4618.
10. Lee KH, Park JH, Kim TY, Kim HU, Lee SY. Systems metabolic engineering
of Escherichia coli for l-threonine production. Mol Syst Biol. 2007;3:149.
11. Kim B, Kim WJ, Kim DI, Lee SY. Applications of genome-scale metabolic network model in metabolic engineering. J Ind Microbiol Biotechnol. 2015;42:339–48.
12. Kim TY, Sohn SB, Kim YB, Kim WJ, Lee SY. Recent advances in reconstruc-tion and applicareconstruc-tions of genome-scale metabolic models. Curr Opin Biotechnol. 2012;23:617–23.
13. Damiani AL, He QP, Jeffries TW, Wang J. Comprehensive evaluation of
two genome-scale metabolic network models for Scheffersomyces stipitis.
Biotechnol Bioeng. 2015;112:1250–62.
14. McCloskey D, Palsson BO, Feist AM. Basic and applied uses of
genome-scale metabolic network reconstructions of Escherichia coli. Mol Syst Biol.
2013;9:661.
15. Reed JL, Vo TD, Schilling CH, Palsson BO. An expanded
genome-scale model of Escherichia coli K-12 (iJR904 GSM/GPR). Genome Biol.
2003;4:R54.
16. Feist AM, Henry CS, Reed JL, Krummenacker M, Joyce AR, Karp PD, Broadbelt LJ, Hatzimanikatis V, Palsson BO. A genome-scale metabolic
reconstruction for Escherichia coli K-12 MG1655 that accounts for 1260
ORFs and thermodynamic information. Mol Syst Biol. 2007;3:121. 17. Orth JD, Conrad TM, Na J, Lerman JA, Nam H, Feist AM, Palsson BO. A
comprehensive genome-scale reconstruction of Escherichia coli
metabo-lism—2011. Mol Syst Biol. 2011;7:535.
18. Edwards JS, Palsson BO. The Escherichia coli MG1655 in silico metabolic
genotype: its definition, characteristics, and capabilities. Proc Natl Acad Sci USA. 2000;97:5528–33.
19. Mienda BS, Shamsir MS, Illias RM. Model-guided metabolic gene
knock-out of gnd for enhanced succinate production in Escherichia coli from
glucose and glycerol substrates. Comput Biol Chem. 2016;61:130–7. 20. Liu J, Qi H, Wang C, Wen J. Model-driven intracellular redox status
modu-lation for increasing isobutanol production in Escherichia coli. Biotechnol
Biofuels. 2015;8:108.
21. Xu P, Ranganathan S, Fowler ZL, Maranas CD, Koffas MA. Genome-scale metabolic network modeling results in minimal interventions that cooperatively force carbon flux towards malonyl-CoA. Metab Eng. 2011;13:578–87.
22. Shinfuku Y, Sorpitiporn N, Sono M, Furusawa C, Hirasawa T, Shimizu H. Development and experimental verification of a genome-scale
meta-bolic model for Corynebacterium glutamicum. Microb Cell Fact. 2009;8:43.
23. Kjeldsen KR, Nielsen J. In silico genome-scale reconstruction and
valida-tion of the Corynebacterium glutamicum metabolic network. Biotechnol
Bioeng. 2009;102:583–97.
24. Chai X, Shang X, Zhang Y, Liu S, Liang Y, Zhang Y, Wen T. A novel pyruvate kinase and its application in lactic acid production under oxygen
depriva-tion in Corynebacterium glutamicum. BMC Biotechnol. 2016;16:79.
25. Jojima T, Igari T, Moteki Y, Suda M, Yukawa H, Inui M. Promiscuous activity of (S,S)-butanediol dehydrogenase is responsible for glycerol production
from 1,3-dihydroxyacetone in Corynebacterium glutamicum under
oxy-gen-deprived conditions. Appl Microbiol Biotechnol. 2015;99:1427–33. 26. Pauling J, Rottger R, Tauch A, Azevedo V, Baumbach J. CoryneRegNet
6.0-updated database content, new analysis methods and novel features focusing on community demands. Nucleic Acids Res. 2012;40:D610–4. 27. Mei J, Xu N, Ye C, Liu L, Wu J. Reconstruction and analysis of a
genome-scale metabolic network of Corynebacterium glutamicum S9114. Gene.
2016;575:615–22.
28. The UniProt C. UniProt: the universal protein knowledgebase. Nucleic Acids Res. 2017;45:D158–69.
29. Flamholz A, Noor E, Bar-Even A, Milo R. eQuilibrator—the biochemical thermodynamics calculator. Nucleic Acids Res. 2012;40:770–5. 30. Dominguez H, CocaignBousquet M, Lindley ND. Simultaneous
consump-tion of glucose and fructose from sugar mixtures during botch growth of
Corynebacterium glutamicum. Appl Microbiol Biotechnol. 1997;47:600–3.
31. Peifer S, Barduhn T, Zimmet S, Volmer DA, Heinzle E, Schneider K.
Metabolic engineering of the purine biosynthetic pathway in
Corynebac-terium glutamicum results in increased intracellular pool sizes of IMP and
hypoxanthine. Microb Cell Fact. 2012;11:138.
32. Frunzke J, Engels V, Hasenbein S, Gatgens C, Bott M. Co-ordinated
regula-tion of gluconate catabolism and glucose uptake in Corynebacterium
glutamicum by two functionally equivalent transcriptional regulators,
GntR1 and GntR2. Mol Microbiol. 2008;67:305–22.
33. Dominguez H, Rollin C, Guyonvarch A, Guerquin-Kern JL, Cocaign-Bousquet M, Lindley ND. Carbon-flux distribution in the central metabolic
pathways of Corynebacterium glutamicum during growth on fructose. Eur
J Biochem. 1998;254:96–102.
34. Dominguez H, Lindley ND. Complete sucrose metabolism requires
fructose phosphotransferase activity in Corynebacterium glutamicum to
ensure phosphorylation of liberated fructose. Appl Environ Microbiol. 1996;62:3878–80.
35. Wendisch VF, de Graaf AA, Sahm H, Eikmanns BJ. Quantitative determi-nation of metabolic fluxes during coutilization of two carbon sources:
comparative analyses with Corynebacterium glutamicum during growth
on acetate and/or glucose. J Bacteriol. 2000;182:3088–96.
36. Gerstmeir R, Wendisch VF, Schnicke S, Ruan H, Farwick M, Reinscheid D,
Eikmanns BJ. Acetate metabolism and its regulation in Corynebacterium
glutamicum. J Biotechnol. 2003;104:99–122.
37. Baumchen C, Knoll A, Husemann B, Seletzky J, Maier B, Dietrich C, Amoabediny G, Buchs J. Effect of elevated dissolved carbon dioxide
concentrations on growth of Corynebacterium glutamicum on d-glucose
and l-lactate. J Biotechnol. 2007;128:868–74.
38. Litsanov B, Brocker M, Bott M. Glycerol as a substrate for aerobic succinate
production in minimal medium with Corynebacterium glutamicum.
Microb Biotechnol. 2013;6:189–95.
39. Rittmann D, Lindner SN, Wendisch VF. Engineering of a glycerol utilization
pathway for amino acid production by Corynebacterium glutamicum.
Appl Environ Microbiol. 2008;74:6216–22.
40. Kang MK, Lee J, Um Y, Lee TS, Bott M, Park SJ, Woo HM. Synthetic biology
platform of CoryneBrick vectors for gene expression in Corynebacterium
glutamicum and its application to xylose utilization. Appl Microbiol
Biotechnol. 2014;98:5991–6002.
41. Yuan YB, Yang TH, Heinzle E. C-13 metabolic flux analysis for larger scale cultivation using gas chromatography-combustion-isotope ratio mass spectrometry. Metab Eng. 2010;12:392–400.
42. Kabus A, Georgi T, Wendisch VF, Bott M. Expression of the Escherichia
coli pntAB genes encoding a membrane-bound transhydrogenase in
Corynebacterium glutamicum improves l-lysine formation. Appl Microbiol
Biotechnol. 2007;75:47–53.
43. Bartek T, Blombach B, Lang S, Eikmanns BJ, Wiechert W, Oldiges M, Noh K, Noack S. Comparative C-13 metabolic flux analysis of pyruvate
dehydrogenase complex-deficient, l-valine-producing Corynebacterium
glutamicum. Appl Environ Microbiol. 2011;77:6644–52.
44. Ohnishi J, Mitsuhashi S, Hayashi M, Ando S, Yokoi H, Ochiai K, Ikeda M. A
novel methodology employing Corynebacterium glutamicum genome
information to generate a new l-lysine-producing mutant. Appl
Micro-biol Biotechnol. 2002;58:217–23.
45. Sagong HY, Kim KJ. Structural insight into dihydrodipicolinate reductase
from Corybebacterium glutamicum for lysine biosynthesis. J Microbiol
Biotechnol. 2016;26:226–32.
46. Xu JZ, Han M, Zhang JL, Guo YF, Zhang WG. Metabolic engineering
Corynebacterium glutamicum for the l-lysine production by increasing the
flux into l-lysine biosynthetic pathway. Amino Acids. 2014;46:2165–75.
47. Neuner A, Wagner I, Sieker T, Ulber R, Schneider K, Peifer S, Heinzle E.
Pro-duction of l-lysine on different silage juices using genetically engineered
Corynebacterium glutamicum. J Biotechnol. 2013;163:217–24.
48. Becker J, Klopprogge C, Schroder H, Wittmann C. Metabolic engineer-ing of the tricarboxylic acid cycle for improved lysine production by
Corynebacterium glutamicum. Appl Environ Microbiol. 2009;75:7866–9.
49. Becker J, Klopprogge C, Herold A, Zelder O, Bolten CJ, Wittmann C.
• We accept pre-submission inquiries
• Our selector tool helps you to find the most relevant journal
• We provide round the clock customer support
• Convenient online submission
• Thorough peer review
• Inclusion in PubMed and all major indexing services
• Maximum visibility for your research
Submit your manuscript at www.biomedcentral.com/submit
Submit your next manuscript to BioMed Central
and we will help you at every step:
glutamicum—over expression and modification of G6P dehydrogenase. J
Biotechnol. 2007;132:99–109.
50. Siebert D, Wendisch VF. Metabolic pathway engineering for production
of 1,2-propanediol and 1-propanol by Corynebacterium glutamicum.
Biotechnol Biofuels. 2015;8:91.
51. Blombach B, Riester T, Wieschalka S, Ziert C, Youn JW, Wendisch VF,
Eik-manns BJ. Corynebacterium glutamicum tailored for efficient isobutanol
production. Appl Environ Microbiol. 2011;77:3300–10.
52. Smith KM, Cho KM, Liao JC. Engineering Corynebacterium glutamicum for
isobutanol production. Appl Microbiol Biotechnol. 2010;87:1045–55. 53. Blombach B, Schreiner ME, Holatko J, Bartek T, Oldiges M, Eikmanns BJ.
(l)-Valine production with pyruvate dehydrogenase complex-deficient
Corynebacterium glutamicum. Appl Environ Microbiol. 2007;73:2079–84.
54. Masuda M, Takamatu S, Nishimura N, Komatsubara S, Tosa T.
Improve-ment of culture conditions for l-proline production by a recombinant
strain of Serratia marcescens. Appl Biochem Biotechnol. 1993;43:189–97.
55. Ahn J, Ryu A, Jang H, Jung JK. Effect of growth rate on the production of
l-proline in the fed-batch culture of Corynebacterium acetoacidophilum.
Biotechnol Bioprocess Eng. 2004;9:326–9.
56. Jensen JVK, Wendisch VF. Ornithine cyclodeaminase-based proline
pro-duction by Corynebacterium glutamicum. Microb Cell Fact. 2013;12:63.
57. Jensen JV, Eberhardt D, Wendisch VF. Modular pathway engineering of
Corynebacterium glutamicum for production of the glutamate-derived
compounds ornithine, proline, putrescine, citrulline, and arginine. J Biotechnol. 2015;214:85–94.
58. Moxley MA, Becker DF. Rapid reaction kinetics of proline dehydroge-nase in the multifunctional proline utilization a protein. Biochemistry. 2012;51:511–20.
59. Sleator RD, Gahan CGM, Hill C. Mutations in the listerial proB gene leading
to proline overproduction: effects on salt tolerance and murine infection. Appl Environ Microbiol. 2001;67:4560–5.
60. Hans S, Bathe B, Thierbach G. Mutant of the proB gene from coryneform
bacteria. US Patent 2009022043. 2013.
61. Theodosiou E, Frick O, Buhler B, Schmid A. Metabolic network capacity of
Escherichia coli for Krebs cycle-dependent proline hydroxylation. Microb
Cell Fact. 2015;14:108.
62. van Ooyen J, Noack S, Bott M, Reth A, Eggeling L. Improved l-lysine
production with Corynebacterium glutamicum and systemic insight into
citrate synthase flux and activity. Biotechnol Bioeng. 2012;109:2070–81. 63. Baumgart M, Mustafi N, Krug A, Bott M. Deletion of the aconitase
gene in Corynebacterium glutamicum causes strong selection
pres-sure for secondary mutations inactivating citrate synthase. J Bacteriol. 2011;193:6864–73.
64. Bott M. Offering surprises: TCA cycle regulation in Corynebacterium
glutamicum. Trends Microbiol. 2007;15:417–25.
65. Han SO, Inui M, Yukawa H. Effect of carbon source availability and growth
phase on expression of Corynebacterium glutamicum genes involved
in the tricarboxylic acid cycle and glyoxylate bypass. Microbiology. 2008;154:3073–83.
66. Thiele I, Palsson BO. A protocol for generating a high-quality genome-scale metabolic reconstruction. Nat Protoc. 2010;5:93–121.
67. Schellenberger J, Que R, Fleming RMT, Thiele I, Orth JD, Feist AM, Zielinski DC, Bordbar A, Lewis NE, Rahmanian S, et al. Quantitative prediction of cellular metabolism with constraint-based models: the COBRA Toolbox v2.0. Nat Protoc. 2011;6:1290–307.
68. Becker SA, Feist AM, Mo ML, Hannum G, Palsson BO, Herrgard MJ. Quan-titative prediction of cellular metabolism with constraint-based models: the COBRA Toolbox. Nat Protoc. 2007;2:727–38.
69. Ranganathan S, Suthers PF, Maranas CD. OptForce: an optimization procedure for identifying all genetic manipulations leading to targeted overproductions. PLoS Comput Biol. 2010;6:e1000744.
70. Shang X, Zhang Y, Zhang G, Chai X, Deng A, Liang Y, Wen T. Characteri-zation and molecular mechanism of AroP as an aromatic amino acid
and histidine transporter in Corynebacterium glutamicum. J Bacteriol.
2013;195:5334–42.
71. Zhang Y, Shang XL, Lai SJ, Zhang GQ, Liang Y, Wen TY. Development and application of an arabinose-inducible expression system by facilitating
inducer uptake in Corynebacterium glutamicum. Appl Environ Microbiol.
2012;78:5831–8.
72. Schäfer A, Tauch A, Jäger W, Kalinowski J, Thierbach G, Pühler A. Small
mobilizable multipurpose cloning vectors derived from the Escherichia
coli plasmids pK18 and pK19: selection of defined deletions in the
chro-mosome of Corynebacterium glutamicum. Gene. 1994;145:69–73.
73. Jakoby M, Ngouoto-Nkili C-E, Burkovski A. Construction and
applica-tion of new Corynebacterium glutamicum vectors. Biotechnol Tech.
1999;13:437–41.
74. Sambrook J, Russell DW. Molecular cloning: a laboratory manual. 3rd ed. Cold Spring Harbor: Cold Spring Harbor Laboratory Press; 2001. 75. Kalinowski J, Bathe B, Bartels D, Bischoff N, Bott M, Burkovski A, Dusch
N, Eggeling L, Eikmanns BJ, Gaigalat L, et al. The complete
Corynebacte-rium glutamicum ATCC 13032 genome sequence and its impact on the
production of l-aspartate-derived amino acids and vitamins. J Biotechnol.
2003;104:5–25.
76. Hoffmann J, Altenbuchner J. Hyaluronic acid production with
Corynebac-terium glutamicum: effect of media composition on yield and molecular
weight. J Appl Microbiol. 2014;117:663–78.
77. Lai SJ, Zhang Y, Liu SW, Liang Y, Shang XL, Chai X, Wen TY. Metabolic
engi-neering and flux analysis of for Corynebacterium glutamicum for l-serine
production. Sci China Life Sci. 2012;55:283–90.