RESEARCH
Conversion of H
2
and CO
2
to CH
4
and acetate in fed-batch biogas reactors
by mixed biogas community: a novel route
for the power-to-gas concept
Márk Szuhaj
1, Norbert Ács
1, Roland Tengölics
2, Attila Bodor
1, Gábor Rákhely
1,4, Kornél L. Kovács
1,3,4*and Zoltán Bagi
1Abstract
Background: Applications of the power-to-gas principle for the handling of surplus renewable electricity have been proposed. The feasibility of using hydrogenotrophic methanogens as CH4 generating catalysts has been demon-strated. Laboratory and scale-up experiments have corroborated the benefits of the CO2 mitigation via biotechnologi-cal conversion of H2 and CO2 to CH4. A major bottleneck in the process is the gas–liquid mass transfer of H2.
Results: Fed-batch reactor configuration was tested at mesophilic temperature in laboratory experiments in order to improve the contact time and H2 mass transfer between the gas and liquid phases. Effluent from an industrial biogas facility served as biocatalyst. The bicarbonate content of the effluent was depleted after some time, but the addition of stoichiometric CO2 sustained H2 conversion for an extended period of time and prevented a pH shift. The microbial community generated biogas from the added α-cellulose substrate with concomitant H2 conversion, but the organic substrate did not facilitate H2 consumption. Fed-batch operational mode allowed a fourfold increase in volumetric H2 load and a 6.5-fold augmentation of the CH4 formation rate relative to the CSTR reactor configuration. Acetate was the major by-product of the reaction.
Conclusions: Fed-batch reactors significantly improve the efficiency of the biological power-to-gas process. Besides their storage function, biogas fermentation effluent reservoirs can serve as large-scale bio CH4 reactors. On the basis of this recognition, a novel concept is proposed, which merges biogas technology with other means of renewable electricity production for improved efficiency and sustainability.
Keywords: Biomethane, Hydrogen, Carbon dioxide, Hydrogenotrophic methanogens, gas, Power-to-biomethane (P2B)
© 2016 Szuhaj et al. This article is distributed under the terms of the Creative Commons Attribution 4.0 International License (http://creativecommons.org/licenses/by/4.0/), which permits unrestricted use, distribution, and reproduction in any medium, provided you give appropriate credit to the original author(s) and the source, provide a link to the Creative Commons license, and indicate if changes were made. The Creative Commons Public Domain Dedication waiver (http://creativecommons.org/ publicdomain/zero/1.0/) applies to the data made available in this article, unless otherwise stated.
Background
Pressing deterioration of the global climate by human activities demands the large-scale replacement of fossil
fuels with renewable energy carriers [1]. The most rapidly
developing and spreading renewable technologies world-wide include the conversion of wind energy and direct
solar energy (photovoltaics) to electricity. In view of the discontinuous electricity production by these technolo-gies, coupled with fluctuating utilization, severe electric-ity storage problems arise, which are already apparent in countries where the implementation of renewables is well advanced. A likely solution of this emerging setback is conversion of electricity to alternative energy carriers
[2] or chemicals [3]. Hydrogen (H2) can be generated via
electrolysis of water, a well-known and efficient process
[4]; however, technologies to store and transport H2 are
underdeveloped at present. Methane (CH4) is an obvious
Open Access
*Correspondence: [email protected]
1 Department of Biotechnology, University of Szeged, Közép fasor 52, Szeged 6726, Hungary
next candidate. CH4 can be transported and stored
con-veniently in the existing natural gas grid and can be used in all applications where fossil natural gas is employed
today. Biogenic CH4 production takes place during
anaerobic degradation of organic matter in biogas
reac-tors, swamps, ruminants, termites, etc. [2]. The last step
of these complex microbiological metabolic pathways is biogas formation by methanogens. These microbes are strict anaerobes belonging in the kingdom Archaea. Some methanogens split acetate and release a mixture of
CH4 and CO2 (acetotrophic methanogens), while others
form CH4 by reducing CO2 with H2 (hydrogenotrophic
methanogens) and there are methanogens which are able to carry out both reactions.
An additional advantage of the biological conversion of
electricity to CH4 is offered by coupling the process with
CO2 mitigation. CO2 can be transformed by catalytic
reduction using chemical reactions [5, 6], photosynthesis
[7], bioelectrochemical processes [8–10], or
methano-genesis [2].
Three main ingredients should be present to form
bio-genic CH4 from CO2: hydrogenotrophic methanogens,
CO2, and a suitable reductant. Recent metagenomic
stud-ies have revealed that hydrogenotrophic methanogens predominate among Archaea in most biogas microbial
communities [11–17].
CO2 can originate from flue gas [18] or from the
biogas itself [19–22]. In the latter approach, a significant
upgrading of the produced biogas has been achieved. In some cases, the anaerobic degradation of the biomass has
provided the electron source [18, 23]; in other studies,
H2 gas has been employed [19, 20, 22, 24]. These
experi-ments have revealed that the poor solubility of H2 limits
the yield and rate of CH4 formation. In these
configura-tions, H2 is injected into a methanogenic reactor filled
with a microbial consortium.
In the present study, fed-batch fermentation systems
with the daily dispensing of H2 gas were employed in
order to partially overcome the H2 solubility problem.
Several operational conditions (see “Methods” section)
were tested under mesophilic conditions and efficient
CH4 productivity was attained. Moreover, at the
appro-priate combination of CO2 and H2, the simultaneous
formation of acetate and CH4 as main products was
observed.
Results
Effect of mixing
Given the experimental conditions (see “Methods”
sec-tion) and the poor solubility of H2 in the aqueous phase,
the optimal mixing conditions yielding the most efficient
delivery of H2 from the gas phase had to be determined.
The reaction vessels were incubated in an orbital shaker
at various mixing speeds (rpm). Figure 1 indicates that
there is an optimum value for this parameter; in our arrangement, it was 150–160 rpm. It is noteworthy that
at higher mixing rates CH4 production decreased sharply
in contrast to earlier observations at thermophilic
tem-perature [19]. In all subsequent experiments, the shaker
was set at 160 rpm. It is evident that this mixing rate is valid under our conditions and henceforth was applied consistently in order to limit the number varying param-eters. In other systems, the optimal mixing conditions should be determined individually. The main conclusion from these experiments was that the mixing that yields
optimal H2 utilization may not be the maximum
achiev-able mixing rate.
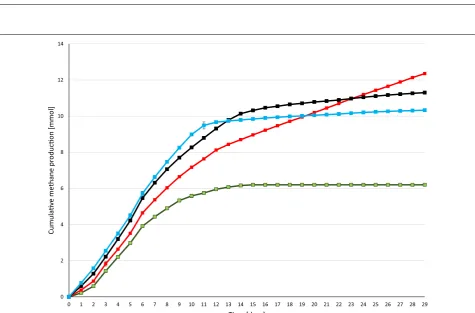
Optimization of H2 dosage
Next the optimal daily H2 dosage was established.
Vari-ous volumes of H2 were therefore injected into the batch
reactors, which were treated identically in all other known aspects. The batch fermentations were started by adding 0.3 g of α-cellulose as substrate for AD according
to the VDI (Verein Deutscher Ingenieure, protocol [25].
H2 gas was injected every day and the consumption of H2
was followed by gas chromatography. Cumulative CH4
evolution curves are plotted in Fig. 2. CH4 production
proceeded steadily for 7–8 days in the control reactors,
which received no daily H2 dosage, but from day 12
prac-tically no gas evolved. In total, 6.2 ± 0.54 mmol of CH4
was generated from the residual biogas potential of the sludge and added α-cellulose substrate. 1.62 mmol of this quantity originated from the sludge and 4.58 mmol from
the α-cellulose substrate. The biochemical CH4 potential
of α-cellulose is 4.71 [26] and therefore all of the added
substrate was consumed by the community and was
con-verted to CH4. Addition of a daily 0.81 ± 0.16 mmol of H2
gas into the headspace of the batch reactors dramatically
increased the CH4 production (Fig. 2). The GC
measure-ments revealed that all of the injected H2 was completely
consumed by the microbes within 24 h. In separate experiments, it was established more precisely that under
these conditions all the H2 had vanished from the
head-space after 16 h and CH4 evolution started at hour 2
fol-lowing H2 injection (data not shown). A new dosage of
H2 was dispensed consistently every 24 h. Increasing the
total H2 load to 43.00 ± 1.43 mmol resulted in a
some-what faster initial CH4 production, but the
cumulative-specific CH4 production was lower than in the case of
adding 24.42 ± 0.81 mmol of H2 in the same period of
time. In line with this observation, H2 started to
accu-mulate in the headspace on day 14 and from day 17–18
CH4 production ceased. On further increase of the
overall H2 injection volume to 55.69 ± 1.85 mmol, i.e.,
0 20 40 60 80 100 120 140
250 200
150 100
50 0
Pr
oduced methane [ml]
Shaking speed [rpm]
Fig. 1 Dependence of the CH4 production on shaking speed
0 2 4 6 8 10 12 14
0 1 2 3 4 5 6 7 8 9 10 11 12 13 14 15 16 17 18 19 20 21 22 23 24 25 26 27 28 29
Cumulav
e methane pr
oducon [mmol]
Time [days]
CH4 was yielded. In these reactors, H2 build-up in the
headspace started sooner, i.e., on day 10 and CH4
evo-lution stopped completely on day 13. Overall, these results indicated that the system utilized the α-cellulose substrate within 7–8 days and the microbial
commu-nity sustained its H2 conversion activity for an extended
period of time if the daily H2 injection did not exceed
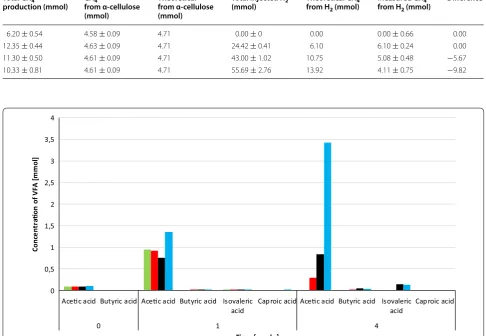
0.81 ± 0.16 mmol of H2 (Table 1). The concentrations of
organic acids were determined every week. Acetate lev-els increased significantly by the end of the experimental period. 3.43 mM acetate accumulated by the end of the experiment in the reactors receiving 55.69 ± 1.85 mmol
of H2, which exceeded the recommended threshold, but
apparently this alone did not explain why CH4
evolu-tion stopped in the reactors loaded with higher daily H2
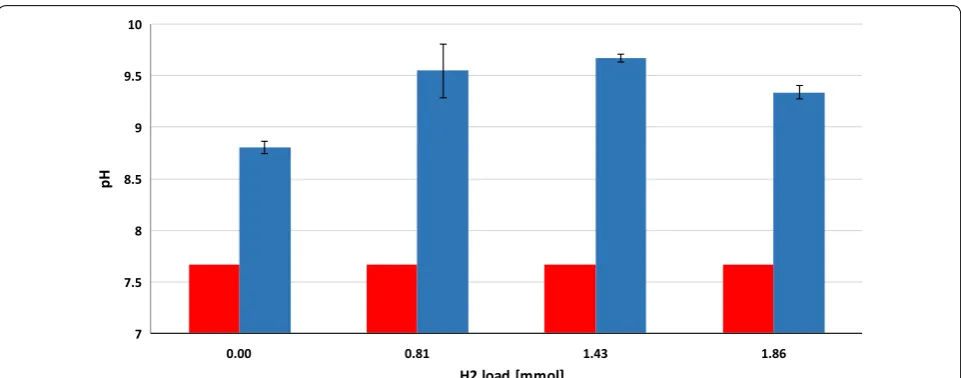
injections (Fig. 3). The pH had increased considerably
by the end of the 4-week experiments (Fig. 4),
indicat-ing a severe loss of the bicarbonate bufferindicat-ing capacity of
the inoculum sludge. It is noteworthy that the pH also shifted by 1.1 units in the control reactors which were
not fed with H2. In order to employ the same protocol,
these vessels were also degassed and filled with N2 gas
every day. It is therefore likely that the daily replacement of the headspace prompted a gradual desorption and loss
of dissolved CO2 and caused a shift in the bicarbonate
buffering system [27, 28]. The pH increased even
fur-ther, i.e., beyond pH = 9, which is a critical upper limit
for the methanogenesis [29]. A similar exhaustion of the
buffering capacity upon H2 addition was noted in
previ-ous reports [19, 20]. The system could apparently
toler-ate high pH fairly well when 0.81 ± 0.16 mmol of H2 was
the daily dosage, but started to inhibit CH4
biosynthe-sis on day 13 and 10 upon addition of daily 1.43 ± 0.28
or 2.86 ± 0.38 mmol of H2, respectively. In this
experi-mental set-up, it was not possible to determine the time points when the inhibitory pH range was attained. The
Table 1 Origin and balance of CH4 formation in the fed-batch reactors supplied with α-cellulose at the start of the experi-ment and with various amounts of daily H2
Total CH4
production (mmol) CHfrom α-cellulose 4 (mmol)
Theoretical from α-cellulose (mmol)
Total injected H2
(mmol) Theoretical CHfrom H2 (mmol)4
Measured CH4
from H2 (mmol)
Difference
6.20 ± 0.54 4.58 ± 0.09 4.71 0.00 ± 0 0.00 0.00 ± 0.66 0.00
12.35 ± 0.44 4.63 ± 0.09 4.71 24.42 ± 0.41 6.10 6.10 ± 0.24 0.00
11.30 ± 0.50 4.61 ± 0.09 4.71 43.00 ± 1.02 10.75 5.08 ± 0.48 −5.67
10.33 ± 0.81 4.61 ± 0.09 4.71 55.69 ± 2.76 13.92 4.11 ± 0.75 −9.82
0 0,5 1 1,5 2 2,5 3 3,5 4
Acec acid Butyric acid Acec acid Butyric acid Isovaleric
acid Caproic acid Acec acid Butyric acid Isovalericacid Caproic acid
4 1
0
Conc
en
tr
a
on
o
f VF
A [
mmo
l]
Time [weeks]
results indicated that the likely reason for the
obstruc-tion of CH4 formation was the limiting buffering capacity
of the system due to the low bicarbonate concentration.
The optimal amount of daily H2 dosage in this system was
within the range of 0.8–1.5 mmol of H2; further
experi-ments should determine the exact value.
Effect of CO2 addition
In the next series of batch fermentations, the inoculum originated from the same mesophilic industrial biogas plant, but at different points of time, and therefore small fluctuations of organic total solid content and microbial community composition should be taken into account when the results are subjected to direct comparison. The initial addition of α-cellulose was omitted in order to
avoid any disturbing effect of the CH4 generation from
the substrate. The duration of these fermentations was
extended to 80 days to test for sustainable CH4
produc-tion. The reactors were supplied with the optimal daily
dosage of 0.81 mmol of H2 in order to check if the CO2/
bicarbonate buffering capacity was indeed the major
limiting factor in the previous experiments [28, 30]. The
daily CH4 volumes measured in the headspace are
plot-ted in Fig. 5. CH4 evolution progressed steadily until
day 28, but dropped sharply afterwards. A warning sign of system failure was noticed already on day 27, when
measurable residual H2 was detected in the headspace
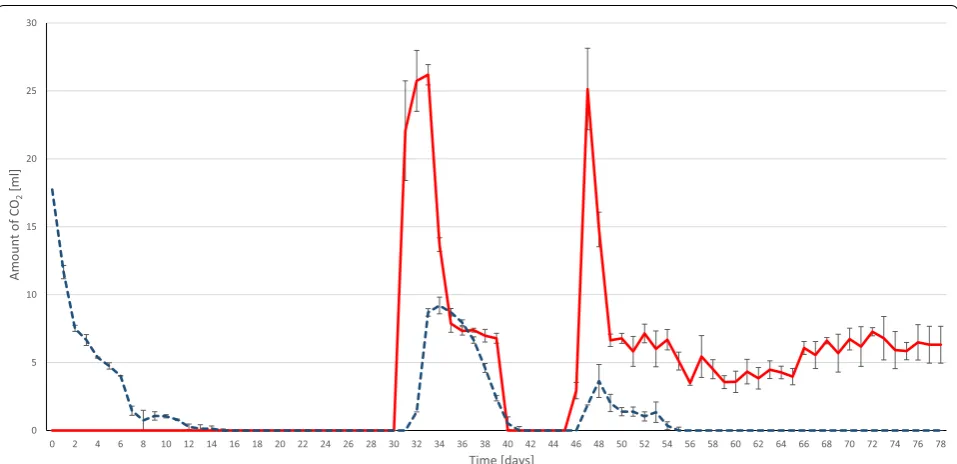
(Fig. 5; Table 2). As shock therapy, massive CO2
injec-tion (25 mL) was dispensed into the reactors following
the daily dosage of H2 on day 31 (Fig. 6). All of this CO2
disappeared from the gas phase within 24 h, indicating
that the system was indeed severely depleted of CO2/
bicarbonate. The same CO2 treatment was repeated next
day, which apparently restored the functional state of the
system signaled by the build-up of residual CO2 in the
headspace (Fig. 6). The daily CO2 dose was then
gradu-ally decreased to the stoichiometric volume, i.e.,
approxi-mately 0.25 mol of CO2/mol of H2 per day. The system
responded positively, as exhibited by the restoration of
CH4 production on day 32 accompanied by a gradual
decrease of residual CO2 levels in the gas phase. Daily
CO2 injection was stopped on day 41. H2 accumulation
commenced again almost immediately and was
accom-panied by the loss of CH4-evolving ability from day 43,
and therefore CO2 injection (25 mL) was resumed on day
47. Detectable remaining CO2 was noticed already on the
next day and from this time on a daily dosage of 0.25 mol
of CO2/mol of H2 of CO2 was maintained until the end
of the experiment. CH4 production returned to the
previ-ous level, all of the injected daily H2 and CO2 were
con-sumed within 24 h and this continued for an additional month. It is noteworthy that, except for pH bursts on
days 31 and 45, the pH in both the control and H2-fed
reactors remained within the acceptable limit of pH ≤8.5 throughout the investigated period (data not shown).
Several deductions could be drawn from this series of
tests. First, the system becomes depleted of CO2 if
semi-continuous H2 feeding and daily degassing are
admin-istered to the fed-batch system. This phenomenon was manifested after about 1 month in our arrangement, where daily degassing and replacement of the headspace were included to retain the same protocol in the control and experimental reactors. Clearly daily degassing is not
necessary in industrial setting. Second, the residual H2
accumulation in the gas phase is a good early warning
sign of upcoming system failure due to CO2 exhaustion.
7 7.5 8 8.5 9 9.5 10
1.86 1.43
0.81 0.00
pH
H2 load [mmol]
Third, the microbial community participating in the CH4
generation process recuperates quickly and completely even after repeated system failure if the process control is alerted in time. Fourth, the microbial community supplied
only with H2 and CO2 upholds the pH within the normal
operating range. Finally, stoichiometric administration of
H2 and CO2 yields a practically complete conversion to
pure CH4 within 24 h under mesophilic conditions.
Effect of additional substrate addition
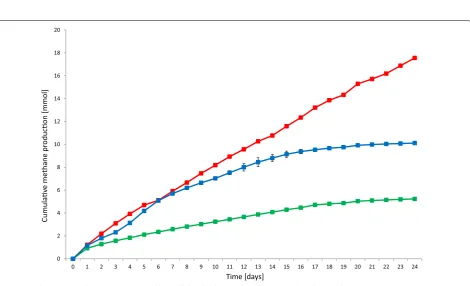
Next, it was tested whether the addition of α-cellulose
affected the CH4 productivity from H2. Two series of
exper-iments were designed and the duration of the experimental period was shortened in order to avoid any complication
due to CO2 depletion and concomitant pH elevation. In the
first set of batch fermentations (Fig. 7), various amounts
of α-cellulose were added only at the start of the
experi-ments, and in the second series (Fig. 8) the addition of the
same amount of α-cellulose was repeated every week. Daily
replacement of the headspace with N2 and the injection of
0.81 mmol of H2 was maintained in all reactors.
There was no significant difference between the
CH4 productions from H2 in the reactors receiving the
substrate quantity recommended by the VDI [25]
pro-tocol as compared with those without substrate, i.e., the
difference between the green and red curves in Fig. 7
cor-respond solely to the CH4 produced from α-cellulose. This
suggests that the addition of substrate at the beginning of
the fermentation does not assist CH4 evolution from H2.
Moreover, an inhibition of CH4 productivity from H2 was
noted when the substrate load was doubled, i.e., upon the
addition of 0.6 g substrate, 3.47 ± 0.08 mmol of CH4 was
formed from α-cellulose instead of the theoretical
poten-tial of 9.42 mmol of CH4. It should be noted that the H2
consumption rate remained unaffected by the substrate
loading, i.e., the injected H2 disappeared from the
head-space within 24 h. The conversion efficiency of CH4
for-mation from H2 was estimated from the daily CH4 levels
in the headspace. The day-to-day values fluctuated con-siderably during the experimental period and achieved an
average of 72 ± 25 %. The remainder of the H2 may have
been metabolized in alternative pathways, which are the subject of future studies.
In the next set of experiments, the reactors were fed with the same amount (0.3 g) of α-cellulose every week and the
daily H2 injection (0.81 mol H2) was maintained. The aim
0 0.1 0.2 0.3 0.4 0.5 0.6 0.7 0.8 0.9
0 1 2 3 4 5 6 7 8 9 10 11 12 13 14 15 16 17 18 19 20 21 22 23 24 25 26 27 28 29 30 31 32 33 34 35 36 37 38 39 40 41 42 43 44 45 46 47 48 49 50 51 52 53 54 55 56 57 58 59 60 61 62 63 64 65 66 67 68 69 70 71 72 73 74 75 76 77 78 79
Gas concentraon [mmol]
Time [days]
was to test whether the microbial community remained intact for an extended period of time after the expiration of its residence time in the industrial AD facility and to
see whether the metabolically active community
facili-tated the bioconversion of H2 to CH4. The cumulative
CH4 production increased almost linearly and the amount
Table 2 Comparison of process parameters between CSTR (Bassani et al. 2015) and fed-batch (present work) bioCH4
pro-duction approaches
a Mesophilic data b Estimated from daily dose
c At the end of the experiment; nd not determined
Bassani et al. (2015)a Present work
No external CO2 External CO2 added
Control H2 added Control H2 added Control H2 added
Biogas composition (%)
CH4 69.7 ± 0.3 88.9 ± 2.4 17.71 ± 1.15 79.77 ± 2.31 0.00 95.53 ± 1.79
CO2 30.3 ± 0.3 8.8 ± 3.2 73.63 ± 3.61 17.71 ± 0.90 0.00 4.47 ± 1.34
H2 0 2.3 ± 1.8 0.0 2.51 ± 0.82 0.0 0.00
Gas production (mL L−1 h−1)
CH4 2.75 ± 0.58 4.17 ± 0.50 1.51 ± 0.07 6.78 ± 0.20 0.00 ± 0.00 6.21 ± 0.12
CH4 from H2 0.0 1.41 0.00 4.27 0.00 6.21
CO2 1.21 ± 0.25 0.42 ± 0.13 4.20 ± 0.21 1.51 ± 0.08 0.00 ± 0.00 0.29 ± 0.09 H2 injection rate (mL L−1 h−1) 0.00 8.00 ± 1.17 0.00b 22.66 ± 0.20b 0.00b 20.96 ± 0.23b H2 consumption (mL L−1 h−1) 0.0 7.42 ± 1.08 0.00 ± 0.00 22.44 ± 0.19 0.00 ± 0.00 20.96 ± 0.02
H2 consumption (%) 0.0 92.7 0.0 99.06 0.0 100.00
pH 7.74 ± 0.16 8.17 ± 0.04 8.66 ± 0.19c 9.38 ± 0.11c 8.29 ± 0.04c 7.89 ± 0.20c Organic acids (mM)
Acetate nd nd nd nd 0.33 1.48
Butyrate nd nd nd nd 0.00 0.04
Isovalerate nd nd 0.02 0.10
0 5 10 15 20 25 30
0 2 4 6 8 10 12 14 16 18 20 22 24 26 28 30 32 34 36 38 40 42 44 46 48 50 52 54 56 58 60 62 64 66 68 70 72 74 76 78
Amount of CO
2
[ml]
Time [days]
0 1 2 3 4 5 6 7
0 1 2 3 4 5 6 7 8 9 10 11 12 13 14 15 16 17 18 19 20
Cumulav
em
ethane
pr
oduco
n[
mmol
]
Time [days]
Fig. 7 Cumulative CH4 production at various initial α-cellulose loadings: 0 g (green), 0.3 g (red), and 0.6 g (blue)
0 2 4 6 8 10 12 14 16 18 20
0 1 2 3 4 5 6 7 8 9 10 11 12 13 14 15 16 17 18 19 20 21 22 23 24
Cumulav
e methane pr
oduco
n[
mmol
]
Time [days]
formed suggested an unchanged reaction rate for both
α-cellulose and H2 when the VDI protocol [25] was
fol-lowed (Fig. 8). It is noteworthy that increasing the weekly
α-cellulose load prompted a strong inhibitory effect. The
collapse of the CH4-forming activity was not associated
with changes in pH. Without α-cellulose, the daily
dos-age of H2 caused an increase of the pH into the
danger-ous zone, as observed earlier (Fig. 4), due to the depletion
of the buffering capacity. Weekly supply of the substrate balanced the pH; the degradation of the α-cellulose
appar-ently yielded enough CO2 to maintain stable operation.
Too much substrate, e.g., 0.6 g α-cellulose/week, shifted the pH to lower values, although it did not fall below 6.5,
which is usually considered detrimental [29]. The
accu-mulation of acetate increased dramatically upon substrate overloading (data not shown). This might have been the likely reason for the process inhibition. It is important to
note that the H2 conversion yields in this series of
experi-ments were close to 100 %, which emphasizes the impor-tance of the inoculum quality.
Discussion
Storage of surplus electricity is a growing demand in renewable energy technology, with the generation of electricity in an inherently fluctuating mode of opera-tion, such as wind and direct solar, gaining a rapidly increasing market share. In a popular strategy, electricity
is used to split water and generate H2 and O2. There are
no mature technologies available for handling H2 today,
and its conversion to CH4 therefore seems preferable. In
this scheme, electricity is transformed into CH4, which is
then stored and transported easily via the existing natural
gas grids. Chemical methods to reduce CO2 with H2 have
been known for some time and earned the Nobel prize
for Paul Sabatier in 1912 [31]. The process requires high
temperature, high pressure, and metal catalysts. In
alter-native electrochemical means of CO2 mitigation,
electri-cal energy input is the driving force [3, 9, 30]. Biological
systems can solve the same task under mild conditions in an environmentally friendly manner. The life of hydrog-enotrophic methanogens, an odd group of Archaea, relies on the same reaction, which is catalyzed by enzymes at ambient temperature and pressure. The biological route of the power-to-gas process, which is here named as power-to-biomethane (P2B), has been recognized and
tested in laboratory and scale-up works [19, 22, 24, 32].
These studies have established that microbes are exceed-ingly efficient catalysts for the P2B process. Hydrogeno-trophic methanogens are difficult to cultivate in pure culture, but they are readily available in the mixed culture of effluents from the anaerobic degradation of organic matter, i.e., the fermentation effluent of biogas plants. The
rate-limiting step in the work of CH4-forming microbial
cell factories is the low solubility of H2 in the aqueous
environment. In previous studies [19, 22, 24, 32],
contin-uously-operating fermentation systems were employed as a rule, which offer several advantageous features for pro-cess control and management, but allow short residence
time for the injected H2 gas.
In our approach, the fed-batch fermentation technique was selected to increase the contact interaction between the gaseous substrate and the biocatalyst methanogens. It was established that an optimal mixing rate has to be upheld in any P2B system in order to facilitate the
disso-lution of H2 into the aqueous phase where the microbes
and dissolved CO2 reside.
Although CO2 is readily soluble in the aqueous
medium, it may become an overall limiting factor if removed from the system either by vigorous reaction
with H2 or by degassing the reactors. Depletion of CO2
was accompanied by the elevation of pH, which might be precarious for the activity of hydrogenotrophic methanogens.
CO2 is supplied by the biogas-generating process itself
[19, 22] or can be provided from outside sources, e.g.,
flue gas from internal combustion engines. Consumption
of the greenhouse gas CO2 by the process is an additional
benefit of the P2B technology from an environmental point of view. Addition of an organic substrate may revi-talize the entire biogas microbial community, which
gen-erates additional CO2 and thereby stabilizes the pH, but
does not facilitate the conversion of H2 to CH4. A proper
feeding routine in the fed-batch system leads to a
sus-tained high rate of CH4 formation and the process may
operate efficiently for an extended period of time.
Comparison with previous works
Our approach to improve the P2B principle attempts to
counteract the low solubility of H2 in the aqueous
envi-ronment by increasing the contact time of the gas and aqueous phases in a fed-batch fermentation arrange-ment. This has not been tested earlier.
There are four previous reports available to measure
up against this approach. Lee et al. [24] used a fixed-bed
reactor, while Reuter [32] developed several versions of a
continuous stirred tank reactor (CSTR) design and scaled up the process to an industrial level. Both studies con-cluded that hydrogenotrophic methanogens in pure or mixed culture were markedly efficient catalysts and
con-verted H2 and CO2 to CH4 in surprisingly high yields and
rates. Unfortunately, the published results from those studies contain limited data on process parameters to compare with the fed-batch system examined in the pre-sent study.
Two recent papers from the Angelidaki team [19, 22]
Their thoughtfully designed and thoroughly documented reports provided data allowing the assessment with our
study. Table 2 summarizes the results.
Besides the use of distinct reactor arrangements and sizes, i.e., fed-batch versus CSTR, several operational parameters differed in those studies from our set-up, e.g., inoculum composition and quality, substrate used for
CH4 generation, stirring mode and speed. Therefore, only
the major tendencies and not the exact values are suitable for a rigorous comparison.
It was found that at high shaking speed the H2
conver-sion process may not be limited by the gas–liquid mass
transfer [19] at thermophilic temperature. In our
experi-ence, this observation could not be repeated under
meso-philic conditions, and above 160 rpm CH4 formation was
inhibited (Fig. 1). It was concluded that the process in our
system was critically limited by the mass transfer of H2
at the gas–liquid interface. Hydrogenotrophic
methano-gens utilized the dissolved H2 at a high rate, and therefore
a concentration gradient developed between the liquid
and gas phases, driving H2 into the liquid compartment
from the headspace as time advanced. It is likely that the fed-batch operation optimized the condition where the
amount of H2 transferred into the liquid phase was close
to the amount consumed by the microbes. The data
pre-sented in Table 2 clearly indicate that this was indeed the
case.
In the CSTR work, H2 was dosed on the basis of the
available CO2 from the coupled biogas production
[22]. Although significant upgrading of the biogas was
achieved, this stipulation limited the rate and amount
of H2 injection into the system. The goal in these
inves-tigations was to achieve maximal H2 conversion yield.
H2 bubbles are difficult to retain in the aqueous system,
and diffusers and very low purging rates therefore had to
be applied to facilitate the dissolution of H2 and its
con-version to CH4 during the short residence time of the
gaseous substrate in the reactor. In the fed-batch
configu-ration, the H2 loading rate could be increased to 4 times
that of the CSTR operational mode without the loss of H2
(Table 2).
In the present study, mesophilic conditions were
main-tained. Bassani et al. [22] carried out their experiments at
35 and 55 °C under otherwise identical conditions. A
sig-nificant improvement in CH4 formation rate was noted
at higher temperature. A similar effect can be expected in the fed-batch system; this will have to be established in future studies. A comparison between our mesophilic data with those obtained at thermophilic temperature
indicates a 2.0 [19] and 2.7 [22] times higher CH4
pro-duction rate from H2 in the mesophilic fed-batch reactors
as compared with the thermophilic CSTR, respectively.
The mesophilic process performance parameters of
Bassani et al. [22] can be compared directly with our
results reported under the “Effect of CO2 addition”
subti-tle above. Two sections of stable operation in our experi-mental period were taken into account, i.e., the initial
phase without external CO2 addition between days 2 and
28 and the part when stoichiometric CO2 and H2 were
injected daily (days 50–80) (Figs. 5, 6). To make a fair
assessment, the residual CH4 production in the control
reactors (no H2 added) should be taken into account.
The control samples in our work started at an
unusu-ally low CH4/CO2 ratio (Table 2), which could be due to
the residual biogas potential of the inoculum and the fact
that all H2 was removed during initial degassing of the
reactors. Therefore, the activity of the hydrogenotrophic
methanogens was severely restricted until some H2
became available from the fermentation of the residual, small amount of biomass. The situation changed
dramati-cally in the reactors receiving H2 injections and the
sys-tem produced bio CH4 of high purity, i.e., containing only
17.71 % CO2.
There was a 6.5-fold increase in CH4 yield from H2 in
the fed-batch system relative to the mesophilic CSTR
experiments if a stoichiometric amount of CO2 was
added to both systems together with the H2 (Table 2).
Moreover, the fed-batch system operated at a 4-times
higher H2 load than the CSTR reactor. The H2
consump-tion was above 90–100 % in both systems, indicating that the reaction was carried out very efficiently in both systems. The CSTR operation mode has its benefits and advantages, but apparently does not help overcome the
low H2 solubility problem, which seems to be the major
bottleneck in the accomplishment of the P2B principle at mesophilic temperature.
As an added value, it should be noted that in the fed-batch system a considerable accumulation of acetate takes place without any observable sign of
acidosis-related process failure (Fig. 9). The accumulation of
ace-tate was probably due to the inhibition of acetoclastic
methanogenesis and syntrophic acetate oxidation [33] by
the high H2 doses. Acetate is a valuable commodity [30,
34] and, if acetate can be recovered by a suitable
tech-nology from the reaction mixture, it would be a useful side-product of the fed-batch fermentation-based P2B technology.
Conclusions
A general strategy can be proposed on the basis of the results reported above to utilize the microbial com-munity formed in the biogas reactor for the efficient
conversion of H2 to CH4 as part of the P2B principle.
unambiguously corroborated that microbiological cell
factories are very efficient catalysts to combine H2 and
CO2 to CH4, a renewable energy carrier that has already
been in use in human practice for many years as fossil natural gas. The suitable microbial community is freely available in the effluent of anaerobic fermentation at the biogas plants operating word-wide in millions of installa-tions at various levels of sophistication.
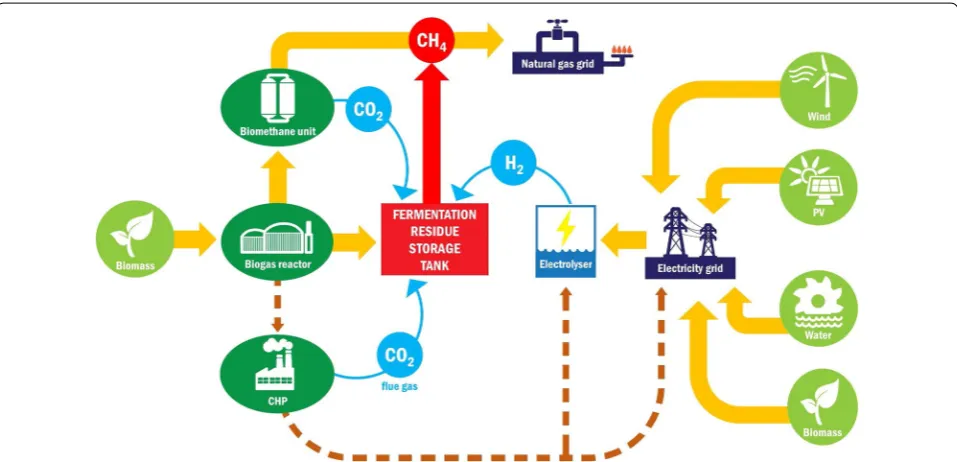
At the center of the projected strategic alliance compris-ing either of the methods yieldcompris-ing renewable electricity
and biogas technology (Fig. 10) are the hydrogenotrophic
methanogens present in the biogas effluents. They convert
H2, which is produced from excess electricity by
electrol-ysis, to CH4. BioCH4 is relatively easily stored and
trans-ported with minor loss in the natural gas grids over large
distances and used as energy carrier, biofuel or basic
com-modity [35], and several technological improvements of
bioCH4 production [36] have been therefore developed.
The proposed novel strategy places biogas technology into the hub of the renewable energy production and utiliza-tion network. The biogas effluent reservoir, which forms part of most industrial-scale biogas facilities and stores the digested material until its utilization as organic fertilizer, acquires an entirely new function by becoming a
bioreac-tor to transform green electricity-derived H2 into bioCH4.
The gas to liquid volumetric ratio is lower in industrial-scale effluent reservoirs than the ratio used in our experi-ments, and installation of a gas recirculation system may therefore be required in the large-scale applications.
The potential economic advantages consequent from
the scheme recommended in Fig. 10 are numerous. First,
the microbial community present in the biogas efflu-ent can be directly exploited for the efficiefflu-ent conversion
of H2 and CO2 to CH4. Second, this biological catalyst
is continuously formed at the biogas plants at no addi-tional cost. Third, the microbial community participating in the process is well organized and able to carry out the task under various environmental conditions very effi-ciently. Fourth, the process is easily manageable, and the microbial community flexibly tolerates the “turn-on” and “turn-off” situations. Fifth, the product is practically pure
bioCH4 needing no further purification. Sixth, the
pro-cess also accomplishes a CO2 sink and therefore directly
contributes to CO2 mitigation.
0 0.2 0.4 0.6 0.8 1 1.2 1.4 1.6
Acec acid Butyric acid Isovaleric acid
0 80
Conc
en
tr
a
on of
VF
A
[m
M]
Time [days]
Fig. 9 Distribution of volatile fatty acids in the control (blue) and (H2+ CO2)-fed (red) reactors. Experimental conditions as in Fig. 5
The biogas installations may therefore complement
their current operation by becoming bioCH4 producers
and improve the economy of their technology without substantial additional investments.
Methods
The batch fermentation system
The total volume of the reactors was 160 mL (Wheaton glass serum bottle, Z114014 Aldrich). All the samples were run in 3 parallel biological replicates. The reactors routinely contained 40 mL inoculum from the mesophilic industrial biogas plant Zöldforrás Ltd., Szeged, Hungary. The main substrates at Zöldforrás are maize and sweet sorghum silage and pig manure in 80:20 total organic solid ratio. The inoculum was sieved on a 1 mm filter in order to remove the larger particles and was used without
further treatment according to the VDI protocol [25]. In
each set of experiments, three control reactors containing only the inoculum were included. The calculated amount of solid α-cellulose (C8002 Sigma) was added into the
reactors when needed (Table 3). 0.3 g of α-cellulose was
routinely added as substrate, as described in the VDI
pro-tocol [25]. The daily H2 dosage was 0.81 ± 0.16 mmol,
unless indicated otherwise. The reactors were sealed with butyl septa and aluminum crimps and were made
anaerobic by N2 gas exchange of the headspace (5 min).
Following the daily gas composition analysis by gas chro-matography (GC), the gas phases of the reactors were
degassed by purging with N2 (Messer nitrogen 4.5) for
5 min and the internal pressure was adjusted to
atmos-pheric level. H2 and CO2 were injected manually and
daily into the gas phase with disposable plastic syringes
according to the experimental protocol (Table 3). The
amount of the injected gas was verified by GC. The reac-tors were incubated in a rotary shaker at 37 °C.
Organic acid analysis
Samples for organic acid analysis were taken from the liquid phase of the reactors. The samples were centri-fuged (13,000 rpm for 10 min,) and the supernatant was filtered through PES centrifugal filter (PES 516-0228, VWR) at 14,000 rpm for 20 min. The concentrations of volatile organic acids were measured with HPLC (Hitachi LaChrome Elite) equipped with refractive index detec-tor L2490. The separation was performed on an ICSep ICE-COREGEL—64H column. The temperature of the column and detector was 50 and 41 °C, respectively. The
eluent was 0.01 M H2SO4 (0.8 mL min−1).
Gas composition analysis
The gas composition of the reactor headspace was
measured every day by GC. The CH4 and H2 contents
were determined with an Agilent 6890 N GC (Agi-lent Technologies) equipped with an HP Molesive 5 Å (30 m × 0.53 mm × 25 µm) column and a TCD detector. The temperature of the injector was 150 °C and applica-tion was made in split mode 0.2:1. The column tempera-ture was maintained at 60 °C. The carrier gas was Linde
HQ argon 5.0, with the flow rate set at 16.8 mL min−1.
The amount of CO2 was determined with a Shimadzu
GC 2010 (Shimadzu Corporation) equipped with a TCD
detector and a HP PlotQ (30 m × 0.5 mm × 40 µm)
column. The chromatograph was applied in split injec-tion mode (rate 0.5:1). The temperature of the inlet was 200 °C. The column and the detector temperature were maintained at 90 and 150 °C, respectively. The applied
carrier gas was Messer nitrogen 4.5 at 8.4 mL min−1.
The samples were injected with the help of a gastight
microsyringe (Hamilton). The conversion efficiency of H2
to CH4 was calculated by the modified theoretical
equa-tion [15].
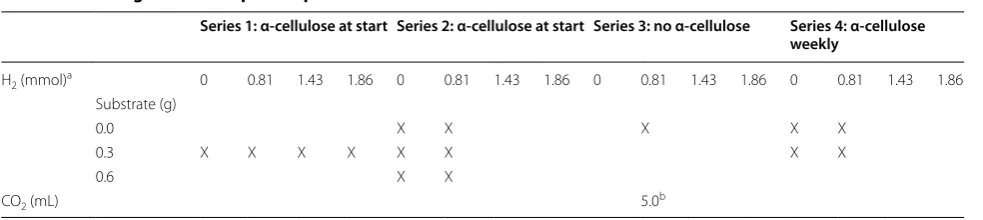
Table 3 The design of the sample compositions in the various sets of fed-batch reactors
X indicates the inclusion of the marked component in the reactors. For other experimental conditions see “Methods” section
a Daily injection
b Between day 50 and 80 (see text)
Series 1: α-cellulose at start Series 2: α-cellulose at start Series 3: no α-cellulose Series 4: α-cellulose weekly
H2 (mmol)a 0 0.81 1.43 1.86 0 0.81 1.43 1.86 0 0.81 1.43 1.86 0 0.81 1.43 1.86
Substrate (g)
0.0 X X X X X
0.3 X X X X X X X X
0.6 X X
where “A” is the experimental reactor and η = conversion
efficiency of H2 to CH4 (%) rCH4A = CH4 production of
reactor A (mL L−1 h−1) rCH
4B = CH4 production of
con-trol reactor (mL L−1 h−1) rH
2A = the added amount of H2
to reactor A (mL L−1 h−1) rH
2D = the residual amount of
H2 in reactor A (mL L−1 h−1).
Determination of fermentation parameters
oDM: The organic dry matter content was quantified by drying the biomass at 105 °C overnight and weighing the residue, giving the dry mass content. Further heating of this residue at 550 °C provided the organic dry matter (oDM) content.
pH: The value of the pH was measured with a Radel-kis OP-211/2 equipped with an OP-0808P pH electrode immediately after the daily GC analysis.
Abbreviations
CSTR: continuous stirred tank reactor; P2B: power to biomethane concept; Rpm: revolution per minute; GC: gas chromatograph; HPLC: high-pressure liquid chromatography; TCD: thermal conductivity detector; oDM: organic dry matter content.
Authors’ contributions
MSz carried out most of the experiments and evaluated the data. NÁ and RT participated in the laboratory work and data handling. ZB took part in the experimental work and its design. AB contributed in developing the concept summarized in Fig. 10. GR participated in data interpretation. KLK conceived the study, participated in its design and compiled the manuscript. All the authors have read and approved the final manuscript.
Author details
1 Department of Biotechnology, University of Szeged, Közép fasor 52, Sze-ged 6726, Hungary. 2 Institute of Biochemistry, Biological Research Center, Hungarian Academy of Sciences, Temesvári krt. 62, Szeged 6726, Hungary. 3 Department of Oral Biology and Experimental Dental Research, University of Szeged, Tisza L. krt. 64, Szeged 6720, Hungary. 4 Institute of Biophysics, Biological Research Centre, Hungarian Academy of Sciences, Temesvári krt. 62, Szeged 6726, Hungary.
Acknowledgements
The authors thank Ms. Netta Bozóki for technical assistance. The support and advices by Professor János Minárovits and Dean Kinga Turzó (Faculty of Dentistry, University of Szeged) are gratefully acknowledged. This work was supported by the domestic Grant GOP-1.1.1-11-2012-0128 and the EU Horizon 2020 research and innovation programme, BIOSURF project (contract number 646533).
Competing interests
The authors declare that they have no competing interests.
Funding
This work was supported by the domestic grant GOP-1.1.1-11-2012-0128 and the EU Horizon 2020 research and innovation programme, BIOSURF project (contract number 646533).
Received: 7 March 2016 Accepted: 25 April 2016
η=
rCH
4A−rCH4B
rH
2A−rH2D
×4×
100
References
1. Framework convention on climate change. FCCC/CP2015/L.9. Paris. 2015. 2. Kovács KL, Ács N, Böjti T, Kovács E, Strang O, Wirth R, Bagi Z.
Biogas-producing microbes and biomolecules. In: Lu X, editor. Biofuels. Norfolk: Caister Academic Press; 2014. p. 47–92.
3. ElMekawy A, Hegab HM, Mohanakrishna G, Elbaz AF, Bulut M, Pant D. Technological advances in CO2 conversion electro-biorefinery: a step toward commercialization. Biores Technol. 2016. doi:10.1016/j. biortech.2016.03.023.
4. Bessarabov D, Wang H, Zhao N, editors. PEM electrolysis for hydrogen production: principles and applications. Boca Raton: CRC Press, Taylor and Francis Group; 2015.
5. Ma J, Sun N, Zhang X, Zhao N, Xiao F, Wei W, Sun Y. A short review of catalysis for CO2 conversion. Catal Today. 2009;148:221–31. 6. Dry ME. The Fischer-Tropsch process: 1950–2000. Catal Today.
2002;71:227–41.
7. Benemann JR, Berenson JA, Kaplan NO, Kamen MD. Hydrogen evolution by a chloroplast-ferredoxin-hydrogenase system. Proc Natl Acad Sci USA. 1973;70:2317–20.
8. Mohanakrishna G, Seelam SJ, Vanbroekhoven K, Pant D. An enriched electroactive homoacetogenic biocathode for the microbial electrosyn-thesis of acetate through carbon dioxide reduction. Faraday Discuss. 2015;183:445–62.
9. Villano M, Aulenta F, Ciucci C, Ferri T, Giuliano A, Majone M. Bioelectro-chemical reduction of CO2 to CH4 via direct and indirect extracellular electron transfer by a hydrogenophilic methanogenic culture. Biores Technol. 2010;101:3085–90.
10. Clauwaert P, Verstraete W. Methanogenesis in membraneless microbial electrolysis cells. Appl Microbiol Biotechnol. 2009;82(5):829–36. 11. Klocke M, Mähnert P, Mundt K, Souidi K, Linke B. Microbial community
analysis of a biogas-producing completely stirred tank reactor fed con-tinuously with fodder beet silage as mono-substrate. Syst Appl Microbiol. 2007;30:139–51.
12. Schlüter A, Bekel T, Diaz NN, Dondrup M, Eichenlaub R, Gartemann KH, Krahn I, Krause L, Krömeke H, Kruse O, Mussgnug JH, Neuweger H, Nie-haus K, Pühler A, Runte KJ, Szczepanpwski R, Tauch A, Tilker A, Viehöver P, Goessmann A. The metagenome of a biogas-producing microbial community of a production-scale biogas plant fermenter analyzed by the 454-pyrosequencing technology. J Biotechnol. 2008;136:77–90. 13. Krause L, Diaz NN, Edwards RA, Gartemann K-H, Krömeke H, Neuwger H,
Pühler A, Runte KJ, Schlüter A, Stoye J, Szczepanowski R, Tauch A, Goes-mann A. Taxonomic composition and gene content of a methane-pro-ducing microbial community isolated from a biogas reactor. J Biotechnol. 2008;136:91–101.
14. Wirth R, Kovács E, Maróti G, Bagi Z, Rákhely G, Kovács KL. Characterization of biogas-producing microbial community by short-read next generation DNA sequencing. Biotechnol Biofuels. 2012;5:41.
15. Ács N, Kovács E, Wirth R, Bagi Z, Strang O, Herbel ZS, Rákhely G, Kovács KL. Changes in the archaeal microbial community when the biogas ferment-ers are fed with protein-rich substrates. Biores Technol. 2013;131:121–7. 16. Kovács E, Wirth R, Maróti G, Bagi Z, Rákhely G, Kovács KL. Biogas
produc-tion from protein-rich biomass: fed-batch anaerobic fermentaproduc-tion of casein and of pig blood and associated changes in microbial community composition. PLoS ONE. 2013;8(10):e77265.
17. Kovács E, Wirth R, Maróti G, Bagi Z, Nagy K, Minárovits J, Rákhely G, Kovács KL. Augmented biogas production from protein-rich substrates and associated metagenomic changes. Biores Technol. 2015;178:254–61. 18. Salomoni C, Caputo A, Bonoli M, Francioso O, Rodriguez-Estrada MT,
Palenzona D. Enhanced methane production in a two-phase anaerobic digestion plant, after CO2 capture and addition of organic wastes. Biores Technol. 2011;102:6443–8.
19. Luo G, Johansson S, Boe K, Xie L, Zhou Q, Angelidaki I. Simultaneous hydrogen utilization and in situ biogas upgrading in an anaerobic reactor. Biotechnol Bioeng. 2012;109:1088–94.
20. Luo G, Angelidaki I. Co-digestion of manure and whey for in situ biogas upgrading by addition of H2: process performance and microbial insights. Appl Microbiol Biotechnol. 2012;97:1373–81.
• We accept pre-submission inquiries
• Our selector tool helps you to find the most relevant journal • We provide round the clock customer support
• Convenient online submission • Thorough peer review
• Inclusion in PubMed and all major indexing services • Maximum visibility for your research
Submit your manuscript at www.biomedcentral.com/submit
Submit your next manuscript to BioMed Central
and we will help you at every step:
22. Bassani I, Kougias PG, Treu L, Angelidaki I. Biogas upgrading via hydrog-enotrophic methanogenesis in two-stage continuous stirred tank reactors at mesophilic and thermophilic conditions. Environ Sci Technol. 2015;49(20):12585–93.
23. Alimahmoodi M, Mulligan CN. Anaerobic bioconversion of carbon diox-ide to biogas in an upflow anaerobic sludge blanket reactor. J Air Waste Manag. 2008;58:95–103.
24. Lee JC, Kim JH, Chang WS, Pak D. Biological conversion of CO2 to CH4 using hydrogenotrophic methanogen in a fixed bed reactor. J Chem Technol Biotechnol. 2012;87:844–77.
25. VDI-Handbuch Energietechnik. Fermentation of organic materials. VDI 4630. Berlin: Beuth Verlag GmbH; 2006.
26. Richards BK, Cummings RJ, Jewell WJ, Herndon FG. High solids anaerobic methane fermentation of sorghum and cellulose. Biomass Bioenergy. 1991;1:47–53.
27. Fang HH, Liu H. Effect of pH on hydrogen production from glucose by a mixed culture. Biores Technol. 2002;82(1):87–93.
28. Yu Z, Rasmuson AC, Brown N, Ascue J, Hansson M, Nordberg A. In-situ methane enrichment in anaerobic digestion of sewage sludge. Sweden: Royal Institute of Technology; 2009.
29. Schnürer A, Jarvis A. Microbial handbook for biogas plants. Swedish Gas Centre Report 207. Avfall Sverige. 2010.
30. Mohanakrishna G, Vanbroekhoven K, Pant D. Imperative role of applied potential and inorganic carbon source on acetate production through
microbial electrosynthesis. J CO2 Util. 2016. doi:10.1016/j.jcou.2016.03.003
(in press).
31. “Paul Sabatier—Nobel Lecture. The method of direct hydrogenation by catalysis”. Nobelprize.org. Nobel Media AB 2014. http://www.nobelprize. org/nobel_prizes/chemistry/laureates/1912/sabatier-lecture.html. 30 Jan 2016.
32. Reuter M. Power-to-gas: key technology for the success of sustainable energy. Gas Energy. 2015;4:1–5.
33. Müller B, Sun L, Schnürer A. First insights into the syntrophic acetate-oxidizing bacteria—a genetic study. Microbiol Open. 2013;2(1):35–53. 34. Zhang F, Zhang Y, Ding J, Dai K, van Loosdrecht MCM, Zeng RJ. Stable acetate production in extreme-thermophilic (70°C) mixed culture fer-mentation by selective enrichment of hydrogenotrophic methanogens. Sci Rep. 2014;4:5268.
35. Reddy PVL, Kim K-H, Song H. Emerging green chemical technologies for the conversion of CH4 to value added products. Renew Sust Energy Rev. 2013;24:578–85.