ENHANCED FLOCKING METHOD TO CONTROL
CONGESTION IN WIRELESS SENSOR NETWORK
NAYANA K.V.
M.Tech, 4th Sem ,
Department of CS&E, J.N.N.C.E,
Mr. VEDANANDA D.E.
Assistant Professor, Department of CS&E.,
J.N.N.C.E., Shivamogga
ABSTRACT: Flock-CC protocol is used to control the congestion in wireless sensor network. Flock-CC
method is influenced by earlier swarm intelligence approach. The main idea is to move packets to form flocks and
flow towards the sink, while trying to avoid the congestion .The movement of a data influenced by two forces
attraction and repulsion. Enhanced flock-CC approach is implemented at each node to minimize delay, increase
packet delivery ratio, throughput, and energy efficiency.
1.
Introduction
In networks like WSN contains huge number of hubs. Nodes may be deployed at fixed location or randomly deployed.WSN monitors environmental changes and inform to neighbors nodes. The environmental condition may be about temperature, pressure, level of pollution etc. In military application, health monitoring also uses WSN.
Each node contains sensor within it, also contains electronic circuit to interact with other nodes, battery used to provide energy to network. The senor node available from cheaper price to high price depending on user requirement, features involved etc. From micro particle to chock box size the weight of sensor node changes. The propagation from one node to other may be through flooding or through routing.
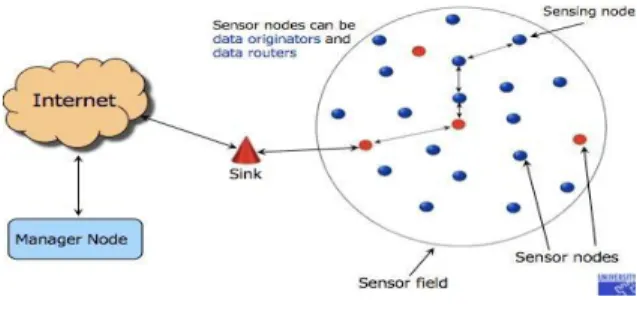
WSN contains many components as show in the Figure 1, mainly contain many sensor nodes, each
node contains sensing field. One of the nodes acts as source node and originates data. The data is transformed with the help of neighboring nodes to sink. Sink node act like destination node. From the sink node packet is given to internet which connects the different network together and act like the managing node.
Figure 1: WSN Components
In network when congestion occurs leads to packet loss, decreasing throughput, packet delivery ratio that is affect overall performance of network. Congestion take place when node carrying large amount of data than its capacity or due to problem in network connections.
When node carrying large amount of information than its limit then node will undergo congestion .Congestion affects PDR (packet delivery ratio), throughput, delay and overall lifetime of network. Congestion cause decreasing queuing delay, packet losses. Congestion can be controlled by end to end manner or by many to one nature. End to end manner is not a good method because it increases the error rate, latency there by reducing response time.
Congestion may occurs near sink node, middle nodes in between sink and source, when all the nodes sending the packets to sink node or to single node if node has no ability to handle all packets at a time then cause congestion at that particular node. This situation causes congestion starvation in the network. Cushion inhabitance together with remote passage stack obtain utilized toward distinguish clog.
WSN congestion occurs at middle nodes due to limitation in resources. When transmitting packets from source to destination through intermediate nodes congestion occurs at middle nodes increases delay, decreases the throughput, packet delivery ratio.
2.
Background
Congestion occurs when the traffic load injected into the network exceeds available capacity at any point of the network. Congestion causes energy waste, throughput reduction, and increase in collisions and retransmissions at the medium access control (MAC) layer. In addition, congestion results in the increase of queuing delays and information loss, leading to the deterioration of the offered quality of service (QoS), decrease of network lifetime and
even the decomposition of network topology in multiple components.
In the paper [6] shows a few aggregate practices, with sharp moves. The model predicts that creature gatherings, for example, angle institute. Middle of the road bunch sorts are moderately (progressively) unsteady. Naturally the moves are imperative in enabling creature gatherings to change starting with one sort of gathering structure then onto the next because of inward conversely outside.
The paper [7] shows algorithm travels in attractive and intrigue observer. Proposed paper tells about the difficult when the node behaves uncertainly meanwhile interaction of near hub increases difficulty in balancing set. Each node effort is important here.
Advance permits assessment heartiness gone circle like guessed detecting methodology utilizing perceptions regarding spatial places fowls innermost rush. The indicated style via deal with trial information taken by uncultivated rushes, together with finds so 7 or 8 nearby return topmost heartiness. Biological flocking heartiness is improved beyond cohesion is one regarding influence.
The paper [8] an essentialness compelling blockage control plan for sensor frame of reference termed CODA (Congestion detection and avoidance) so incorporates below instruments:
(i) Gatherer sort stop up area;
(ii) Open-hover bob by-hop backpressure; and
(iii) Close circle multisource bearing.
Three basic execution estimations are used CODA is elated for relevance identification.
Powerful execution sifts also practice outlining troubles concerning completing CODA in a test node organize attempted in light of Berkeley bits using CSMA.
Entertainment occurs show that CODA out and out upgrades the execution of data scrambling applications, for instance, facilitated scattering by reducing hotspots, and diminishing the essentialness obligation and dedication discipline on identifying applications. We in like manner display that CODA is fit for responding to different stop up circumstances that we acknowledge will be overwhelming as the association of these frameworks stimulates.
3. Enhanced Flock-CC
Flock-CC is inspired by ant colony optimization of swarm intelligence behavior. The proposed flock- CC involves the artificial bird flows. Each node maintains homogeneity.
Node interacts with neighbor or outside environment based on bio swarm model. Flock- CC model is implemented in 2 -D space where SI implemented in 3-D space. The basics characteristics of flock-CC developing are:
Repulsion and attraction zones:
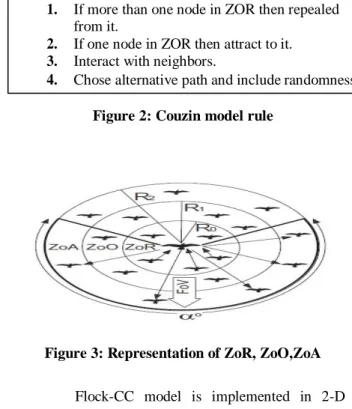
ZoR (Zone of repulsion) it contain only one bird at each time if any bird comes then it will flock away from ZoR.ZoO denote zone of orientation. ZoA indicate zone of attraction which is used when there is no node is present in ZoR. All ZoR, ZoA, ZoO are spherical in shape. If any bird present outside the zone is not considered for interaction. Couzin model is given by
Figure 2: Couzin model rule
Figure 3: Representation of ZoR, ZoO,ZoA
Flock-CC model is implemented in 2-D space. The link between the nodes indicates a wireless connection between them. Individual node interacts with other neighbors in hop by hop manors.
Figure 3 shows senor node representation in flock-CC. R0 represents a repulsive force. The transmission of packet j to destination is pass through m nodes that is node present in nearer distance. The packet first move to the ZoR , as shown in Figure 3. Next move to ZoA which shown by black nodes in Figure 4.
The number of bundles on node is directly equivalent to attraction and repulsion force between packets on node. The packets which are outside ZoR is identified by the control packets. Control packet is one which maintains propagation information. Control packets are not used when packet outside the ZoA that is two hops away.
1. If more than one node in ZOR then repealed
from it.
2. If one node in ZOR then attract to it. 3. Interact with neighbors.
Biological mechanism inspires a flock-CC protocol. It identifies attackers and improves bundle delivery ratio, throughput also overhead. Bundles go on travelled like bird flying in space.
Packet are generated at source node and guided to move against sink although recoil attacker region. Expressive packet movement experiences an attraction and repulsion forces towards sink.
Proposed access associate reference unreal bird float consisting specific having bounded circle regarding view (perception) that communicates with them also surrounding environment. Four simple behavioral rules govern the individual behavior:
1. Chase away against neighbors to avoid collisions.
2. Interact with the neighbor to send packet to destination.
3.
Set the velocity and direction similar to neighbors.
4.
.Introduce random element that allows for exploration.Figure 4: Attacker avoidance scenario of bird beaver
Move packet to sink while avoiding congestion illustrated in Figure 3.6.Proposed mechanism orders bundles have to travel like bird climb settees in sky.
Principle thought does direct bundles via frame runs, while attempting to maintain a strategic
distance from obstructions. Motivation for outlining flock-CC endures:
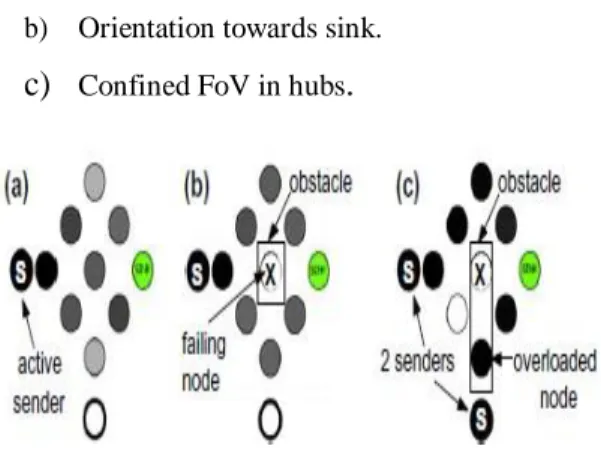
a) Near hub experience tendency and denial. b) Orientation towards sink.
c)
Confined FoV in hubs.
Figure 5: Packet movement in Flock-cc method
Figure 5 shows the attacker recoil of bundle fly. Source node generates a packet and sends towards sink while avoiding attacker. If attacker attacks a node then other node will regenerate packet send to destination. Flock-CC adopts 4 axioms as described below:
Rule 1: repelled from neighboring packets located on nodes at close distance.
Rule 2: Attracted to neighboring packets located on nodes at medium distance within the FoV.
Rule 3: Oriented and attracted to the global attractor under the influence of the environmental magnetic field.
Rule 4: experience some perturbation that may help the packets to pick a random route.
Figure 6: Bundles rush to escape from attacker.
(a) (b) (c Physicle obstcle Physi cleob stcle
Figure 6 shows the movement of the packet from source to destination node.
Source node generates a packet and sends to destination node called sink node. While sending packet attacker may attack the node and cause congestion due to congestion flock will be split into two region and source will chose the path which don‟t contain any congestion
4. Performance evaluation
Packet delivery ratio: The ratio of packets that are successfully delivered to a destination compared to the number of packets that have been sent out by the sender. Figure 7 shows the comparison between the packet delivery ratio of flock-cc and enhanced flock- CC method. From graph it is clear that packet delivery ratio of enhanced flock-CC is more than normal Flock-CC.
Delay: Network delay is an important design and
performance characteristic of a computer network or telecommunications network. Figure 8 shows delay values of flock-CC and enhanced flock- CC model. X-axel describes a count of hubs used. The Y-axel describes delay value. When number of nodes increases from 0 to 10 the value of delay is increased by 30% in both flock-CC and enhanced flock-CC. But when we compare this two value is first it decreases by 5%. When nodes value increases from 20 to 50 value of delay is decreases by 10%. So from the graph we can assumes that enhanced part is better than proposed approach.
Overhead: It is any combination of excess or
indirect computation time, memory, bandwidth, or other resources that are required to perform a specific task. Figure 9 expresses comparison of overhead
between flock-CC and enhanced flock-CC. X-axis shows total hubs used and Y axel corresponds to overhead, with malicious indicates flock-cc protocol and enhanced flock-CC indicates. The overhead of flock-CC is more than enhanced flock-CC method.
Figure 7: PDR comparison between flock-CC and
enhanced flock-CC
Figure 8: Delay comparison between flock-CC
and enhanced flock-CC
Figure 9: Overhead comparison between flock-CC and enhanced flock-CC
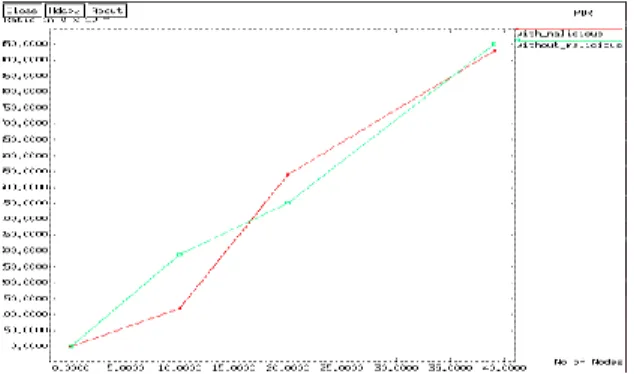
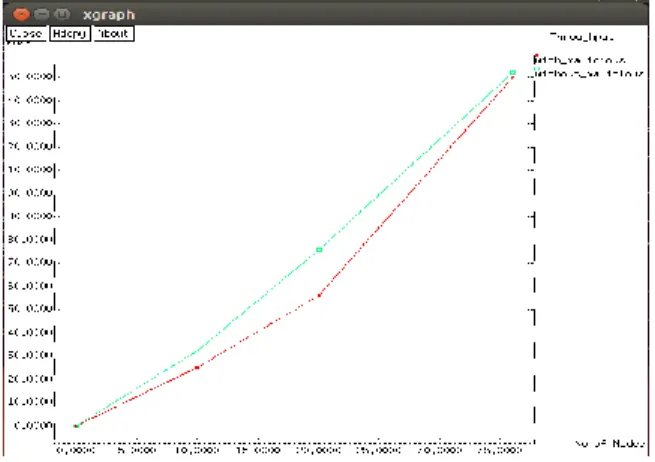
Throughput: Throughput is rate of successful message delivery over a communication channel. Figure 10 expresses throughput of flock-CC and enhanced flock-CC method. X axel denote count of knob whereas Y axis tells throughput value. Throughput of enhanced flock-CC is more; it increases with increase of number of nodes. The green color line in graph indicates a throughput value of enhanced flock-CC and red color lie indicates throughput value of the flock-CC model.
Figure 10: Throughput comparison between flock-
CC and enhanced flock-CC 5. Conclusion and future work
Congestion cause packet loss, throughput decreases, packet delivery ratio minimizes that is it reduces the performance of network. Congestion occurs when node carry large amount of data than its capacity. Flocking phenomena shift bundle towards last sink hub against originator hub involves attraction, repulsion experience among hubs in system. But above mechanism gives less execution matrices so we proposed a enhanced flock approach where use data rate and frequency extra so it increases preference than flocking procedure.
Future Work
Future a novel node level energy efficient routing protocol to improve energy efficiency can be added. Receding a different control over flow of bundle toward sink is implemented. Operate in case of multiple sink may proposed in later.
6. References
[1] Y. Sankara Subramanian, E. Cayirci, “Wireless
sensor networks: a survey, Computer Networks” -38
(1999) 393–422.
[2] H. Karl, A. Willig, “Protocols and Architectures
for Wireless Sensor Networks”.
[3] X.R. Wang ‘’Wireless sensor network anomalies:
diagnosis and detection strategies”, Intelligence-
Based Systems Engineering, Springer, 2011.
[4] R.M. Newman, S.N. Mount, “Complex query
processing in wireless sensor networks, in
Proceedings of the 2nd ACM Workshop on
Performance Monitoring and Measurement of Heterogeneous Wireless and Wired Networks” Ser.
PM2HW2N ‟07, Chania, Crete Island, Greece, 2007, pp. 53–60.
[5] J.E.N.S. Krause, G.D. Ruxton “Collective
memory and spatial sorting in animal groups”
Journal of Theoretical Biology 218
.
[7] A.T. Campbell, C.-Y. Wan3, CODA ” congestion
detection and avoidance in sensor networks”
Proceedings of the 1st International Conference on Embedded Networked Sensor Systems.
[8] P. Ranjan, „„A survey: Topology control for
wireless sensor networks, in Signal Processing, Communications and Networking”, 2008.