ISSN: 2302-9285, DOI: 10.11591/eei.v7i1.896 55
A Modified Overlapping Partitioning Clustering Algorithm for
Categorical Data Clustering
Mohammad Alaqtash1, Moayad A.Fadhil2*, Ali F. Al-Azzawi3 1Computer Science Department, The British University in Dubai, United Arab Emirates 2, 3
Software Engineering Department, Philadelphia University, Jordan
Article Info ABSTRACT
Article history: Received Nov 21, 2017 Revised Jan 22, 2018 Accepted Feb 05, 2018
Clustering is one of the important approaches for Clustering enables the grouping of unlabeled data by partitioning data into clusters with similar patterns. Over the past decades, many clustering algorithms have been developed for various clustering problems. An overlapping partitioning clustering (OPC) algorithm can only handle numerical data. Hence, novel clustering algorithms have been studied extensively to overcome this issue. By increasing the number of objects belonging to one cluster and distance between cluster centers, the study aimed to cluster the textual data type without losing the main functions. The proposed study herein included over twenty newsgroup dataset, which consisted of approximately 20000 textual documents. By introducing some modifications to the traditional algorithm, an acceptable level of homogeneity and completeness of clusters were generated. Modifications were performed on the pre-processing phase and data representation, along with the number methods which influence the primary function of the algorithm. Subsequently, the results were evaluated and compared with the k-means algorithm of the training and test datasets. The results indicated that the modified algorithm could successfully handle the categorical data and produce satisfactory clusters.
Keywords: Categorical clustering Cosine similarity Feature extraction Partitioning clustering Unsupervised learning Vector space model
Copyright © 2018 Institute of Advanced Engineering and Science. All rights reserved.
Corresponding Author: Moayad A. Fadhil,
Department of Software Engineering, Philadelphia University,
Jarash Road, Located 20-KM out of Amman, Amman Jordan Email: [email protected]
1. INTRODUCTION
Clustering or also known as learning, is a machine learning tool which widely used to detect hidden structure or to outline the data category. The learning machine consists of two types of data-driven algorithms namely supervised and unsupervised or clustering. In the supervised learning, the training samples are labelled based on the predefined criteria. On the other hand, clustering divides the objects into similar groups known as clusters where classification criteria or category of the data is unknown [1], [2]. Clustering have been useful in information retrievals such as text classification, data mining, image segmentation and pattern recognition.
The overlapping partitioning clustering (OPC) algorithm can only handle clustering of numerical data. OPC algorithm focus on reducing the distance between objects and increasing distance between the center of objects [3]. Therefore, modifications of the traditional clustering algorithm have been developed and applied to allow clustering of the non-numerical data, like textual data. Hence, an analytical study was conducted on the nature of data, in which the pre-processing phase including tokenizing, stopping words removal and word stemming of a textual data and to minimize the outliers. Additionally, feature extraction, documents presentation and representation are the main processes involve in the clustering. Features extraction is established as the best approach to weight document’s terms. Features extraction denotes by
term frequency by inverse document frequency (TF-IDF) [4]-[6]. It is proposed that reducing the dimensionality of the documents yields better results than the features extraction approach. Hence, this study applied tokenizing, stop words removal, and word stemming as the pre-process phase for the features extraction of the modified algorithm.
The distant-based clustering can handle numerical data types or categorical data of precise values like “low”, “medium”, and “high” which are normalized into numeric values. However, the data representation of document clustering has been complicated [7]. It is proposed that vector space model (SVM) with terms weight could be a good model to represent the textual data [8], [9].
The similarity measure is one of the important aspects of the clustering process [10], [2]. For numerical data, Euclidean distance has been used to measure the distance between data objects [3], [11]. It is a direct approach that defines the object by its numerical features. A recent study adopted the inner product of vectors as an output of a correlation between the data objects [6] and a normalized similarity function to establish the similarity values for different documents. Contrarily, the current study adopted the cosine similarity value to measure whether the two objects are similar. In this study, the OPC algorithm as described by [3], is modified using the above techniques to cluster the categorical data.
2. MODIFIED OVERLAPPING PARTITIONING CLUSTERING (OPC)
Text documents are considered as an important source of information. In order to allow effective text operations and better structuring of the documents, a pre-processing phase is required to reformat documents as it is difficult to extract information from the original structure. To achieve this, each text document undergoes tokenization, elimination of stop words, and word stemming during the operations. Tokenizing, which is also known as lexical analysis of the text, applied for identification of words in the document text. It is a procedure that converts the string of characters. In this study, the text of the documents converts into a set of words used later as features. In the elimination, the list of stop words is eliminated to reduce the high dimensionality of the document features. The list of stop words are prepositions, articles and conjunctions that might be extended to include some adverbs, verbs and adjectives. Lastly, the word stemming applied to improve the performance of clustering process where it reduces the words to their morphological root form. It should be noted that a stem is the form of a word after removal of its affixes. Majority of the words have syntactical variations that affect similarity between objects in the clustering process. Stemming allows reduction of the words variant to a root word that has a common concept. This is done by replacing the words by their respective stems. For instance, “compute” is the stem for the variants computed, computer, computation, computing, and computers. In short, word stemming reduces the dimensionality of the dataset in a way that the number of distinct features are decreased. In this study, English Porter 2 stemmer was applied [12].
A feature extraction approach is used to minimize the number of features by using the linear discriminant analysis and maximum margin criterion, or nonlinear transformations. Words in a text document are used as feature terms. The size of datasets used in the text clustering will be increased if a full-text representation is adopted. In addition, this will affect the quality of features provided to describe the data. Hence, it is essential to define the feature reduction strategies to effectively resolve this problem.
Term frequency and inverse document frequency (TF-IDF) weighting is widely used in text mining, information retrieval, and search engines to score and align the relevance of a document for a given user query [4]. Term frequency (nti) refers to the number of times that term ti occurs. Normalization of nt value is performed to prevent the bias towards longer documents by dividing the occurrences of the term over the length of that document (ndj). So, the normalized term frequency for term ti in document di is:
𝑇𝐹𝑖𝑗 = 𝑛𝑖𝑗 / 𝑛𝑑𝑗
The importance of a term increases proportionally to the number of times that term appears in the document. Nonetheless, the general importance decreases if the term occurs frequently in many documents within the data space. The inverse document frequency (IDF) is a measure of the general importance of the term in the whole collection. So, the inverse document frequency for term ti in all documents of the collection (N) is:
𝐼𝐷𝐹𝑖= log2(𝑁/𝐷𝑡𝑖)
where Dti is the number of documents with ti value happen at least once.
Document representation is an important phase that followed by the process of clustering. The documents in the document space is expressed by a vector space. The vector space is expressed by TF-IDF which denotes the importance of a term of the document in a dataset. Furthermore, the error display “reference not found” demonstrates how the documents are represented in VSM. TF-IDF was used in the study in which each vector represents a document using the magnitude of its TF-IDF terms weight. The angel between vectors represents the similarity value the between vectors. A vector has a magnitude and direction which are indicated by the vector length d and the angel. In this study, the document vector magnitude used was TF-IDF value and the document direction was the similarity between the vectors. The vector space model similarity measured using the associative coefficients based on the inner product of the documents vectors, in which the word overlap indicates similarity. Cosine similarity has been used widely for similarity measure in which the inner product is usually normalized. Each document is a combination of an important feature known as terms. The TF-IDF value was computed for each distinct word found in the documents of the dataset. Subsequently, TF-IDF values were sorted accordingly where a subset of the words was selected by using a threshold for the TF-IDF measure. The average value of TFI-DF values denotes as a threshold which is defined by:
𝑇ℎ𝑟𝑒𝑠ℎ𝑜𝑙𝑑 (𝛿) = ∑𝑇𝐹𝐼𝐷𝐹 / (𝑚1 + 𝑚2 + … + 𝑚𝑛)
Once a threshold value is determined, each document will contain only terms with a TFIDF value which is higher than the defined threshold.
The TF-IDF for each term in each document in the dataset, was computed using the following definitions:
fi: occurrences of term ti in a given document.
tfi: fi/∑i fi, where ∑i fiis the length of the document.
ni: number of documents that contains ti in the dataset space. N: the total number of documents in the dataset space. idfi: log2 (N/ni).
TFIDFi=tfi*idfi
Vector is the final document representation process. Vector space model (VSM) (Perone, Machine Learning:
𝑑𝑖
⃗⃗⃗ = (𝑇𝐹𝐼𝐷𝐹𝑖1, 𝑇𝐹𝐼𝐷𝐹𝑖2, … , 𝑇𝐹𝐼𝐷𝐹𝑖𝑚)
Cosine Similarity for Vector Space Models [8] has been useful in documents representation. VSM provides good evaluation of the similarity measure between documents as it is proportionate to the document’s length. In this study, cosine similarity [13], [8] was applied because the vectors magnitude are features extracted. Cosine similarity has been used widely as a measure of similarity between the two vectors of an inner product space. Cosine similarity measures the cosine angle between the two vectors. The inner product of features enables a good correlation between vectors. Subsequently, the cosine of the angel generated by the inner product provides a good estimation on the similarity of two documents [14], [15]. According to the vector’s orientation, if the cosine range is [1, -1], cosine of 0° is 1, cosine of 90° is 0, and cosine 180° is -1. Two vectors with the precise orientation have a cosine similarity of 1, while two orthogonal vectors (90° degrees angel) have a cosine similarity of 0. Despite their magnitude, two vectors which are diametrically opposed have a similarity of -1 [13], [14].
Therefore, the equation is derived from the dot product of two vectors, which is defined by [8]: Let:
𝑑𝑖
⃗⃗⃗ = (𝑇𝐹𝐼𝐷𝐹𝑖1, 𝑇𝐹𝐼𝐷𝐹𝑖2, … , 𝑇𝐹𝐼𝐷𝐹𝑖𝑚)
𝑑𝑗
⃗⃗⃗ = (𝑇𝐹𝐼𝐷𝐹𝑗1, 𝑇𝐹𝐼𝐷𝐹𝑗2, … , 𝑇𝐹𝐼𝐷𝐹𝑗𝑚)d⃗⃗⃗ = (TFIDFj j1, TFIDFj2, … , TFIDFjm)
Then d⃗⃗⃗ • di ⃗⃗⃗ = ∑j mi=1didj= TFIDFi1× TFIDFj1+ TFIDFi2× TFIDFj2+. . +TFIDFim× TFIDFjm 𝑑𝑖
⃗⃗⃗ • 𝑑⃗⃗⃗ = ∑ 𝑑𝑗 𝑖𝑑𝑗 𝑚 𝑖=1
= 𝑇𝐹𝐼𝐷𝐹𝑖1× 𝑇𝐹𝐼𝐷𝐹𝑗1+ 𝑇𝐹𝐼𝐷𝐹𝑖2× 𝑇𝐹𝐼𝐷𝐹𝑗2+. . +𝑇𝐹𝐼𝐷𝐹𝑖𝑚× 𝑇𝐹𝐼𝐷𝐹𝑗𝑚
The outcome of a dot product of two vectors is a scalar. On the other hand, cross product produces results equivalent to another vector. A dot product in geometry is defined by:
𝑑𝑖
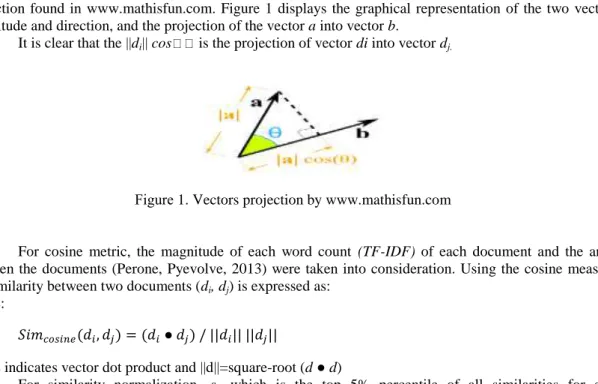
||di|| is the magnitude of vector di, and ||dj|| is the magnitude of vector dj. Figure 1 shows the vectors
projection found in www.mathisfun.com. Figure 1 displays the graphical representation of the two vectors, magnitude and direction, and the projection of the vector a into vector b.
It is clear that the ||di|| cos is the projection of vector di into vector dj.
Figure 1. Vectors projection by www.mathisfun.com
For cosine metric, the magnitude of each word count (TF-IDF) of each document and the angle between the documents (Perone, Pyevolve, 2013) were taken into consideration. Using the cosine measure, the similarity between two documents (di, dj) is expressed as:
where:
𝑆𝑖𝑚𝑐𝑜𝑠𝑖𝑛𝑒(𝑑𝑖, 𝑑𝑗) = (𝑑𝑖● 𝑑𝑗) / ||𝑑𝑖|| ||𝑑𝑗||
where indicates vector dot product and ||d||=square-root (d ● d)
For similarity normalization, sif which is the top 5% percentile of all similarities for each
document’s pairs is retained as the initial threshold. Hence, similarity becomes 0 for all documents with similarity more than the sif.
Let:
𝑠𝑖𝑗 = 𝑆𝑖𝑚𝑐𝑜𝑠𝑖𝑛𝑒(𝑑𝑖, 𝑑𝑗)
then:
min {𝑠𝑖𝑗, 𝑠𝑖𝑓} > 𝑠
Crowding value:
where ndi indicates the number of documents associate to the cluster with the center di, and maxv shows the
maximum of all ndi in which maximum distant value expressed as:
Maximum Distant Value
𝑀𝑑𝑣(𝑑𝑖) =
𝑛𝑑𝑑𝑖
1−(𝑚𝑎𝑥𝑑+𝑤), {𝑤: 𝑤 > 0}
Where nddi indicates a greater value of similarity between that non-center di and any center-document in the
Table 1, and maxd indicates the maximum distance of all ndxi, which denotes the smallest similarity of all nddi. This function is altered due to the modification in the similarity measure, where maxd becomes 0 (cosine 90). Table 2 shown MOPC normalized similarity. Table 3 shown MOPC algorithm
Table 1. MOPC Similarity Table
d1 d2 … dn
d1 1 S12 … S1n
d2 S21 1 … S2n
. . . . .
dn Sn1 Sn2 … 1
Table 2. MOPC Normalized Similarity Table
d1 d2 … dn Cv(di) Mdv(di) CRF(di)
d1 ctr 1/0 … 1/0 Cv(d1) Mdv(d1) CRF(d1)
d2 1/0 ctr … 1/0 Cv(d2) Mdv(d2) CRF(d2)
. . . . . . . .
Table 3. MOPC Algorithm Input parameters k and s;
Do preprocess work
{ tokenizing text; Elimination of stopwords; word stemming;
Features selection{
Create Term Frequency Table; Create TF-IDF table;
Implement documents as Vectors; }
Create Cosine Similarity and normalized similarity table
For (q=0;q++; q < k)
{choose one non-center object as the center-object that has higher CRF value; Assign the objects satisfying modified Eq. (6) to this new cluster;
Update Mdv(di) and CRF(di) for all di;} Calculate the objective value of the clustering; Repeat /iteratively adjust the current clusters/ Temporarily replace one center-document
by one non-center document according to CRF values; Compute the objective value of
the new clustering;
If the new objective value is greater than the maximal one, then
Store this new objective value as the maximal objective value;
Update Mdv(di) and CRF(di) for all di; Until the objective value converges.
A CRF function was developed to investigate whether a non-center document can be proposed as a center document using Cv(di) and Mdv(di).
𝐶𝑅𝐹(𝑑𝑖) = 𝑤1 × 𝐶𝑣(𝑑𝑖) + 𝑤2 × 𝑀𝑑𝑣(𝑑𝑖)
This part was retained by selecting initial cluster centers, as this approach is better than a random selection. The objective function of the modified algorithm will remain unchanged from OPC, let c1, c2, ..., ck represent k clusters and center documents is dc1, dc2, dck. By defining Cv(dci) and Mdv(dci), the objective
function of the current clustering expressed as:
𝑜𝑏𝑗𝑐𝑢𝑟𝑟𝑒𝑛𝑡= 𝑤1 × min[𝑀𝑑𝑣(𝑑𝑐1), 𝑀𝑑𝑣(𝑑𝑐2), … , 𝑀𝑑𝑣(𝑑𝑐𝑘)] + 𝑤2 × ∑ 𝐶𝑣(𝑑𝑐𝑘) 𝑘 𝑘 𝑖=1 3. RESULTS
Table 4 shows the run results of MOPC over the training dataset. For the input parameters of k=3, s=0.04, ten different runs are performed using w1=0.7 for the crowding value factor Cv(di). Moreover, increased the number of documents belongs to cluster center dj is reduced, and w2=0.03 for Mdv(di) which increased the distance between cluster centers.
Table 4. MOPC Run Results on Train Dataset Random Initial Centers 0
Initial Cluster Center Selection Clustering by MOPC after 3000 Iterative adjustments Initial centers Initial Objective Value k1
center objects in k1 k2 center objects in k2 k3 center objects
in k3 Final objective value Runtime
1 [2366,1165,1655] 0.04826711915535445 3121 1326 3128 1262 539 1299 0.7132141564784166 3.626001s 2 [226,605,919] 0.17989105077928608 539 1299 3121 1326 3128 1262 0.7132141564784167 4.948134s 3 [1917,339,532] 0.07272664655605833 3121 1326 3128 1262 539 1299 0.7132141564784166 3.801872s 4 [441,2125,1682] 0.09225907491201608 539 1299 3121 1326 3128 1262 0.7132141564784167 5.111451s 5 [64,2272,502] 0.06146470588235294 3121 1326 3128 1262 539 1299 0.7132141564784166 3.901857s 6 [2121,253,1816] 0.13730683760683757 3121 1326 3128 1262 539 1299 0.7132141564784166 3.888225s 7 [283,1216,3079] 0.14716103569632982 3121 1326 539 1299 3128 1262 0.7132141564784167 4.816728s 8 [3169,1434,3316] 0.053546153846153834 539 1299 3128 1262 3121 1326 0.7132141564784166 2.912555s 9 [449,1662,1466] 0.1165426344896933 539 1299 3121 1326 3128 1262 0.7132141564784167 5.051386s 10 [2136,3361,497] 0.04421985922574158 3121 1326 3128 1262 539 1299 0.7132141564784166 3.771047s
In order to establish a new cluster center, a random selection of the initial cluster centers, and 3000 iterative adjustments using smart non-center document selection were performed. The objective value is showed in Table 4. From the initial stage of (5-7) iterations, selection of non-center documents using the smart method which utilize higher CRF value resulted in satisfactory convergence. Initial centers are referenced using the index of the document in the document list, ex: di=2366 which indicates document index of 2366 out of all documents in the dataset array as used by the algorithm.
The optimum clustering value was established by using the smart method of initial centers selection showed a faster convergence of the objective function (2-3 iterations). Table 5 shows the run results of MOPC clustering with the similar input parameters using the same training dataset but with higher CRF non-centers value as initial non-centers. Number of clusters 3, Mdv(di) ratio=0.03, Cv(di) ratio=0.7, k=3, s=0.04 we applied in this study. Both ways of choosing initial centers such as randomly or using the smart selection method, the objective value converged to the same cluster centers in almost all algorithm runs.
Table 5. MOPC Run Results on Train Data Set, Higher CRF for Initial Centers Run
no.
Initial Cluster Center Selection Clustering by MOPC after 3000 Iterative adjustments Initial centers Initial Objective Value k1
center objects in k1 k2 center objects in k2 k3 center object
s in k3 Final objective value Runtime
1 [3121,539,3128] 0.6836869281045752 3121 1326 539 1299 3128 1326 0.7132141564784167 4.745319s 2 [3121,539,3128] 0.6836869281045752 3121 1326 539 1299 3128 1326 0.7132141564784167 4.984999s 3 [3121,539,3128] 0.6836869281045752 3121 1326 539 1299 3128 1326 0.7132141564784167 4.796119s 4 [3121,539,3128] 0.6836869281045752 3121 1326 539 1299 3128 1326 0.7132141564784167 5.080674s 5 [3121,539,3128] 0.6836869281045752 3121 1326 539 1299 3128 1326 0.7132141564784167 4.916712s 6 [3121,539,3128] 0.6836869281045752 3121 1326 539 1299 3128 1326 0.7132141564784167 4.842878s 7 [3121,539,3128] 0.6836869281045752 3121 1326 539 1299 3128 1326 0.7132141564784167 4.756037s 8 [3121,539,3128] 0.6836869281045752 3121 1326 539 1299 3128 1326 0.7132141564784167 4.857886s 9 [3121,539,3128] 0.6836869281045752 3121 1326 539 1299 3128 1326 0.7132141564784167 4.780254s 10 [3121,539,3128] 0.6836869281045752 3121 1326 539 1299 3128 1326 0.7132141564784167 4.956864s
Table 6 shows the run results for the test dataset. The first three runs which utilized random selection of the initial cluster centers with minimum ratio of Mdv in all runs objective value converged to the same cluster centers. In addition, the last three runs performed with the smart selection method for initial centers selection converged to the objective function to the same cluster centers. It is clear that smart method had satisfactory performance in the algorithm’s detection of the optimum centers.
Table 6. MOPC Run Results of Test Data Set Run
no.
Initial Cluster Centers with Random Selection Clustering by MOPC after 3000 Iterative adjustments Initial centers Initial Objective Value k1
center object s in k1 k2 center object s in k2 k3 center object s in k3
Final objective value Runtime
1 [9114,11790,7197] 0.12108070991070768 12358 9034 654 8338 1015 3 8309 0. .6629979115932403 25.3442s 2 [11609,14474,1483 ] 0.14755477086561877 12358 9034 654 8338 10153 8309 0. .6629979115932403 21.4881s 3 [2734,14827, 2673] 0.1383982510515829 654 8338 1235 8 9034 1015 3 8309 0. .6629979115932403 25.4743s Initial Cluster Centers with Smart Selection k1
center object s in k1 k2 center object s in k2 k3 center object
s in k3 Final objective value Runtime
4 [12358,654,10153] 0.6629979115932403 12358 9034 654 8338 1015
3 8309 0. .6629979115932403 28.9095s 5 [12358,654,10153] 0.6629979115932403 12358 9034 654 8338 10153 8309 0. .6629979115932403 25.0800s
6 [12358,654,10153] 0.6629979115932403 12358 9034 654 8338 10153 8309 0. .6629979115932403 25.9302s
Table 7 shows the relationship between the expected with obtained clustering results. ARI value calculated by generating values shown in Table 7. The ARI value ranges between 0 and 1, where 0.0 indicated that the cluster is randomly independent from the expected results, and 1.0 indicates that they are indistinguishable. Additionally, ARI value for MOPC was 0.004 and 0.002 which was close to the ARI value for k-means of 0.000 and 0.009 for the training and test dataset respectively. Even though, the above value considered low, the results were satisfactory compared to a well-known algorithm known as k-means.
Table 6. Run Results & Evaluation Metrics: MOPC vs. K-mean Dataset Initial Objective Value Final Objective Value
Avg. cluster size Runtime MOPC Runtime K-Means MOPC V-Measure K-means V-Measure MOPC Adjusted Rand Index K-means Adjusted Rand Index Train 0.17989105077928608 0.7132141564784167 1290 4.948134s 0.163s 0.063 0.074 0.004 0.000 Test 0.12108070991070768 0.6629979115932403 8560.3 28.90951s 4.205s 0.226 0.181 0.002 0.009
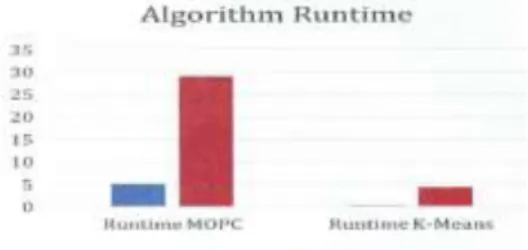
Clustering performance was evaluated using V-measure and Rand index as shown in Figure 2 and Figure 3. The results indicated competency and homogeneity levels similar to k-means clustering as the scores were approximately close to k-means scores. In both training and test datasets, k-means runtime was superior to the MOPC. The performance of algorithm was lower compared to k-means. Mdv ratio generated by the algorithm implementation indicates the minimum similarity between clusters, where the larger the ratio smaller the similarity value. Our results showed a ratio of 0.03 which indicates the minimum similarity was significantly large. This implies that the minimum similarity is close to the centers. Additionally, average cluster size was average according to the crowding value ratio selected which was 0.7. This resulted in the selection of maximum documents relevant to the corresponding cluster center.
Documents belong to the corresponding cluster center selected.
Figure 2. V-measure MOVC vs. K-means Figure 3. Runtime comparison between MOVC vs. k-means
4. CONCLUSION
It was found that traditional algorithm was limited by use numerical type of data. The study proposed that modification of the overlapping partitioning cluster algorithm generates satisfactory results for clustering of the categorical data.
ACKNOWLEDGEMENTS
This reseaech work is granteed by the Deanship of Scientific Research–Philadelphia University– Jordan.
REFERENCES
[1] S. Ayramo and T. Karkkainen, "Introduction to partitioning-based clustering with a robust example," University of Jyvaskyla, Department of Mathematical Information Technology, Agora, FINLAND, 2006.
[2] A. Jain, M. Murty and P. Flynn, "Data Clustering: A Review," ACM Computing Surveys, vol. 31, no. 3, pp. 264-323, 1999.
[3] Y. L. Chen and H. L. Hu, "An Overlapping Cluster Algorithm to Provide Non-Exhaustive Clustering," European Journal of Operational Research, vol. 173, no. 3, pp. 762-780, 2006.
[4] R. Duwairi and R. Al-Zubaidi, "A Hierarchical K-NN Classifier for Textual Data," The International Arab Journal of Information Technology, vol. 8, no. 3, pp. 251-259, 2011.
[5] S. Michael, K. George and K. Vipin, "A Comparison of Document Clustering Techniques," TextMining Workshop at KDD2000, 2000.
[6] C. V. Trappey, W. Chun-Yi and A. J. Trappey, "Clustering Patents using Non-Exhaustive Overlaps," J Syst Sci Syst Eng, pp. 162-181, 2010.
[7] M.-Y. Shih, J.-W. Jheng and L.-F. Lai, "A Two-Step Method for Clustering Mixed Categroical and Numeric Data,"
Tamkang Journal of Science and Engineering , vol. 13, no. 1, pp. 11-19, 2010.
[8] C. S. Perone, "Pyevolve," 2013. [Online]. Available: http://blog.christianperone.com/2013/09/machine-learning-cosine-similarity-for-vector-space-models-part-iii/. [Accessed 22 Dec 2015].
[9] S. Guha, R. Rastogi and K. Shim, "ROCK: a Robust Clustering Algorithm for Categorical Attributes," in Data Engineering, 1999. Proceedings., 15th International Conference on, Sydney, NSW, 1999.
[10]R. Dubes and K. J. Anil, "Clustering Methodologies in Exploratory Data Analysis," Advances in Computers, vol. 19, pp. 113-228, 1980.
[11]P. Gianvito, M. Ceci, C. Loglisci, D. D’Elia and D. Malerba, "Hierarchical and Overlapping Co-Clustering of mRNA: miRNA Interactions," ECAI 2012, pp. 654-659, 2012.
[12]M. Porter, "The Porter Stemming Algorithm," 2006. [Online]. Available: http://tartarus.org/~martin/PorterStemmer/index.html.
[13]Wikipedia, "Cosine similarity," 2015. [Online]. Available: https://en.wikipedia.org/wiki/Cosine_similarity. [Accessed 22 Dec 2015].
[14]A. Strehl, J. Ghosh and R. Mooney, "AAAI Conference on Artificial Intelligence," in Impact of Similarity Measures on Web-page Clustering, Austin, Texas, 2000.
[15]D. J. V. R. M. K.P.N.V. Satya sree, "Clustering Based on Cosine Similarity Measure," International Journal of Engineering Science & Advanced Technology, vol. 2, no. 3, pp. 508-512, 2012.
BIOGRAPHIES OF AUTHORS
Mohammed Alaqtash Computer Science PhD. Mohammad has managed several projects in his career from in-house developed solution to ERP delivery for both private and public sectors. He has achieved high level of integration between ERP solutions with custom made solution accomplishing higher level of integrity and customer satisfaction.Mohammad has graduated from Yarmouk University Computer Science Department. He received his MSc Degree from Philadelphia University of Jordan. Currently a PhD student in The British University in Dubai.
Dr. Moayad Al-Athami, Associative-Professor, Head of Software Engineering Department, Faculty of Information Technology, University of Philadelphia, Jordan.
Research areas • Expert Systems • Intelligent Systems • Search Engine • Computational Linguistics • Computer Security • Machine Learning
Dr. Ali Al-Azzawim, Assistant Professor of Computer Sciences in the Software Engineering At Philadelphia University, Amman – Jordan.
Research areas
• Natural Language Processing
• Artificial Intelligence and Expert Systems • Computer Security (Steganography) • Image and sound processing. • Formal Language Specifications