Procedia Engineering 29 (2012) 280 – 284 1877-7058 © 2011 Published by Elsevier Ltd. doi:10.1016/j.proeng.2011.12.707 Procedia Engineering 00 (2011) 000–000
Procedia
Engineering
www.elsevier.com/locate/procedia2012 International Workshop on Information and Electronics Engineering (IWIEE)
Demand Forecasting of Supply Chain Based on Support
Vector Regression Method
WANG Guanghui*
School of Business Administration South China University of Technology Guangzhou 510641, China
Abstract
Introducing the basic theory and computing process of time series forecasting based on Support Vector Regression (SVR) in details, optimizing the parameters of SVR by Genetic Algorithm (GA). Applying SVR to forecast the demand of supply chain in real data, and compared to the RBF neural network method. The result shows that SVR is superior to RBF in prediction performance. And SVR is the suitable and effective method for demand forecasting of supply chain.
© 2011 Published by Elsevier Ltd. Selection and/or peer-review under responsibility of Harbin University of Science and Technology
Keywords: Support vector regression;Supply Chain; Demand Forecasting
1. Introduction
In today's global economy, organizations have to face a very competitive environment and employ a number of strategies to gain competitive advantage. One such strategy is mass customization (MC), which combines mass production and individualized production. The phenomenon of mass customization is observable in a variety of physical and digital goods and services sold over the Web. The ubiquitous Web will serve as a disinter mediator by replacing the links in a traditional supply chain with a direct channel to the consumer in the future. Consequently, producers will get better signals regarding consumer preferences and demand levels, which in turn leads to better inventory management and production planning (Park and Park 2003; Vakharia 2002).
* Corresponding author. Email: [email protected]
Open access under CC BY-NC-ND license.
Mass customization combines the advantages of the following two concepts: efficiency in manufacturing and customer satisfaction because of the precise matching between the goods’ characteristics and consumers' requirements (Pine 1993; Piller 2003). Mass customization exists at several levels in practice. It could be as simple as allowing customers to add specific services to a product, i.e., service individualization at the reseller, or as complex as individualized product design and manufacturing, which involves building customer specific products using a small number of standardized parts as well as parts that are individualized to meet specific customer requirements. The former is generally referred to as "Soft Customization" whereas the latter is referred as "Hard Customization" (Coates 1995; Blecker and Graf 2003). Soft customization and personalization can be adequately handled using traditional information systems because of simplicity and straightforward information exchange. In this paper, we focus on hard customization with product individualization within the manufacturing process.
For a successful implementation of mass customization, a number of problems have to be solved. In addition to the need for effective logistics and information management, a big challenge is to manage the coordination between the various actors (nodes) within the supply chain (Reichwald et al. 2000; Dietrich et al. 2003).
Uncertain demand for materials, unique order identification, product specification by configuration, and limited interplant data-transfer are some of the specific issues in mass customization. Coordination of adjacent economic activities and competition pose considerable challenges. Especially if a supply chain is not fully vertically integrated, many complications arise from the need to coordinate nodes that are competing with each other (Schlueter-Langdon and Sikora 2003). Thus, systematic collection of relevant information from the actors within the value chain, propagating it in a timely manner, and using it to orchestrate a production plan, are challenging tasks. This is necessary because enterprises should be able to forward order information to the customers at anytime. In addition, the extended delivery time (cp. production on demand) is inconvenient and hard to schedule. Enterprises must react to this volatile schedule and reduce the time between placing of order and delivery. Existing supply chains cannot support the level of coordination needed between the various actors within the chain in order to cope with the unpredictable "on demand" production schedule. However, intelligent agents have the potential to provide solutions to some of these coordination problems (Baker et al. 1999; Nissen 2001;Swaminathan et al. 1998; Yung et al. 2000; Sikora and Shaw 1998).
Our proposed architecture consists of customer-centric and resource-centric agents. These agents not only collaborate with each other in carrying out the mass customization tasks, but also provide a seamless interface to existing legacy systems. Our agent coordination approach is flexible and supported by partial global plans (Durfee and Lesser 1987). (Durfee and Lesser 1987)。The partial global planning technique
for coordinating distributed problem solving supports each node (agent) with a reasoning capability for developing its partial global view by exchanging node models among the involved nodes. The overall goal is to form a consistent partial global plan so that a node can determine when to work and whom to work with; i.e., the partial global plan guides the nodes to achieve the underlying global objective.
The remainder of the paper is organized as follows. Section 2 discusses related work in the field of based and non-based supply chain management. Within that section, the benefits of an agent-based approach for MC are also analyzed. In Section 3 typical actors in mass customization scenarios are illustrated for the shoe industry. Section 4 presents the architecture for a multi-agent system for mass customization and a three-tier model for addressing the coordination problem. This section also contains the formal coordination protocol. Section 5 provides an application of the protocol to the shoe industry and a glimpse of the proof-of-concept prototype that is under development. This prototype implements partially the MAS architecture and our coordination protocol for mass customization. Finally, Section 6 provides the summary and future work.
2. Supply Chain Management Architecture and Coordination
2.1. Supply chain management architecture
Instruments for supply chain management appear at different levels corresponding to various tasks that are executed. These tasks are time sensitive and highly interdependent. A brief overview of the core processes in a supply chain is illustrated and the steps within each process are related to specific objectives of coordination improvement. On a strategic level long-term activities must be coordinated.
Here, organizational aspects (e.g. selection of suppliers, production systems, and enterprise locations) and product-related aspects (e.g. determination of product portfolio and strategic sales planning) must be considered by the top-level management. Medium-term activities are relevant on a tactical level. For example, planning of production and human resources and demand for components are handled at the tactical level. Finally, short-term activities enable enterprises to fulfill orders at the operational level. In order for the supply chain to be successful, enterprises must manage capacities, usage of machineries, and stock disposition (Fleischmann et al. 2001).
Improvement of supply chain coordination can start at each of the described levels as long as appropriate requirements and instruments are taken into account. While the strategic and tactical levels are important, the need for coordination of activities is the highest at the operational level. Hence, we focus on the operational level of supply chain management in this paper. Instruments and methods are needed to ensure a resource efficient order handling capability. Because this involves inter-organizational processes, two kinds of activities must be considered. First, with an external view on one side, interplant information and logistics management must be harmonized. In order to prevent bullwhip effects, extensions of lead time, and delivery bottlenecks, seamless information transfer is needed and plans for material demand, allocation of machinery and transportation disposition must be coordinated. Second, with an internal view on the other side, creation and execution of in-house planning and scheduling for workload, capacities, and demand for components have to be synchronized. These are prime objectives for improvement. Finally, in contrast to the strategic and tactical level supply chain management, the operational level applies to short-term activities like manufacturing, order processing and logistics. It includes control and adjustment of business and technical transactions in order to identify best solutions in each case for all the processes and actors in the supply chain.
2.2. Supply chain coordination
Managing the coordination in a multi party supply chain is a relevant task because of the number of entities involved, each with its own resources and objectives. The interdependence of processes requires real-time coordination across organizational boundaries in order to deal with problems and uncertainties. Supply chains have to be synchronized that involve simultaneously acquisition and reevaluation of partners, technologies and organizational structures (Fox et al. 2000). It requires that parties at all stages of the chain take actions that together increase total supply chain profits. A lack of coordination occurs either because different stages of supply chain have objectives that conflict or because information moving between different stages becomes distorted (Kaihara 2003).
In general, coordination mechanisms manage how actors in the supply chain are related to each other. Typically, three kinds of (non-agent-based) coordination mechanisms are discussed in the literature (Neubert et al. 2004). They are: (a) work-based coordination, (b) inter-personal coordination, and (c) ICT-based coordination (van Fenema 2002). Work-ICT-based coordination involves planning and setting up procedures for executing divided work. It may require standards that specify work inputs, behaviors or outputs. Across organizations, reciprocal expectations are spelled out in advance in contracts (Fink 2004).
In the case of inter-personal coordination, actors mutually adjust their efforts through interactive feedback. This hinges on common knowledge, mutual orientation, and working relationships. ICT-based coordination facilitates remote or asynchronous interaction between individuals. It makes information available to actors facing similar responsibilities at different locations.
While these non-agent-based approaches may be effective in stable environments, they do not work well in mass customization environments because of their dynamic nature. The infusion of mass customization business models-where final products are manufactured not by forecasts of demand but by incoming orders only-has altered the traditional definition of supply chain by adding the actual consumer into the process. This new paradigm requires a significantly greater degree of synchronization of the entire supply chain including the inventory systems. Such a synchronized production process will necessitate greater coordination among the participating members of the supply chain and willingness to significantly improve the inter-firm communications (Ghiassi and Spera 2003).
3. Application of Support Vector Regression in Supply Chain Demand Forecasting
Below, we will apply the support vector regression model to the enterprises’ supply chain demand forecasting and compared with the RBF neural network results. Taking a large paper enterprise which products sack, cow cards and pulp as an example, the paper takes the enterprise’s week sales as the study object of the Support Vector Regression prediction.
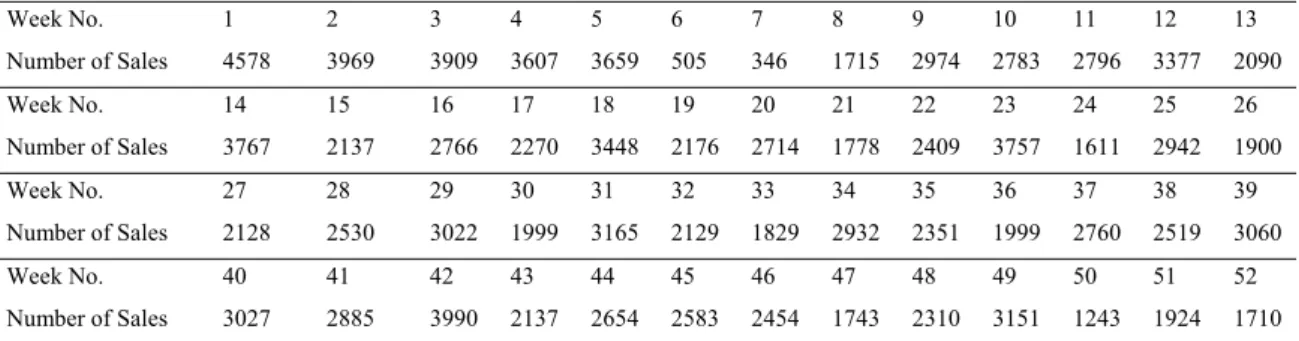
Table I Weekly sales of a paper company warehouse number sequence
Week No. 1 2 3 4 5 6 7 8 9 10 11 12 13 Number of Sales 4578 3969 3909 3607 3659 505 346 1715 2974 2783 2796 3377 2090 Week No. 14 15 16 17 18 19 20 21 22 23 24 25 26 Number of Sales 3767 2137 2766 2270 3448 2176 2714 1778 2409 3757 1611 2942 1900 Week No. 27 28 29 30 31 32 33 34 35 36 37 38 39 Number of Sales 2128 2530 3022 1999 3165 2129 1829 2932 2351 1999 2760 2519 3060 Week No. 40 41 42 43 44 45 46 47 48 49 50 51 52 Number of Sales 3027 2885 3990 2137 2654 2583 2454 1743 2310 3151 1243 1924 1710 The specific demand forecast is as follows:
Step first; we normalized the data in Table I within the interval [0, 1].
Step second, we reconstructed phase space by normalized data according to Takens Theorem, namely established the matrix as type (2).
Step third; we constituted the phase space by data obtained before the 42 normalized data points for the training samples.
Step forth, built by learning the training samples to obtain the nonlinear relationship between volume series.
Step fifth; choose the bottom 10 points as predicted sample phase.
SVM kernel function used, the corresponding embedding dimension m to take 5 (General m ∈[1 30] ),
kernel function parameters to take 1 (General σ∈[0.1 3.8] ), a penalty factor C to take 1, the loss
function parameters ε to take 0.001.
The choice of parameters of support vector machines is the results of adaptive optimization of Support Vector Machines by using genetic algorithms. The parameters of Propagation algorithm were set
separately as follows: the probability of crossover and mutation are 0.8 and 0.08, the initial group 5, the evolution generation is 50.
When we construct the search range of parameters, we considered the practical application of each parameter in the possible range and we chose m∈[1,30],σ∈[0.001,1000],C∈[1,1000],ε∈[0.001,0.1]
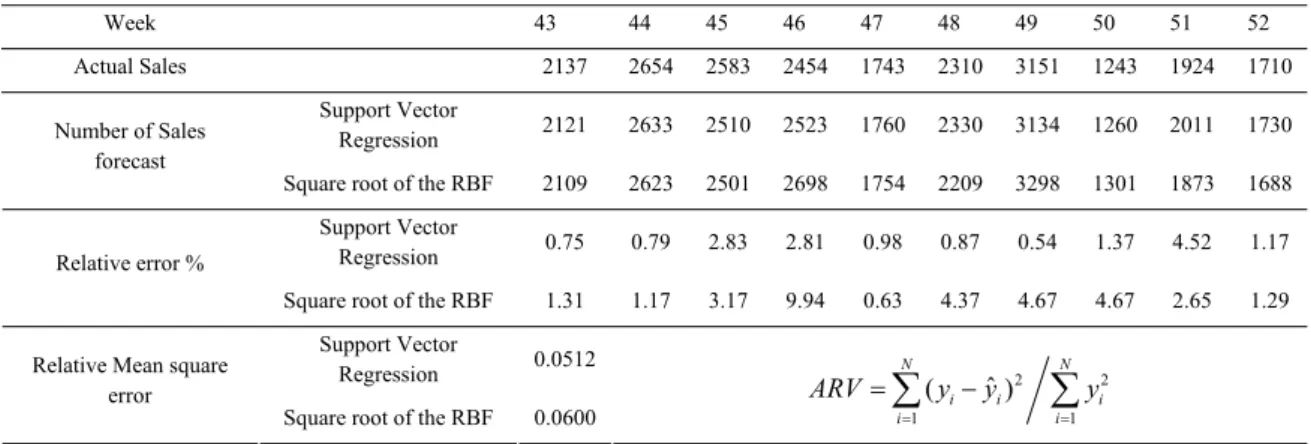
generally. The results and the comparisons with the square root of the radial basis function neural network prediction are listed in table 2. It can be seen that support vector regression was better than neural networks in the accuracy of prediction, the distribution of the balance.
Table II The predication comparison of Support vector regression with the square root of the results of RBF neural network control
Week 43 44 45 46 47 48 49 50 51 52 Actual Sales 2137 2654 2583 2454 1743 2310 3151 1243 1924 1710 Support Vector Regression 2121 2633 2510 2523 1760 2330 3134 1260 2011 1730 Number of Sales forecast
Square root of the RBF 2109 2623 2501 2698 1754 2209 3298 1301 1873 1688 Support Vector
Regression 0.75 0.79 2.83 2.81 0.98 0.87 0.54 1.37 4.52 1.17 Relative error %
Square root of the RBF 1.31 1.17 3.17 9.94 0.63 4.37 4.67 4.67 2.65 1.29 Support Vector
Regression 0.0512 Relative Mean square
error
Square root of the RBF 0.0600
2 2 1 1 ˆ ( ) N N i i i i i ARV y y y = = =
∑
−∑
4. ConclusionsCompared with the RBF neural network results, the paper apply the support vector regression method to predict the supply chain needs. The results show that the support vector regression which based on the principle of structural risk minimization overcomes easily trapped in local minimum, accuracy and generalization performance of an irreconcilable contradiction of neural network technology, and shows excellent performance in the supply chain demand forecast. Compared with the RBF neural networks, support vector regression method shows the smaller results of the relative mean square error, higher forecast accuracy in an instance of the supply chain needs. However, the calculation process is complicated relatively. It will have a good prospect if comb appropriately, the prepared the corresponding computer program and integrated into enterprise management software (Such as ERP etc).
References
[1] Bititci, Mendibil, K., Martinez, V. and Albores, P. Measuring and managing performance in extended enterprises. International Journal of Operations Production Management, 2005, Vol. 25 No. 4: 333-353.
[2] Lee H L, Padmanabhan V, Whang S. Information Distortion in a Supply Chain: 'The Bullwhip Effect. Management Science, 199'7,43(4):546-558.
[3] Rich N., and Hines P,. Supply chain management and time-based competition: the role of the supplier association, International Journal of Physical Distribution and Logistics Management, 1997,Vol. 27 No. 3¬4: 210-226.
[4] Spekman R.E., Davis E.W. Risky business: expanding the discussion on risk and the extended enterprise. International Journal of Physical Distribution and Logistics Management, 2004, Vol. 34 No. 5: 414-433.