Validation of Foot Pitch Angle Estimation Using Inertial Measurement Unit against
Marker-Based Optical 3D Motion Capture Systems
Shiva Sharif Bidabadi
Department of Mechanical Engineering, Curtin University of Technology, Perth, Australia
(+61) 892663475
Professor Iain Murray
Department of Electrical and Computer Engineering, Curtin University of Technology, Perth, Australia
Professor Gabriel Yin Foo Lee
St John of God Subiaco Hospital Perth, Australia and School of Surgery of University of Western Australia
Keywords:
Abstract:
Gait analysis is relevant to a broad range of clinical applications in areas of orthopedics, neurosurgery, rehabilitation and the sports medicine. There are various methods available for capturing and analyzing the gait cycle. Most of gait analysis methods are computationally expensive and difficult to implement outside the laboratory environment. Inertial measurement units, IMUs are considered a promising alternative for the future of gait analysis. This study reports the results of a systematic validation procedure to validate the foot pitch angle measurement captured by an IMU against Vicon Optical Motion Capture System, considered the standard method of gait analysis. It represents the first phase of a research project which aims to objectively evaluate the ankle function and gait patterns of patients with dorsiflexion weakness (commonly called a “drop foot”) due to a L5 lumbar radiculopathy pre- and post-lumbar decompression surgery. The foot pitch angle of 381 gait cycles from 19 subjects walking trails on a flat surface have been recorded throughout the course of this study. Comparison of results indicates a mean correlation of 99.542% with a standard deviation of 0.834%. The maximum root mean square error of the foot pitch angle measured by the IMU compared with the Vicon Optical Motion Capture System was 3.738º and the maximum error in the same walking trail between two measurements was 9.927º. These results indicate the level of correlation between the two systems.
1 INTRODUCTION
Gait analysis has received significant interest in orthopedics and rehabilitation applications [1]; it has important implications in many clinical settings. The term ‘Gait analysis’ refers to the systematic study of animal locomotion [2], specifically the study of human motion, using equipments to measure body movements and the activity of the muscles [2]. It involves measurement and analysis of measurable parameters such as absolute and relative angles, positions, movement patterns and joints’ range of motion. However, monitoring and measuring the human gait characteristics is a sophisticated task and thus, still rarely used for routine clinical evaluation [3]. There are three major commonly accepted methods available for gait analysis. The first and most common method is visual inspection. Second method is goniometric measurements, which is performed by goniometer that provides the range of motion in joints. Third is 3-dimensional marker-based optical motion capture (MBMOCAP) system which is an optoelectronic gait analysis method using optical motion capture for real-time 3-dimensional motion analysis [4] and considered as the standard method of movement analysis [5][6]. This
system utilizes retro-flective markers that allows visualization of multiple body regions by set of cameras and is highly reliable and accurate [5].
Current gait analysis methods are subject to various limitations [7]. For instance, relying on visual ability and diagnosis via observation of movements always governed by the medical practitioners’ experience and judgment, consequently they are inaccurate and subjective[3]. Additionally, goniometer most often used as a measure for static and passive movement (i.e. not during walking period). Moreover, MBMOCAP systems are usually complex, expensive and laboratory based method which requires software experts to operate the system and apply an inverse kinematic (with a complex exoskeletal model) to get joint angles. Thus its usage is extraordinarily time consuming and not practical for widespread usage in clinical environments [3].
Accurate gait analysis can be done using MBMOCAP, however, there is often a need for gait analysis to be accompanied outside of the laboratory environment, because not only in-laboratory walking varies from everyday typical walking but also gait laboratories do not lend themselves to portability[3].
To overcome these limitations new methodologies have been proposed recently using Inertial Measurement Units (IMU) [2]. In the past few years, several researches have used different types of sensors to identify gait characteristics and events [8] [9] [10] [11]. These studies applied and evaluated a variety of algorithms and sensor attachment locations [12]. For example, angular signals computed from gyroscope attached to the shank [8] and in a similar study, gyroscopes used to recognize normal walking from stair climbing [13]. Additionally, combinational usage of different sensor types suggested in earlier researches evaluating gait events using accelerometer and gyroscope readings for different walking speeds [14]. For example, it has been stated that the accuracy of gait evaluation systems increased by using gyroscopes and accelerometers [15]. The application of these sensors could expand the understanding of Equinus gait characteristics and also allows for an automatic detection of gait events [16]. Equinus defined as congenital deformity of the foot that leads to the walking on the toes without the heel contact to the ground. It is also proposed that the usage of gyroscope and accelerometer as a compact gait-analysis system, for monitoring daily movements in people with a walking disorder, is advantageous in clinical environment [16]. Also these sensor have been widely used in gait-based navigation systems [17][18].
An IMU consists of accelerometers, gyroscopes and magnetometer sensors in each axis (x, y and z) integrated into single unit [19][20].
The combination of these three sensors in a single device provides the measurements of angular velocity and acceleration in the sensor body frame. These, accompanied by micro-controllers, batteries and wireless communication, results in long-term, portable recordings of ambulatory measurements [3].
The case study of the proposed IMU gait analysis method will be in the field of neurosurgery/spinal surgery. One of the key goals of the study is to characterize and objectively document the walking gait cycle of patients with foot drop both pre- and post-lumbar spinal surgery. The patients recruited have a specific lumbar spine pathology whereby the clinical examination findings and imaging studies indicate a compressive lesion of the L5 lumbar nerve root, where possible, the majority of patients have also undertaken confirmatory electrophysiological testing. Patients with a foot drop often develop a characteristic gait disturbance. The proposed IMU solution offers evaluation of these disturbances. In this specific field the level of accuracy is important in assisting specialist in early intervention, quantitative assessment of impairment and indication of the next level of treatment, e.g. surgery [19]. Foot drop is commonly identified based on visual inspection and regardless of the significance of the gait measurements, currently there is no base-line as the accuracy required for foot drop identification.
The purpose of this study is to validate the gait cycle data accuracy captured by IMU sensors in comparison to a MBMOCAP system as the reference. In spite of MBMOCAP’s mentioned disadvantages, it is a proven and accepted method with a very high accuracy for the capture and analysis of human gait [5] [21].
The following section provides details of the experiment, followed by the methodologies that have been used to capture and analyze data with IMU and MBMOCAP system. The results of the comparison, conclusion and future works documented and discussed.
2 EXPERIMENTAL DESIGN
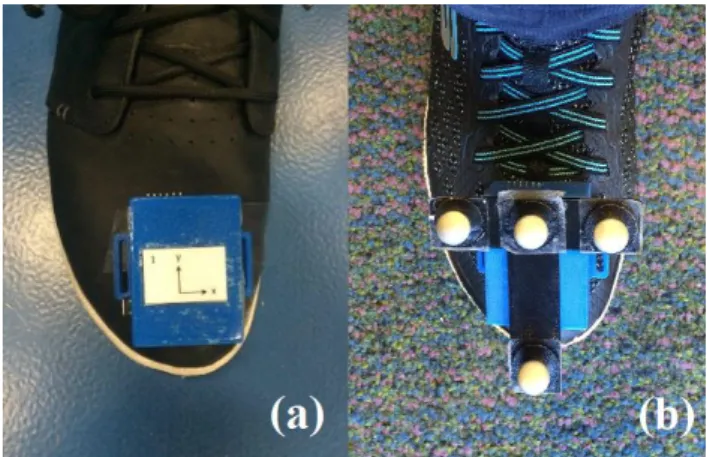
For validation purposes, an experiment was designed to capture the foot pitch angle using IMU and a MBMOCAP systems simultaneously during walking cycles of subjects with normal gait. Data have been acquired from a group of 19 subjects including 10 male and nine female physically fit, able-bodied, aged between 18 to 25 years, with no reported injury or disability. Any subject with lumbar spine, leg or walking problem was excluded from this study (the relevant ethics obtained). Fig. 1 indicates the data collection configuration for each test.
Subjects were asked to walk in a straight line with their natural walking style and initiate walking one second after the recording started. Both MBMOCAP and IMU data were recorded for two trials per subject.
In both systems, data logging were manually triggered independently before the subject start the walking trial. However, because of the manual triggering of systems, there might be a short (i.e. less than 2 seconds) offset between the systems’ readings. Because the frequency of the human gait cycle is roughly 2Hz, sampling rate of both IMU sensors and the MBMOCAP system specified as 100Hz to capture the details of each gait cycle.
Fig. 1. Data collection setup. (a) IMU attached to the foot. (b)IMU and T-shape reflective markers configuration.
3 METHODOLOGY
3.1 MAL
The MBMOCAP system utilized in this study is a Vicon 3D system (Fig. 2). This system consist of 18 semi-infrared camera that tracks semi-infrared reflective markers. The data from these cameras collected by an analogue data collector and transferred to a data acquisition computer. It is also possible to record the trails with digital video camera for farther review.
The components of Vicon 3D system are illustrated in Table I [22]. This system is located in the Motion Analyses Laboratory (MAL), Curtin University Perth, Australia [22]. The system was calibrated prior to each data collection session, to conform to the level of accuracy stated in the system specification [23].
Additionally, a cluster of markers placed on a 3d printed T-shaped holder on top of the IMU system (Fig. 1) to capture the foot pitch angle. Usually the markers should be placed on anatomical landmarks (malleolus, metatarsal etc.) to match the locations of a predefined model which calculates the angles. However, in this study, with respect to validation purpose, the cluster of markers must be in direct contact with sensor which placed on foot.
The data from MAL reprocessed using Vicon Nexus software so that the movement can be presented in the form of 3D coordinates of the markers at any given time stamp with respect to the origin point. The markers’ coordinates during each trail time exported into a comma separated value (CSV) file.
The desired output from MAL is the angle of the perpendicular vector of the plane that contains A ( ), B
( and C ( ), which would be the sensor plane, (Fig. 3) with respect to perpendicular vector to
the ground surface ( ) (Fig. 4).
Fig. 3. Labeling the reflective markers. (a) Normal view. (b) Vicon Nexus software view
To calculate this angle ( ) using the information provided by MAL (coordinate of A, B and C), firstly , which
is the sensor plane normal vector, calculated as follows (1)
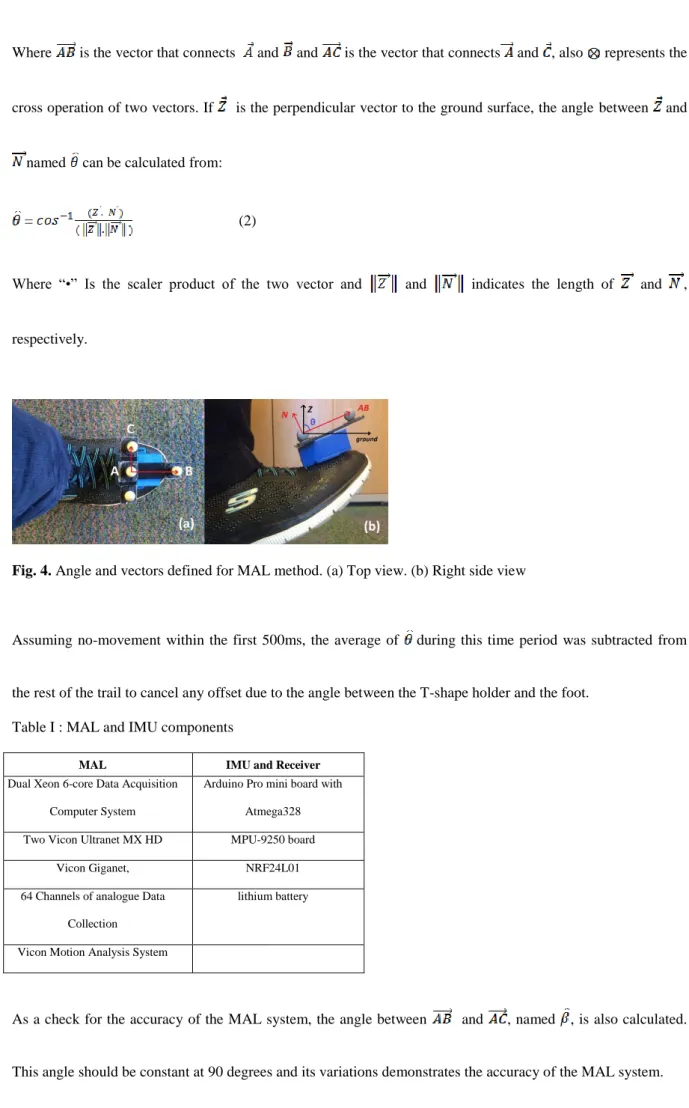
Where is the vector that connects and and is the vector that connects and , also represents the
cross operation of two vectors. If is the perpendicular vector to the ground surface, the angle between and
named can be calculated from:
= (2)
Where “•” Is the scaler product of the two vector and and indicates the length of and ,
respectively.
Fig. 4. Angle and vectors defined for MAL method. (a) Top view. (b) Right side view
Assuming no-movement within the first 500ms, the average of during this time period was subtracted from
the rest of the trail to cancel any offset due to the angle between the T-shape holder and the foot. Table I : MAL and IMU components
MAL IMU and Receiver
Dual Xeon 6-core Data Acquisition Computer System
Arduino Pro mini board with Atmega328
Two Vicon Ultranet MX HD MPU-9250 board
Vicon Giganet, NRF24L01
64 Channels of analogue Data Collection
lithium battery
Vicon Motion Analysis System
As a check for the accuracy of the MAL system, the angle between and , named , is also calculated.
3.2 IMU
An in-house designed IMU system has been used in this study as the second method of capturing the gait cycle which consist of three main components: a microcontroller, an IMU sensor and a wireless radio; all powered by a lithium battery. An Arduino Pro mini board (atmega328) [24] used to collect and timestamp measurements. An MPU-9250 board [25] used as the IMU sensor, containing 3-axis accelerometer, 3 axis gyroscope and 3-axis magnetometer sensor, as well as 16-bit analog-to-digital converters [25]. An NRF24L01 [26] used as the wireless communication unit to transfer the data packages into a PC via serial port and recorded as CSV file (Table I).
Each data package contains a timestamp with millisecond accuracy attached to accelerometer, gyroscope and magnetometer measurements in x, y and z axis.
The IMU system is installed in a 3D printed housing and attached to the right foot of subjects while the sensor’s y axis is pointing toward subject’s ankle and z axis is pointing upward (Fig. 1).
The desired output from IMU system is the angle between ground plane and sensor plane. This have been done by using the data from both accelerometer and gyroscope sensors. The accelerometer which used in this study is highly sensitive to vibration and reports a significant level of noise even when stationary. Moreover, the gyroscope data suffers from drift, (i.e. does not return to zero-rate when rotation stops). Nevertheless, by averaging the accelerometer and gyroscope data, a relatively accurate estimate of device orientation can be obtained [26]. To address these matters, a filtering and sensor fusion method used which explained in detail at [27]. Following is an overview about the sensor fusion method.
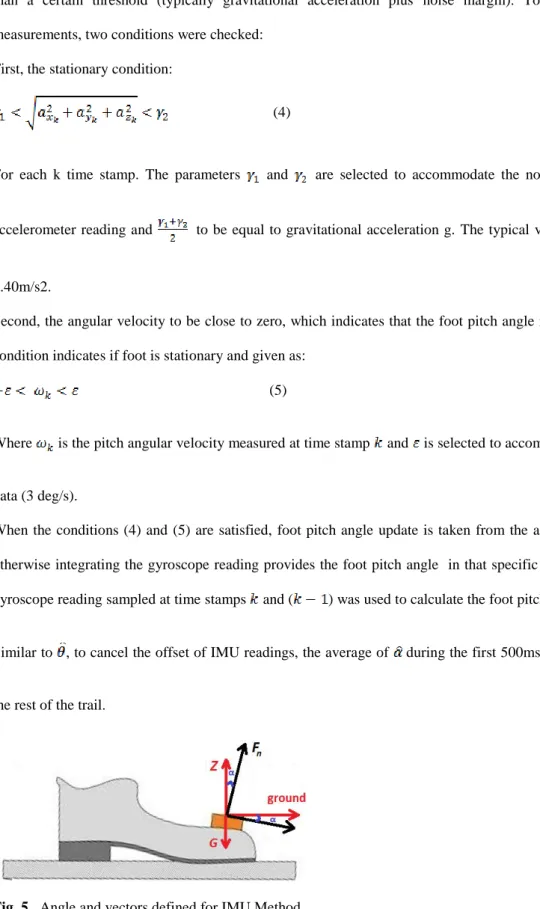
The accelerometer sensors of the IMU report the normal force ( ) applied to the IMU plane in the form of
and . Thus, when the sensor is stationary the output of accelerometer is the gravitational force in
opposite direction, (Fig. 5). It is assumed the gravitational force is always perpendicular to the ground surface [28].
The angle of the sensor plane with respect to perpendicular vector to the ground surface can be calculated
using the formula: (3)
However this estimation can only be used if the total acceleration measured by the accelerometer sensor is less than a certain threshold (typically gravitational acceleration plus noise margin). To use accelerometers measurements, two conditions were checked:
First, the stationary condition:
(4)
For each k time stamp. The parameters and are selected to accommodate the noise embedded in the
accelerometer reading and to be equal to gravitational acceleration g. The typical value for and is
1.40m/s2.
Second, the angular velocity to be close to zero, which indicates that the foot pitch angle is not changing. This condition indicates if foot is stationary and given as:
(5)
Where is the pitch angular velocity measured at time stamp and is selected to accommodate error in gyro
data (3 deg/s).
When the conditions (4) and (5) are satisfied, foot pitch angle update is taken from the accelerometer reading otherwise integrating the gyroscope reading provides the foot pitch angle in that specific axis. The average of gyroscope reading sampled at time stamps and ( ) was used to calculate the foot pitch angle output for .
Similar to , to cancel the offset of IMU readings, the average of during the first 500ms was subtracted from
the rest of the trail.
4 RESULTS AND DISCUSSION
In this section the outcome from both methods of IMU and MAL illustrated and discussed.
Maximum, minimum and standard deviation of , which are measures for the accuracy of MAL system,
calculated as 90.014º, 88.014º and 0.373º, respectively.
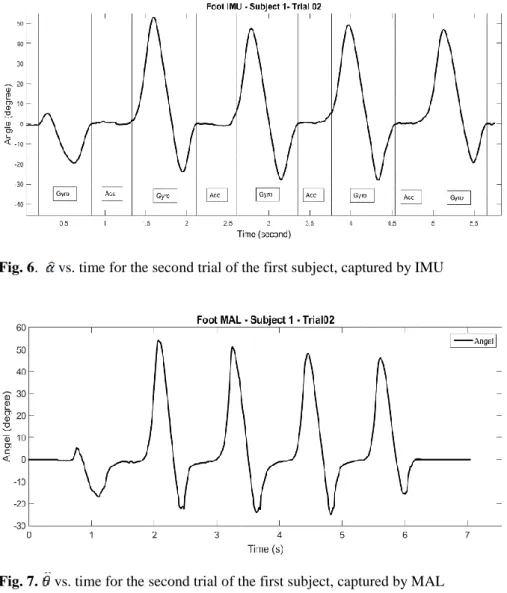
The and for one of the subjects during the second trial indicated in Fig. 6 and Fig. 7, respectively.
In Fig. 6, areas that are labeled “Gyro” and “Acc” indicates if the foot pitch angle is calculated using gyroscope or accelerometer, respectively.
Fig. 6. vs. time for the second trial of the first subject, captured by IMU
Fig. 7. vs. time for the second trial of the first subject, captured by MAL
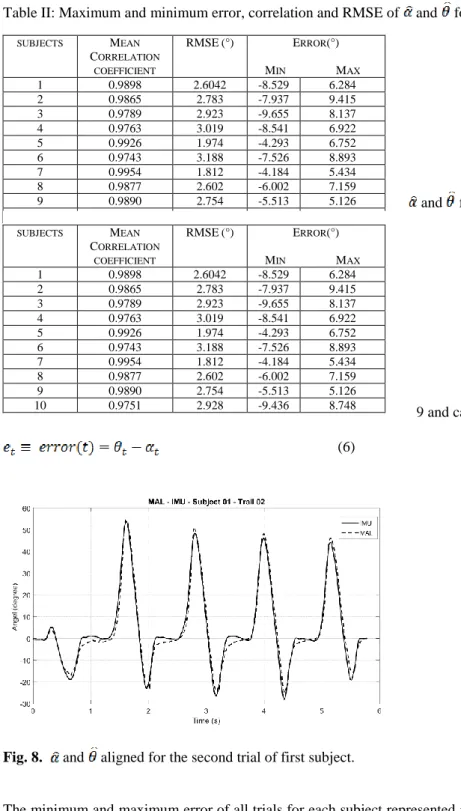
To solve the misalignment caused by manual triggering, an offset has been applied to both signals based on the first peek of the signals (Fig. 8). Using the aligned angles, the level of similarity between them have been compared by three indices: error, RMSE and correlation.
Table II: Maximum and minimum error, correlation and RMSE of and for male subjects
Table III: Maximum and minimum error, correlation and RMSE of and for male subjects
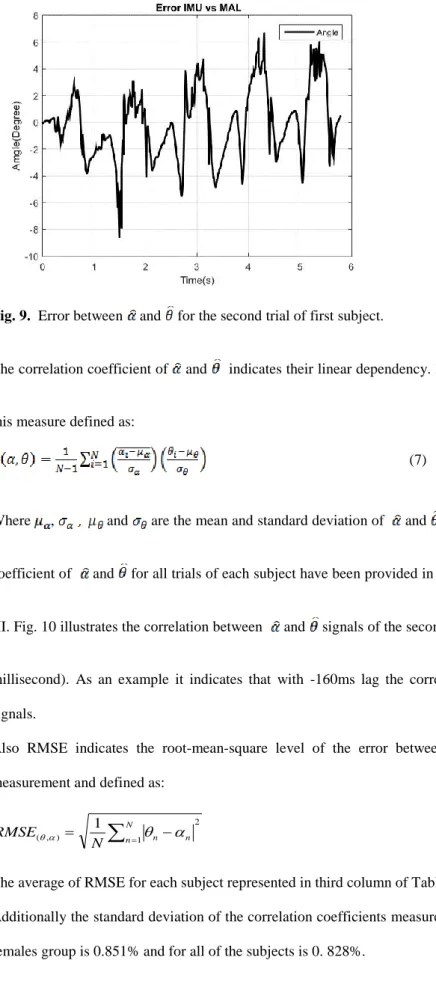
The error between two signals at any given time, t, illustrated in Fig. 9 and calculated as follows:
(6)
Fig. 8. and aligned for the second trial of first subject.
The minimum and maximum error of all trials for each subject represented in fourth and fifth columns of Table II and Table III, respectively.
SUBJECTS MEAN CORRELATION COEFFICIENT RMSE(°) ERROR(°) MIN MAX 1 0.9898 2.6042 -8.529 6.284 2 0.9865 2.783 -7.937 9.415 3 0.9789 2.923 -9.655 8.137 4 0.9763 3.019 -8.541 6.922 5 0.9926 1.974 -4.293 6.752 6 0.9743 3.188 -7.526 8.893 7 0.9954 1.812 -4.184 5.434 8 0.9877 2.602 -6.002 7.159 9 0.9890 2.754 -5.513 5.126 10 0.9751 2.928 -9.436 8.748 SUBJECTS MEAN CORRELATION COEFFICIENT RMSE(°) ERROR(°) MIN MAX 1 0.9898 2.6042 -8.529 6.284 2 0.9865 2.783 -7.937 9.415 3 0.9789 2.923 -9.655 8.137 4 0.9763 3.019 -8.541 6.922 5 0.9926 1.974 -4.293 6.752 6 0.9743 3.188 -7.526 8.893 7 0.9954 1.812 -4.184 5.434 8 0.9877 2.602 -6.002 7.159 9 0.9890 2.754 -5.513 5.126 10 0.9751 2.928 -9.436 8.748
Fig. 9. Error between and for the second trial of first subject.
The correlation coefficient of and indicates their linear dependency. If each angle has N scalar observation
this measure defined as:
(7)
Where , and are the mean and standard deviation of and respectively. The average correlation
coefficient of and for all trials of each subject have been provided in the first column of Table II and Table
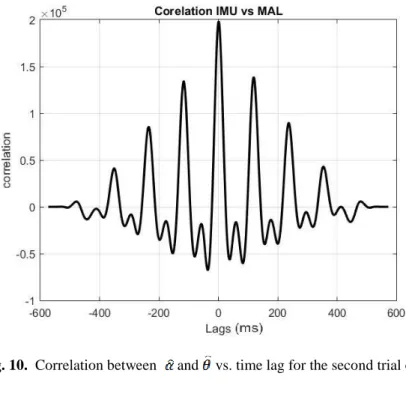
III. Fig. 10 illustrates the correlation between and signals of the second trial of subject-1 versus time lag (in
millisecond). As an example it indicates that with -160ms lag the correlation is maximum between the two signals.
Also RMSE indicates the root-mean-square level of the error between two signals over the time of the measurement and defined as:
2 1 ) , ( 1
N n n n N RMSE (8) The average of RMSE for each subject represented in third column of Table II and Table III.Additionally the standard deviation of the correlation coefficients measured for males group is 0.773 % and for females group is 0.851% and for all of the subjects is 0. 828%.
Fig. 10. Correlation between and vs. time lag for the second trial of first subject.
The Table II and Table III are representing the measures mentioned above for each female and male subject respectively. The following section discuss the comparison between the two signals.
For the two angles, and , obtained using two different methods IMU and MAL, the amount of RMSE is
relatively low. That indicates the level of similarity between the results of the two system. The maximum value of RMSE among all of the samples in this study is 3.738º and the minimum RMSE value is 1.589º
Also the correlation coefficient of max 99.542% and min 96.891% indicates the similar trend of both signals during each gait cycle which is also visible in Fig. 9. Moreover, and illustrating minor differences during
the stand phase of the gait cycle which is caused by the vibration at the contact of the foot and ground. Although the vibration is the same for both systems, it has different effect regarding the accuracy of and , which is
the effect of low pass filter applied on . Moreover, the standard deviation of 0.834% represents that the
experiment was repeatable among all trails.
As mentioned in the introduction section, the current clinical method to measure foot pitch angle is not accurate and subjective. Therefore, the illustrated results are relatively accurate compering to the visual inspection method.
5 CONCLUSION
During this study the results of foot pitch angle measurements from two different gait analysis methods have been compared and validated through three different measures, which are correlation, RMSE and error. The outcome illustrated the level of similarity between the angle measurements from these two methods. Based on the validation results obtained, IMU device is reliable enough to be used in gait analysis applications that require accuracy and portability.
Resulting from the initial study, future improvements to the system were identified. For example, it is desirable to provide visualization feature to the current IMU system. This can be done by adding two digital cameras capturing video in two directions and synchronizing the videos with IMU measurements. Moreover, a user friendly software interface can potentially improve the usability of the system which will ideally get used by medical practitioners and physiotherapists.
Summation, this experiment has shown that the use of IMUs is a possible solution to the issues encountered with MBMOCAP systems such as the lack of portability and expense by providing a portable low cost alternative with a minimal sacrifice in accuracy.
6 Acknowledgements
We are grateful to The Kailis foundation group, ST John of God healthcare group, for the funding of this project.
7 Ethical approval
This study involves Human subjects and the relevant ethical approvals obtained from Curtin University of Technology (Human Research Ethics Office): HR 12/2016 and St John of God healthcare group (HREC): 823. 8 Conflict of interest
There is no conflict of interests among authors. 9 References
[1] R. Baker, “Gait analysis methods in rehabilitation,” J. Neuroeng. Rehabil., vol. 3, p. 4, 2006.
[2] W. Tao, T. Liu, R. Zheng, and H. Feng, “Gait analysis using wearable sensors.,” Sensors (Basel)., vol. 12, no. 2, pp. 2255–83, Jan. 2012.
[3] T. Cloete and C. Scheffer, “Repeatability of an off-the-shelf, full body inertial motion capture system during clinical gait analysis,”
[4] H. Zhou and H. Hu, “Human motion tracking for rehabilitation-A survey,” Biomed. Signal Process. Control, vol. 3, no. 1, pp. 1–18, 2008.
[5] T. B. Moeslund and V. Krüger, “A survey of advances in vision-based human motion capture and analysis,” Comput. Vis. Image Underst., vol. 104, no. 2, pp. 90–126, 2006.
[6] J. Cockcroft, “An evaluation of inertial motion capture technology for use in the analysis and optimization of road cycling kinematics,” no. March, 2011.
[7] S. R. Simon, “Quantification of human motion: Gait analysis - Benefits and limitations to its application to clinical problems,” J. Biomech., vol. 37, no. 12, pp. 1869–1880, 2004.
[8] K. Tong and M. H. Granat, “A practical gait analysis system using gyroscopes.pdf,” vol. 21, pp. 87–94, 1999.
[9] I. P. I. Pappas, T. Keller, S. Mangold, M. R. Popovic, V. Dietz, and M. Morari, “A Reliable Gyroscope-Based Gait-Phase Detection Sensor Embedded in a Shoe Insole,” IEEE Sens. J., vol. 4, no. 2, pp. 268– 274, 2004.
[10] B. Auvinet et al., “Reference data for normal subjects obtained with an accelerometric device,” Gait Posture, vol. 16, no. 2, pp. 124–134, 2002.
[11] K. Aminian, B. Najafi, C. Büla, P. F. Leyvraz, and P. Robert, “Spatio-temporal parameters of gait measured by an ambulatory system using miniature gyroscopes,” J. Biomech., vol. 35, no. 5, pp. 689– 699, 2002.
[12] Y. Huang, W. Jirattigalachote, M. R. Cutkosky, X. Zhu, and P. B. Shull, “Novel Foot Progression Angle Algorithm Estimation via Foot-Worn, Magneto-Inertial Sensing,” IEEE Trans. Biomed. Eng., vol. 63, no. 11, pp. 2278–2285, 2016.
[13] B. Coley, B. Najafi, A. Paraschiv-Ionescu, and K. Aminian, “Stair climbing detection during daily physical activity using a miniature gyroscope,” Gait Posture, vol. 22, no. 4, pp. 287–294, 2005.
[14] R. E. Mayagoitia, A. V. Nene, and P. H. Veltink, “Accelerometer and rate gyroscope measurement of kinematics: An inexpensive alternative to optical motion analysis systems,” J. Biomech., vol. 35, no. 4, pp. 537–542, 2002.
[15] G. Wu and Z. Ladin, “The study of kinematic transients in locomotion using the integrated kinematic sensor,” IEEE Trans. Rehabil. Eng., vol. 4, no. 3, pp. 193–200, 1996.
[16] H. Lau and K. Tong, “The reliability of using accelerometer and gyroscope for gait event identification on persons with dropped foot,” Gait Posture, vol. 27, no. 2, pp. 248–257, 2008.
[17] H. Fourati, “Heterogeneous data fusion algorithm for pedestrian navigation via foot-mounted inertial measurement unit and complementary filter,” IEEE Trans. Instrum. Meas., vol. 64, no. 1, pp. 221–229, 2015.
[18] F. Woyano, S. Lee, and S. Park, “Evaluation and comparison of performance analysis of indoor inertial navigation system based on foot mounted IMU,” Int. Conf. Adv. Commun. Technol. ICACT, vol. 2016– March, pp. 792–798, 2016.
[19] Q. Li, M. Young, V. Naing, and J. M. Donelan, “Walking speed and slope estimation using shank-mounted inertial measurement units,” 2009 IEEE Int. Conf. Rehabil. Robot. ICORR 2009, pp. 839–844, 2009.
[20] H. J. Luinge, P. H. Veltink, and C. T. M. Baten, “Ambulatory measurement of arm orientation,” J. Biomech., vol. 40, no. 1, pp. 78–85, 2007.
[21] J. C. Van Den Noort, H. G. Kortier, N. Van Beek, D. H. E. J. Veeger, and P. H. Veltink, “Measuring 3D hand and finger kinematics - A comparison between inertial sensing and an opto-electronic marker system,” PLoS One, vol. 11, no. 11, pp. 1–16, 2016.
[22] Curtin university, “Motion Anlysis Lab, Facilities and Locations,school and departments,” 2015. [Online]. Available: http://healthsciences.curtin.edu.au/schools-and-departments/physiotherapy-exercise-science/facilities/.
[23] M. Windolf, N. Gö Tzen, and M. Morlock, “Systematic accuracy and precision analysis of video motion capturing systems—exemplified on the Vicon-460 system.”
[24] S. W. List, “Using the Arduino Pro Mini 3 . 3V,” pp. 1–9. [25] R. Chokshi, “datasheet RS-MPU-6000A-00,” p. 52, 2015.
[26] A. Noureldin, T. B. Karamat, and J. Georgy, Fundamentals of Inertial Navigation, Satellite-based Positioning and their Integration, vol. 58, no. 12. Berlin, Heidelberg: Springer Berlin Heidelberg, 2013. [27] S. Sharif Bidabadi, I. Murray, and G. Lee, “The application of Inertial Measurements Unit for the
clinical evaluation and assessment of gait events,” J. Med. Eng. Technol., vol. ISSN homep, pp. 309– 1902, 2017.
[28] A. Kim and M. Golnaraghi, “A quaternion-based orientation estimation algorithm using an inertial measurement unit,” Position Locat. Navig. Symp. 2004, no. May 2004, pp. 268–272, 2004.