1-1-2003
Engineering properties and construction guidelines for soil
Engineering properties and construction guidelines for soil
stabilized with self-cementing fly ash
stabilized with self-cementing fly ash
Zach ThomasIowa State University
Follow this and additional works at: https://lib.dr.iastate.edu/rtd
Recommended Citation Recommended Citation
Thomas, Zach, "Engineering properties and construction guidelines for soil stabilized with self-cementing fly ash" (2003). Retrospective Theses and Dissertations. 20063.
https://lib.dr.iastate.edu/rtd/20063
This Thesis is brought to you for free and open access by the Iowa State University Capstones, Theses and
Dissertations at Iowa State University Digital Repository. It has been accepted for inclusion in Retrospective Theses and Dissertations by an authorized administrator of Iowa State University Digital Repository. For more information, please contact digirep@iastate.edu.
cementing fly ash
byZachary Guy Thomas
A thesis submitted to the graduate faculty
In partial fulfillment of the requirements for the degree of MASTER OF SCIENCE
Major: Civil Engineering (Geotechnical Engineering)
Program of Study Committee David J. White (Major Professor)
Halil Ceylan Stanley J. Henning
Iowa State University Ames, Iowa
Graduate College Iowa State University
This to certify that the master's thesis of Zachary Guy Thomas
has met the thesis requirements of Iowa State University
TABLE OF CONTENTS
TABLE OF CONTENTS ... iii
LIST OF FIGURES ... vii
LIST OF TABLES ... xiv
INTRODUCTION ... 1 OBJECTNE ... 3 LITERATURE REVIEW ... 4 Introduction ... 4 Construction Operations ... 4 Mixing ... 4 Application of Water ... 6
Compaction of Fly Ash Stabilized Soil ... 7
Curing of Completed Fly Ash Stabilized Sections ... 8
Quality Control Testing ... 10
Field Testing ... 10
In-Place Density Determination ... 10
Moisture Content Determination ... 11
Stability of Compacted Material.. ... 12
In-Service Performance Testing ... 13
Non Destructive Testing ... 13
Destructive Testing ... 13
Construction Method Specifications .... , ... 14
Engineering Properties of Coal Combustion Products ... 14
Self-Cementing Fly Ash and Soil Mixtures ... 14
Modification of Plasticity Characteristics and Swell Potential.. ... 15
Strength Gain Due to Addition of Self-Cementing Fly Ash ... 16
Hydrated Fly Ash and Conditioned Fly Ash ... 19
Hydrated Fly Ash/Conditioned Fly Ash and Soil ... 21
Chemistry of Self-Cementing Fly Ash ... 22
Chemical Composition and Reaction Mechanisms of Self-Cementing Fly Ash ... 22
Negative Reactions Resulting from Pozzolans and Sulfur ... 24
Case Histories Involving Self-Cementing Fly Ash Stabilization ... 28
Self-Cementing Fly Ash Stabilization for an Industrial Road, Missouri ... 28
Low Cost Fly Ash Stabilized Sand, Des Moines County, Iowa ... 28
Recycled Pavement, Shawnee County, Kansas ... 29
Construction of the Heartland Park Race Track, Topeka, Kansas ... 30
Northwest Highway Fly Ash Stabilization, Oklahoma ... 30
Landfill Access Road, Ottumwa, Iowa ... 32
Hydrated Fly Ash as Select Fill, Chillicothe, Iowa ... 33
Fly Ash Stabilization of RAP, Waukesha County, Wisconsin ... 34
Fly Ash Stabilization of City Streets, Overland Park, Kansas ... 35
Fly Ash RAP Stabilization of Parking Lots, Ames, IA ... 35
SOURCES AND MATERIAL PROPERTIES OF SOIL, RAW FLY ASH, AND HYDRATED AND CONDITIONED FLY ASH ... 37
Material Sources ... 37
Soils ... 37
Turin, Iowa Loess ... 37
Neola, Iowa Alluvium ... 37
Le Grand, Iowa Loess ... 37
Cedar Rapids, Iowa Glacial Till.. ... 38
Argyle, Iowa Paleosol ... 38
Self-Cementing Fly Ash ... 38
Ottumwa Fly Ash ... 38
Council Bluffs Fly Ash ... 39
Louisa Fly Ash ... 39
Ames Fly Ash ... 39
Prairie Creek Fly Ash ... 40
Port Neal Fly Ash ... 40
Sutherland Fly Ash ... 40
Hydrated and Conditioned Fly Ash ... 41
Ottumwa Hydrated Fly Ash ... 41
Port Neal Hydrated Fly Ash ... 41
Council Bluffs Hydrated Fly Ash ... 41
Louisa Hydrated Fly Ash ... 41
Prairie Creek Conditioned Fly Ash ... 42
Sutherland Conditioned Fly Ash ... 42
Material Properties of Soils ... 42
Grain Size Distribution ... 42
Plasticity Characteristics and Engineering Classification ... 44
Specific Gravity ... 44
Clay Mineralogy ... 44
Moisture-Density Relationships and Unconfined Compressive Strength ... 53
Engineering Properties of Self-Cementing Fly Ash ... 56
X-Ray Analysis ... 56
Fly Ash Set Time ... 58
Fly Ash Paste Strength ... 62
Engineering Properties of Hydrated and Conditioned Fly Ash ... 64
Grain Size Distribution ... 64
X-Ray Analysis ... 65
COMPACTION CHARACTERISTICS OF SOIL STABILZED WITH
SELF-CEMENTING FLY ASH ... 70
Effect of Fly Ash Addition on Moisture-Density Relationships ... 70
Influence of Compactive Effort on Moisture-Density Relationships ... 73
Influence of Compaction Delay on Unit Weight and Moisture-Density Relationships ... 75
STRENGTH OF SELF-CEMENTING FLY ASH AND SOIL ... 79
Influence of Compactive Effort on Strength Gain ... 79
Influence of Compaction Delay on Strength Gain ... 82
Long-Term Strength Gain of Soil Stabilized with Self-Cementing Fly Ash ... 86
Unconfined Compressive Strength of Soil Stabilized with Self-Cementing Fly Ash ... 90
California Bearing Ratio of Self-Cementing Fly Ash Stabilized Soil ... 99
SOIL MODIFICATION DUE TO THE ADDITION OF SELF-CEMENTING FLY ASH ... 105
Self-Cementing Fly Ash as a Drying Agent ... 105
Reduction of Swell Potential with Self-Cementing Fly Ash Addition ... 110
Modification of Plasticity Characteristics of Soils ... 113
INFLUENCE OF CURING ENVIRONMENT ON STRENGTH GAIN AND FREEZE-THAW DURABILITY OF SOIL-FLY ASH ... 118
Curing Environment ... 118
Freeze-Thaw Durability ... 124
STRENGTH OF HYDRATED AND CONDITIONED SELF-CEMENTING FLY ASH .. 138
Influence of Moisture Content on Strength Gain ... 138
Influence of Compaction Delay on Strength Gain ... 141
Influence of Curing Temperature on Strength Gain ... 141
Shear Strength Parameters of Hydrated and Conditioned Fly Ash ... 144
STRENGTH GAIN OF SOIL STABILIZED WITH HYDRATED AND CONDITIONED FLY ASH ... 147
Soil and Hydrated Fly Ash ... 147
Ottumwa HF A and Soil ... 148
Council Bluffs HF A and Soil. ... 148
Prairie Creek CFA and Soil ... 149
STATISTICAL MODELLING OF SELF-CEMENTING FLY ASH CHEMISTRY AND SET TIME ... 151
SUMMARY AND CONCLUSIONS ... 156
APPENDIX A: X-RAY DIFFRACTOGRAMS FOR FLY ASH AND HYDRATED
AND CONDITIONED FLY ASH ... 163 APPENDIXB: STRESS-STRAINDATA ... 174 APPENDIX C: ELEMENTAL CHEMISTRY AND SET TIMES OF NEBRASKA
SELF-CEMENTING FLY ASHES ... 180 APPENDIX D: PROPOSED RECOMMENDATIONS FOR CONSTRUCTING
SELF-CEMENTING FLY ASH STABILIZED SUBGRADE ... 185 APPENDIX E: PROPOSED RECOMMENDATIONS FOR CONSTRUCTING
HYDRATED FLY ASH AS SUBGRADE MATERIAL. ... 200 APPENDIX F: PROPOSED RECOMMENDATIONS FOR CONSTRUCTING
CONDITIONED FLY ASH AS SUBGRADE MATERIAL ... 208 BIBLIOGRAPHY ... 216 ACKNOWLEDGEMENTS ... 222
LIST OF FIGURES
Figure 1. Typical Pulvamixer Used for On-Site Mixing ... 6
Figure 2. Particle Size Distribution of Soils Used in Study ... 43
Figure 3. SEM Image at 20,000x of Le Grand Loess Clay Fraction(< 2 microns) ... 46
Figure 4. SEM Image at 20,000x of Alluvium Clay Fraction(< 2 microns) ... 47
Figure 5. SEM Image at 20,000x of Glacial Till Clay Fraction (< 2 microns) ... 4 7 Figure 6. SEM Image at 20,000x of Paleosol Clay Fraction(< 2 microns) ... 48
Figure 7. EDS Elemental Map of Le Grand Loess Clay Fraction ( < 2 microns) ... 49
Figure 8. EDS Elemental Map of Alluvium Clay Fraction(< 2 microns) ... 49
Figure 9. EDS Elemental Map of Glacial Till Clay Fraction ( < 2 microns) ... 50
Figure 10. EDS Elemental Map of Paleosol Clay Fraction(< 2 microns) ... 50
Figure 11. TGA Results for Soil Clay Fractions ( < 2 microns) ... 52
Figure 12. DTA Results for Soil Clay Fractions(< 2 microns) ... 52
Figure 13. Moisture-Density Relationships of Soils Used in the Study ... 54
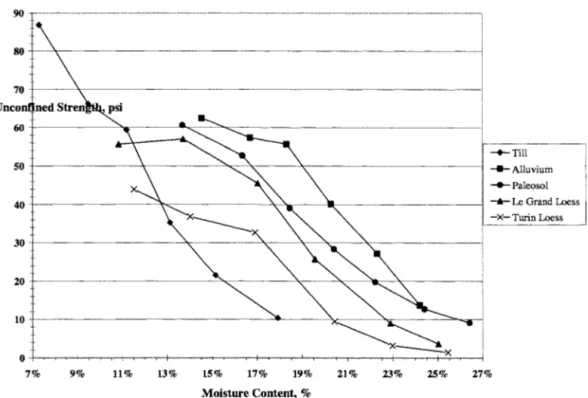
Figure 14. Moisture-Strength Relationships of Soils Used in the Study ... 55
Figure 15. Set Time of Class C Fly Ashes Used in the Study ... 60
Figure 16. Set Time of Non-Class C Fly Ashes Used in the Study ... 61
Figure 17. Class C Fly Ash Paste Strength ... 63
Figure 18. Class C and Non-Class C Fly Ash Paste Strength ... 63
Figure 19. Particle Size Distribution of Hydrated and Conditioned Fly Ash ... 64
Figure 20. Moisture-Density Relationships of Hydrated and Conditioned Fly Ash Used in the Study ... 69
Figure 21. Influence of Fly Ash Addition on the in Moisture-Density Relationship of Turin Loess Determined by Standard Proctor and ISU 2-in x 2-in Methods ... 72
Figure 22. Influence of Fly Ash Addition on the Moisture-Density Relationship of Le
Grand Loess Determined by Standard Proctor and ISU 2-in x 2-in Methods ... 72
Figure 23. Influence of Compaction Energy on Moisture-Density-Relationship of Till and 12% OGS Ash ... 74
Figure 24. Influence of Compaction Energy on Moisture-Density Relationship of Alluvium and 12% OGS Ash ... 74
Figure 25. Influence of Compaction Delay on Total Unit Weight of Turin Loess and 20% Ash ... 75
Figure 26. Influence of Compaction Delay on Total Unit Weight of Turin Loess and 20% Fly Ash ... 76
Figure 27. Influence of Long-Term Compaction Delay on Paleosol and 20% PC3+4 Ash .. 78
Figure 28. Influence of Compaction Energy on Alluvium and 12% OGS Ash ... 80
Figure 29. Influence of Compaction Energy on Glacial Till and 12% OGS Ash ... 81
Figure 30. Influence of Compaction Delay on Strength Gain of Class C Fly Ash and Turin Loess ... 84
Figure 31. Influence of Compaction Delay on Strength Gain of Non-Class C Ash and Turin :Loess ... 84
Figure 32. Influence of Long-Term Compaction Delay on Strength Gain of Paleosol and 20% PC3+4 Fly Ash ... 85
Figure 33. 24-Hour Compaction Delay Samples After Soaking (Molded Moisture Content Decreases From Top to Bottom) ... 86
Figure 34. Long-Term Strength Gain of Glacial Till and Fly Ash ... 88
Figure 35. SEM Image Showing Ettringite Formation in AFBC Stabilized Glacial Till ... 88
Figure 36. SEM Image of Glacial Till Stabilized with 20% PC 3+4 Fly Ash ... 89
Figure 37. Compressive Strength of 2-in x 2-in and Proctor Samples of Le Grand Loess and Fly Ash ... 93
Figure 38. Compressive Strength of 2-in x 2-in and Proctor Samples of Turin :Loess and Fly Ash ... 93
Figure 39. Unconfined Compressive Strength of Le Grand Loess and Fly Ash ... 94
Figure 40. Strength Results of Alluvium Stabilized with CB Fly Ash ... 94
Figure 41. 2-in x 2-in and UCS Strength of Paleosol and Fly Ash ... 95
Figure 42. Correlation Between 2-in x 2-in and Proctor Compressive Strengths ... 95
Figure 43. Correlation Between 2-in x 2-in Compressive Strength and True UCS ... 97
Figure 44. Correlation Between Proctor Compressive Strength and True UCS ... 97
Figure 45. Correlation Between 2-in x 2-in Compressive Strength and Corrected UCS ... 98
Figure 46. Correlation Between Proctor Compressive Strength and Corrected UCS ... 98
Figure 47. CBR Versus Moisture Content of Le Grand Loess and Fly Ash ... 101
Figure 48. Correlation Between CBR and UCS for Le Grand Loess and Fly Ash ... 103
Figure 49. Correlation Between CBR and 2-in x 2-in Compressive Strength for Le Grand Loess and Fly Ash ... 103
Figure 50. Correlation Between CBR and Proctor Compressive Strength for Le Grand Loess and Fly Ash ... 104
Figure 51. Actual Moisture Difference Versus Theoretical Moisture Difference ... 107
Figure 52. Strength Gain of Turin Loess Dried with SGS Fly Ash ... 108
Figure 53. Strength Gain of Turin Loess Dried with PC3+4 Fly Ash ... 109
Figure 54. Strength Gain of Turin Loess Dried with OGS Fly Ash ... 109
Figure 55. Strength Gain of Turin Loess Dried with PN4 Fly Ash ... 110
Figure 56. Swell of Paleosol-High Sulfur Fly Ash Mixtures ... 113
Figure 57. Liquid Limit and Plasticity Index of Alluvium and 20% of Various Self-Cementing Fly Ashes ... 115
Figure 58. Liquid Limit Change of Alluvium and 20% of Various Self-Cementing Fly Ashes ... 116
Figure 60. Influence of Curing Environment on Strength Gain of Turin Loess and PN4 Fly Ash...o....o....o r... o.. o. o o o. o... 1 19
Figure 61. Influence of Curing Environment on Sftength Gain of Paleosol and LGS Fly
Ash...
... 119Figure 62. Swelling and Cracking After Soaking of Paleosol and Fly Ash Cured at 8" F,. 121 Figure 63. Paleosol and Fly Ash Cured at70" F After Soaking 122 Figure 64. Paleosol and Fly Ash Cured at 100o F After Soaking r22 Figure 65. Figure 66. Figure 67. Figure 68. Figure 69. Figure 70. Figure '7 L. Role of Autogenous Healing in Self-Cementing Fly Ash-SoilMixtures...l23 Freeze-Thaw Durability of Turin l.oess and Fly Ash by ASTM C593...125
Freeze-Thaw Durability of Paleosol and Fly Ash by ASTM C593 ...I25 Vacuum Saturated Turin Loess and FIy Ash After Curing at 100" F ... ..126
Vacuum Saturated Paleosol and FIy Ash After Curing at 100o F... ...127
Volumetric Stability of [,e Grand Loess (0, 10, 20VoFly Ash) and OGS
IIFA.
130 Maximum Volume Change of t e Grand Loess (0, 10, 2OVoFly Ash), OGS HFA, and SGS CFA... ... 130Figure 72. SGS CFA After One Freeze-Thaw
Cycle
.... 131Figure 73. I-e, Grand Loess After One Freeze-Thaw
Cycle
... 131Figure 74. Le Grand Loess After Second Freeze Cycle .. ... 132
Figure 75. l-e, Grand Loess After Second Freeze-Thaw
Cycle...
... 132Figure 76. Moisture Content Increase of ASTM D560 Volumetric Stability Samples... 133
Figure 77. Percentage of Molded Mass Before and After Brushing for each Cycle... 135
Figure 78. I-e, Grand Loess Number 2 Sample After First Cycle Brushing t36 Figure 79. SGS CFA Prior to Second Cycle Brushing . ... L36 Figure 80. SGS CFA After Second Cycle
Brushing...
...137Figure 81. Influence of Moisture Content on Strength Gain of HF A and CF A ... 139
Figure 82. Long-Term Strength Gain of Ottumwa HF A Molded at Different Moisture Contents ... 140
Figure 83. Influence of Compaction Delay on Strength Gain of HFA and CFA ... 142
Figure 84. Influence of Curing Temperature on Strength Gain of Ottumwa HFA ... 143
Figure 85. P-Q Plot of Ottumwa HF A ... 144
Figure86. P-QPlotofPortNealHFA ... 145
Figure 87. P-Q Plot of Prairie Creek CF A ... 145
Figure 88. Strength Gain of Le Grand Loess Stabilized with OGS HFA ... 149
Figure 89. Strength Gain of Le Grand Loess Stabilized with CB HFA ... 150
Figure 90. Strength Gain of Le Grand Loess Stabilized with PC CFA ... 150
Figure 91. Actual Versus Predicted Set Time for Nebraska Self-Cementing Fly Ashes .... 152
Figure 92. Actual Versus Predicted Set Time for Iowa Self-Cementing Fly Ashes ... 153
Figure 93. X-Ray Diffractogram for Neola Alluvium Clay Fraction ( < 2 microns) ... 164
Figure 94. X-Ray Diffractogram for Cedar Rapids Till Clay Fraction(< 2 microns) ... 164
Figure 95. X-Ray Diffractogram for Argyle Paleosol Clay Fraction ( < 2 microns) ... 165
Figure 96. X-Ray Diffractogram for Le Grand Loess Clay Fraction(< 2 microns) ... 165
Figure 97. X-Ray Diffractograms for PN3 Old and PN3 New Fly Ash ... 166
Figure 98. X-Ray Diffractograms for PN4 Old and PN4 New Fly Ash ... 166
Figure 99. X-Ray Diffractograms for CB Old and CB New Fly Ash ... 167
Figure 100. X-Ray Diffractograms For LOS New and LOS Old Fly Ash ... 167
Figure 101. X-Ray Diffractogram for OGS New Fly Ash ... 168
Figure 103. X-Ray Diffractogram for Ames Fly Ash ... 169
Figure 104. X-Ray Diffractogram for PC3+4 Fly Ash ... 169
Figure 105. X-Ray Diffractogram For SGS Fly Ash ... 170
Figure 106. X-Ray Diffractogram for PN Hydrated Fly Ash ... 170
Figure 107. X-Ray Diffractogram for LGS Hydrated Fly Ash ... 171
Figure 108. X-Ray Diffractogram for CB Hydrated Fly Ash ... 171
Figure 109. X-Ray Diffractogram for OGS Hydrated Fly Ash ... 172
Figure 110. X-Ray Diffractogram for PC Conditioned Fly Ash ... 172
Figure 111. X-Ray Diffractogram for SGS Conditioned Fly Ash ... 173
Figure 112. Stress-Strain Response of Neola Alluvium at Various Moisture Contents ... 175
Figure 113. Stress-Strain Response of Argyle Paleosol at Various Moisture Contents ... 17 5 Figure 114. Stress-Strain Response of Le Grand Loess at Various Moisture Contents ... 176
Figure 115. Stress-Strain Response of Turin Loess at Various Moisture Contents ... 176
Figure 116. Stress-Strain Response of Cedar Rapids Glacial Till at Various Moisture Contents ... 177
Figure 117. CBR Stress-Penetration Data for Le Grand Loess at Various Moisture Contents ... 177
Figure 118. CBR Stress-Penetration Data for Le Grand Loess and 5% LGS Fly Ash ... 178
Figure 119. CBR Stress-Penetration Data for Le Grand Loess and 10% OGS Fly Ash ... 178
Figure 120. CBR Stress-Penetration Data for Le Grand Loess and 20% PN4 Fly Ash ... 179
Figure D8.l Typical Moisture-Density Relationships of Stabilized Soil ... 198
Figure D8.2 Influence of Compaction Delay on Dry Unit Weight.. ... 198
Figure D8.3 Typical Moisture-Strength Relationships for Soaked and Unsoaked Fly Ash Modified Subgrade. (For soaked samples optimum moisture content is approximately 8.2 % ) ... 199
Figure E7.1Typical28-Day Moisture-Density and Moisture-Strength Relationships for HF A Materials ... 207 Figure F7.1 Typical Moisture-Density and Moisture-Strength Relationships for CFA
LIST OF TABLES
Table 1. Typical Chemical Compositions of Class C Fly Ash and ASTM C 618
Chemical Requirements for Class C Fly Ash ... .23
Table 2. Summary of Soil Properties ... .43
Table 3. Summary of Cation Exchange Capacity (CEC) of Soil Clay Fractions (< 2 microns) ... 46
Table 4. Summary of Optimum Moisture Content and Maximum Dry Density of Soils Used in the Study ... 54
Table 5. Compressive Strength at Optimum Moisture Content and Strength Decrease of Soils Used in the Study ... 56
Table 6. XRF Results for Fly Ashes Used in the Study ... 59
Table 7. XRF Summary of Major Minerals in Fly Ash ... 60
Table 8. Initial and Final Set Times of Fly Ashes Used in the Study ... 61
Table 9. XRF Results for Hydrated and Conditioned Fly Ashes Used in the Study ... 66
Table 10. XRF Results for Hydrated and Conditioned Fly Ashes Used in the Study on an LOI Free Basis ... 67
Table 11. XRD Summary of Major Minerals in Hydrated and Conditioned Fly Ash ... 68
Table 12. Optimum Moisture Content and Maximum Dry Density of Hydrated and Conditioned Fly Ash ... 69
Table 13. Summary of Compaction Delay Data ... 85
Table 14. Volumetric Expansion and Strength Gain of Stabilized Glacial Till. ... 89
Table 15. Summary of Swell Values and CBR of Le Grand Loess and Fly Ash ... 100
Table 16. Summary of Moisture Decrease With Addition of Self-Cementing Fly Ash ... 106
Table 17. Expansion Indices of Soils Stabilized with Self-Cementing Fly Ash ... 112
Table 19. Atterberg Limits and USCS Symbols of Alluvium and 20% Various
Self-Cementing Fly Ashes ... 115 Table 20. Summary of Atterberg Limits of Paleosol and Various Amounts of LGS Fly
Ash ... 117 Table 21. Summary of Shear Strength Parameters of HFA and CFA ... 146 Table 22. Probability Estimates on Chemical Component Influence on Set Time for
Nebraska and Iowa Self-Cementing Fly Ashes ... 155 Table 23. Elemental Chemistry and Set Times of Nebraska Fly Ashes ... 181 Table D 1. Allowable differences for laboratory and field test measurements ... 195 Table E.6. Analytical chemical composition of a typical HFA expressed on an
LOI-free basis ... 205 Table F.6. Analytical chemical composition of a typical CFA expressed on an
INTRODUCTION
A majority of the electricity in the United States is produced at coal fired electric utilities. The burning of coal results in over 117 million tons of coal combustion by-products, most of which is in the form of fly ash (2). Although utilization of fly ash is continuing to grow, less than 32% of coal combustion by-products produced are recycled (2). The remainder of fly ash and other coal combustion by-products are wasted in sluice ponds or landfills, taking up valuable space. The most widely used application of fly ash is as a partial replacement to cement in Portland cement concrete. States such as Iowa allow up to
15% replacement of cement with fly ash, which improves various concrete mix properties and strength gain (33).
Another use of fly ash is in soil stabilization. Soils can be treated with self cementing fly ash to modify engineering properties as well as produce rapid strength gain of unstable soils. The volume of fly ash used for soil stabilization is less than that used for cement replacement in concrete, but as knowledge is gained about the mechanisms of stabilization with self-cementing fly ash volume used in soil stabilization will increase.
Primary benefits of using self cementing fly ash for soil stabilization are: (1)
Environmental Incentives - Material that is used does not have to be wasted; (2) Cost Savings - Fly ash is typically cheaper than cement and lime; and (3) Availability - Fly ash sources are distributed geographically across the state. When volumes of fly ash produced exceed demand in the construction industry, the material is typically hydrated or conditioned and stored on site. The hydrated and conditioned materials can then be reclaimed at later times
and used as soil stabilizers or as select fill under pavement structures. This is beneficial as storage on site also keeps the material out of sluice ponds and landfills.
Iowa soils generally rate as fair to poor as subgrade material. The majority of the soils classify as AASHTO A-4 to A-7-6, meaning they are predominately fine-grained silt and clay soils. These soils exhibit poor strength, high volumetric instability, and freeze/thaw durability problems. Interest has been increasing in the use of stabilization with self
cementing fly ash to improve soil properties and strength, as well as uniformity under pavement sections. There are 12 power plants in the state of Iowa that produce self-cementing fly ash. Half of these power plants have sources of hydrated or conditioned fly ash.
OBJECTIVE
The primary objective of this research study is to evaluate the effects of
self-cementing fly ash addition on the engineering properties of several Iowa soils. Tests include strength tests (unconfined compressive strength and California Bearing Ratio), influence of curing temperature on strength gain, and effects of compaction delay time on density and strength gain. Soil modification involving changes in plasticity, reduction in swelling potential, and increasing wet/dry and freeze/thaw durability are also evaluated. Research results are also provided for engineering properties of hydrated and conditioned fly ash from six power plants in Iowa. The secondary objective of this research was to develop
construction guidelines and specifications for use of self-cementing fly ash to stabilize soils, for use of hydrated or conditioned fly ash to stabilize soils, and for use of hydrated or conditioned fly ash as select fill under pavement structures.
LITERATURE REVIEW
IntroductionA literature review was initiated to examine the construction operations for us of self-cementing fly ash as a soil stabilizer. Procedures for mixing, moisture control, compaction, and curing were investigated. Several methods of quality control testing were also reviewed, which include field density and moisture, stability, and in-service performance-based tests. Case histories describe the use of fly ash as a stabilizer or as a fill material itself. A review of chemical properties and reaction mechanisms of fly ash is also provided. Lastly,
suggested fly ash construction specifications are described.
Construction Operations
Mixing
One of the main concerns when using self-cementing fly ash as a soil stabilizer is achieving thorough and uniform mixing with the material to be stabilized. There are two approaches generally used in construction: (1) Off-site mixing using continuous or batch type mixing and (2) On-site mixing. Off-site mixing operations have the advantage of achieving more uniform mixtures because the amount of materials batched can be controlled to a greater extent than on-site mixing. A disadvantage when using self-cementing fly ash is that it exhibits a relatively rapid set which can lead to a decrease in strength with delayed compaction (1). Most off-site mixing operations have been used in the case of combined
Class F (non self-cementing) fly ash and lime stabilization, as Class F material does not exhibit self-cementing characteristics. Off-site continuous mixing plants have all materials to be mixed brought in on a conveyor system to a mixer where they are combined with water and then loaded directly into a truck, at a constant interval. Batch type operations are similar to a batch plant used for Portland cement concrete. Enough material for a single truck is mixed and then loaded into the truck. The Federal Highway Administration ( 44) has
suggested that for large scale projects a continuous mixing plant is preferred because material can be generated at a higher rate compared to a batch type mixing operation.
As use of self-cementing fly ash has expanded for stabilization practices, the
American Coal Ash Association (ACAA) has stated the preferred mixing method has become on-site mixing (1). This approach does not require establishment of a mixing plant and better takes advantage of the rapid set time of self-cementing fly ash. In this case the fly ash is trucked to the site by belly dump or tanker trucks, and then spread on the subgrade. The mixing operation is then completed using a pulvamixer or disc (46). A typical pulvamixer is shown in Figure 1. Pulvamixers are either single or multiple shaft mixers, or pavement recyclers. One or two passes of the pulvamixer equipment is usually required to obtain a thoroughly mixed material, generally with 100% passing the 1-inch sieve and a minimum of 50% passing the #4 sieve (1). In some cases, as when fly ash is used as a drying agent, discing with a construction disk has been effective in fine grained soils. Incorporation of ash by discing can also be used to bridge unstable subgrades and reduce the effects of water pumping upward due to construction traffic (26).
Figure 1. Typical Pulvamixer Used for On-Site Mixing Application of Water
The process of adding and monitoring the mixing water during the stabilization operations is one of the most important steps in the construction process. When using a mixing plant setup, general suggestions for water are that it should be between 80 and 110 percent of the optimum moisture content based on the moisture-density relationship of the stabilized mixture in order to obtain proper density at time of compaction ( 1 ). As mentioned before, this process is giving way to on-site mixing of self-cementing fly ash, subgrade soils, and water.
Before addition of fly ash, water can be added to the subgrade soils (46), however a disadvantage of this approach is that the subgrade may become unstable, complicating the rest of the construction process (26). Alternatively, water can be added after the fly ash has been incorporated into the soil, but more passes of the mixing equipment are generally required and strength loss can occur due to hydration of the fly ash prior to final compaction (26). The ACAA reports that the most effective method for controlling mixing water has been to add the water directly into the mixing drum of the pulvamixer. This procedure produces the most uniform mixing and the least amount of delay in the construction process (26).
Moisture control also includes the properties of the water to be used on the project. The ACAA (26) suggests the water be potable or meet the requirements of AASHTO T 26 [Method of Test for Quality of Water to be Used in Concrete], which is similar to ASTM C94 [Standard Specification for Ready-Mixed Concrete] (33). This is to assure the water is free of sewage, organic matter, oil, acid, and alkali, which can have detrimental effects on the performance of self-cementing fly ash stabilized material.
Compaction of Fly Ash Stabilized Soil
A variety of compaction equipment can be used to increase the relative compaction of fly ash soil mixtures, and is dependant on soil type. Due to the self-cementing properties of fly ash, it can be an effective stabilizer for granular and fine grained materials. FHW A ( 44) classifies granular materials as AASHTO A-1, A-3, A-2-4, and A-2-5 soils, while fine grained materials are AASHTO A-4, A-5, A-6, A-7, and some A-2-6 and A-2-7 soils. For stabilizing granular materials, steel wheeled, vibratory, or pneumatic rollers are
recommended (1). FHW A (44) suggests initial compaction with a sheepsfoot or padfoot roller and finish rolling with a pneumatic roller for fine-grained materials. Sheepsfoot or padfoot rollers are preferred because good compaction of the lift from the bottom up is achieved while the kneading action helps to further mix the fly ash, soil, and water (26).
Compaction delay time should also be taken into consideration because the stabilized material can lose strength gain capacity as the fly ash hydrates while in an uncompacted state. For Class F fly ash stabilization work a maximum compaction delay time of up to 4 hours has been specified (44, 46). With the increased reactivity of self-cementing fly ash, however, a much shorter compaction delay time is typically specified. For self-cementing fly ash stabilized sections, the ACAA recommends that compaction commence as soon as
possible after final mixing and be completed within two hours so the stabilized material will show less strength and density decrease ( 44, 26). In most cases, the initial compaction begins with a padfoot type roller directly behind the pulvamixer and can be finished within 15 minutes after final mixing (26).
Curing of Completed Fly Ash Stabilized Sections
Curing self-cementing fly ash stabilized sections involves sealing the completed sections before overlying pavement sections are placed to allow the fly ash to hydrate and gain required strength ( 44, 46). Availability of moisture, temperature during curing, and length of cure time all have an effect on strength gain of fly ash stabilized soils (46, 1, 26). Typically, mixtures are cured by sprinkling with water or by coating with a thin layer of emulsion or cutback asphalt (26, 30, 46, 44, 1 ). The Armed Forces and FHW A recommend that the sealer be applied within one day of completion of the section and that multiple coats
may be required (44, 30, 46). Completed sections can also be cured with water for a short time and then sealed with thin coats of asphalt products (32).
According to FHW A ( 44) and Johnson and V andenbossche ( 46), before heavy traffic or pavement sections are placed, the completed sections should be cured for 3 to 7 days. From Armed Forces (30) observation, paving can begin within a day or two after completion of the stabilized section as long as the subgrade can carry paving traffic. In contrast, a cure time of 28 days was specified for one project in eastern Iowa (32). The FHW A (44) also recommends that a protective layer of crushed stone be applied on areas where traffic will be present before paving is completed; however the protective layer delays the release of the volatiles in the asphalt seal coat. The volatiles negatively react with the stabilized base and inhibit strength gain during curing.
According to the ACAA (1, 26) and Johnson and Vandenbossche (46), fly ash
stabilization operations should not proceed when the air temperature is below 40° F. As with most chemical reactions, hydration of fly ash needed for the mixture to gain strength will be slowed at lower temperatures and the required strength will take longer to achieve (26). An example from the Portland Cement Association (33) shows that concrete cured at 25° F has compressive strength of only 28% of the strength attained by samples from the same batch cured at 73° F. Johnson and Vandenbossche (46) further recommend that frozen soils not be used in stabilization processes and that completed sections should be allowed to cure in temperatures above 40° F for at least one week before freezing temperatures occur. Another concern arrives from the fact that highly plastic soils will need more passes with the mixing equipment to pulverize the material to sizes smaller than one inch at temperatures below 50°
F, and more passes of the compaction equipment are recommended to meet required density standards (26).
Quality Control Testing
Field Testing
Many methods have been used to measure the quality of completed sections of self-cementing fly ash stabilized soils. These procedures are used to measure the in-place density, stability and moisture content of the compacted sections.
In-Place Density Determination
Compacted density is one of the main quality control parameters, as the stabilized material cannot gain the required strength if not compacted to a dense state, typically 90% to 95% of standard Proctor maximum density (1, 26, 44, 30). Tests used in practice to measure in-situ density are the sand cone, rubber balloon, nuclear gauge, and drive cylinder (1, 44, 42). The advantage of using the sand cone, rubber balloon, and drive cylinder is that the material removed can be used directly to measure moisture content. Disadvantages to these tests are that they take longer to get the moisture results and performing the tests can be time consuming. The nuclear gauge provides reasonable values for the total compacted density, but the dry density calculated by the gauge is variable at best when compared to
measurements determined by the rubber balloon method (35). This is believed to be a result of erroneous nuclear gauge moisture readings (35).
Moisture Content Detennination
The most difficult, yet one of the most important parameters to measure accurately in the field is the moisture content of the stabilized soil. Without proper moisture, typically
+/-4% of optimum based on maximum density (42), the fly ash stabilized material cannot reach the specified limits of relative compaction, generally 90% to 95% of standard Proctor maximum. The ACAA (26) states that if the relative compaction is not reached, the self-cementing fly ash will not reach the required strength. The most accurate method to
determine the moisture content of the compacted material is the direct heating method. This involves taking samples back to a laboratory and drying the samples in an oven or by directly heating them (1, 44, 42). Compared to direct heating, oven drying takes a longer time, which could cause construction delays.
A "Speedy Moisture Tester", ASTM D4944 [Standard Test Method for Field Determination of Water (Moisture) Content of Soil by the Calcium Carbide Gas Pressure Tester Method] can be used to quickly determine moisture content in the field (42, 1). Seals (42) reported that results for the "Speedy Moisture Tester" have shown to be somewhat unreliable and variable, but his studies in Virginia and West Virginia have produced very acceptable results. Seals (42) also states that the "Speedy Tester" needs to be calibrated with oven or direct heating tests.
The quickest and easiest way to determine moisture content in the field is by the use of a nuclear moisture gauge. A disadvantage of using the nuclear moisture gauge is that moisture measurements are usually subject to errors (26, 42, 1, 35). Mahrt (35) states that the difference between actual and nuclear moisture measurements may stem from the elemental and compound structure of the fly ash and how the neutrons from the gauge interact with
these parameters. Seals (42) recommends not using the nuclear gauge at all; alternatively, the ACAA (26) suggests that the nuclear gauge can be used as long as calibrations and correction factors are determined and figured into the results. These calibrations are mixture specific. The relative quickness of this test method has proven useful when used to measure the moisture content of uncompacted material directly behind the mixing equipment, thereby monitoring the water addition rate in the drum.
Stability of Compacted Material
Quality control testing has also involved measuring the stability of soil stabilized with self-cementing fly ash. Two main test methods have been used in the past, the Clegg hnpact Test, ASTM D5874 [Standard Test Method for Determination of the hnpact Value (IV) of a Soil] and the Dynamic Cone Penetrometer (DCP). The Clegg hnpact value is correlated to California Bearing Ratio (CBR) of in-place materials. The measured values are taken at the surface of the stabilized layer, and this test can be completed in less than one minute (35). Correlations between Clegg hnpact Value (CIV) and CBR of a material exist, but ASTM suggests calibrating CIV and CBR for specific materials to be used on each project. Mahrt (35) determined a correlation between CIV and CBR for hydrated fly ash used as select fill; CBR
=
12.241e0·0572<CIV).The DCP test provides a plot of material stability versus depth. The results of the DCP can be correlated to CBR (50). A common correlation between DCP depth in mm/blow and CBR is CBR
=
(292)/(DCPu2).In-Service Performance Testing
Non Destructive Testing
Iowa State University (ISU) researchers have used two different forms of non destructive tests to determine the in-service characteristics of a project in Wapello County, Iowa.
The first test is the Road Rater Test which measures the structural rating of the subgrade by dynamically loading the pavement surface and measuring the deflection of the pavement (50). The deflections are converted to a structural rating which in tum is used to calculate the Modulus of Sub grade Reaction (k-value) of the sub grade. Road rater testing has been used on numerous projects by the Iowa Department of Transportation (IDOT) (32).
The other test that has been used on the pavement surface is roughness testing, which provides the International Roughness Index (IRI) of the pavement. Testing is conducted by pulling a trailer with a vehicle tire along the pavement. Surface defects are measured by the bounce of the wheel and are reported as IRI values, which are in units of mlkm. This test can also be used to measure subgrade deterioration over the lifetime of the pavement (50).
Destructive Testing
ISU researchers have also been monitoring compressive strength of subgrade materials on two projects in which hydrated fly ash (HFA) and conditioned fly ash (CFA) were stabilized and used as fill materials. In-service testing involved coring the pavement and subgrade in order to recover cores to test in unconfined compression (51). Sample recovery has shown to be a problem. Coring was also used successfully to monitor the strength gain of a cement-fly ash stabilized base in Des Moines County, Iowa (32). This
testing procedure allows visual observation of the subgrade material in addition to the strength testing data.
The DCP test is another destructive method that can be used to monitor subgrade performance after construction. ISU (50) personnel have used to the DCP to measure the stability of the shoulders and select fill underlying the pavement for a project in Wapello County, Iowa. Cores of the pavement are taken in order to expose the subgrade and allow DCP testing to be completed. Testing can be completed relatively quickly.
Construction Method Specifications
Several agencies (44, 1, 26) have developed specifications that provide suggestions for the process of stabilizing soil with fly ash. These specifications cover construction of the stabilized section through quality control testing. Most specifications are broken up into some or all of the following sections that address properties of materials that can be used: ( 1) laboratory testing procedures prior to construction; (2) construction requirements and
operations; (3) quality control and assurance: (4) measurement of materials; and (5) payment for services and materials.
Engineering Properties of Coal Combustion Products
Self-Cementing Fly Ash and Soil Mixtures
Fly ash has been used since around 1950 as a soil stabilizer, but most frequently non self-cementing Class F fly ash was mixed with lime and soil (45). Since the onset of lime-fly ash stabilization, burning of Western United States coal has resulted in production of
self-cementing Class C fly ash. Self-self-cementing fly ash has become the preferred stabilizer in the Midwest and Western parts of the United States due to its availability. Self-cementing fly ash has been used to modify engineering properties such as swell potential, plasticity characteristics, and strength of poor soils (48, 32, 26, 23, 25, 31, 36, 37, 38, 41, 43, 52).
Modification of Plasticity Characteristics and Swell Potential
Self-cementing fly ash has been shown to decrease the plasticity of heavy clay soils, which decreases the swell potential (25). <;o~ka (23) noted that plasticity and swell potential
exhibit greater decrease due to larger addition rates of fly ash, and he observed that ash addition rates greater than 20% are comparable to lime addition rates of 8% for reducing plasticity and ultimately swell potential for a soil consisting of 85% kaolinite and 15% bentonite. Ferguson (25) notes that the decrease in plasticity and swell potential is generally less than that of lime due to the fact that fly ash does not provide as many calcium ions to modify the surface charge of the clay particles. Also, according to Ferguson (25), the application of self-cementing fly ash to expansive soils decreases the swell potential in three ways: (1) Fly ash contains some calcium ions that reduce the surface charge of the clay particles, (2) Fly ash acts as a mechanical stabilizer by replacing some of the volume held by clay particles, and (3) Fly ash cements the soil particles together. The ACAA (26)
recommends that careful laboratory evaluation of different fly ash contents for a given soil is necessary in order to find the optimum ash addition rate. Parsons (38) reported that a
disadvantage to using self-cementing fly ash to modify heavy clay soils (PI~30) is that the
swell potential may still be significant (>2.5%) after incorporation of self-cementing fly ash. Nalbantoglu and Gucbilmez (37) reported on the swell potential and compressibility of Degirmenlik soil (LL=67.8, Pl=45.6) stabilized with Soma fly ash. Sample mixtures were
cured 24 hours before compaction. Swell potential decreased as cure time increased. After curing 7 days, swell values of 4.8 and 3.7% were observed for 15 and 20% fly addition, respectively. Thirty days of curing reduced the swell potential to near 0 for both addition rates. They also noted that compression (Cc) and rebound (Cr) indices decreased as curing time and fly ash content increased. Zia and Fox (52) evaluated the swell potential of low plasticity (PI=O) Indiana loess-fly ash mixtures. Swell was measured during soaking of CBR samples. Ten-percent fly ash addition caused a swell decrease of 55% compared to loess alone. It is interesting to note that swell magnitude for the 10% samples increased with greater amounts of relative compaction. Samples containing 15% fly ash actually exhibited a 255% increase in swell potential compared to the loess soil. Zia and Fox (52) attribute this behavior to formation of ettringite, although the fly ash contained 3.6% S03.
Strength Gain Due to Addition of Self-Cementing Fly Ash
The most widely used application for self-cementing fly is to increase the strength of unsuitable or unstable subgrade materials. The strength of soils stabilized with
self-cementing fly is usually determined from unconfined compression tests and CBR tests (25, 26, 38, 48). Generally clay soils have soaked CBR values from 1.5 to 5% (40), which results in very little support to the pavement structure. Ferguson (25) has shown that addition of 16% self-cementing fly ash increases the soaked CBR values of heavy clay soils into the mid 30s, which is comparable to gravelly sands (40). Zia and Fox (52) also found the CBR of loess was increased five times with 10% fly ash addition, but an ash addition rate of 15% showed lower CBR than the 10% mixtures. They theorized this was also due to the formation of ettringite. Unconfined compressive strengths of soils stabilized with self-cementing fly ash are typically on the order of 100 psi, but can be as high as 500 psi at seven
days, depending on ash content and ash properties (25, 26). White (48) compacted an oxidized glacial till soil and a non-oxidized glacial till soil with 10% self-cementing fly ash at approximately -2%, +/- 0%, and +2% of optimum moisture content based on maximum density and allowed them to cure for 28 days. The data show that at 2% dry of optimum the compressive strength was 140 psi for fly ash-oxidized till and 160 psi for fly
ash-non-oxidized till. When the mixtures were compacted near optimum the strength decreased to 85 psi and 135 psi for the oxidized till and non-oxidized till, respectively. The last set of samples was non-oxidized till and fly ash at 2% wet of optimum. The strength of these samples was approximately 100 psi. These samples were not soaked and show a trend of decreasing strength with increasing moisture content. A report from the ACAA (26) states that the optimum moisture content needed for maximum strength is typically 0% to 8% lower than optimum moisture content for maximum density.
Misra (36) states long-term strength gain is expected for Class C fly ash stabilized soils. Shrinkage cracks may occur over time and may be detrimental to strength
development. His studies involving kaolinite mixed with 0, 2, 4, and 6% bentonite showed most strength gain occurred within 24 hours, and smaller increases were noted up to 7 and 14 days, but after 7 and 14 days, strength gain was retarded and strength actually began to decreases. Zia and Fox (52) also reported the majority of strength development occurs within 7 days of compaction for Indiana loess-fly ash mixtures, and between 14 and 28 days strength of stabilized loess decreased to the strength of the loess alone. Misra (36) theorized that the strength degradation was due to fly ash content and the amount of smectite material in the soil, and he observed that higher ash and smectite contents slowed the strength loss.
Zia and Fox (52) attributed the strength loss to shrinkage cracks that developed in the stabilized samples, which they observed to be more prominent at higher ash contents.
Khoury and Zaman (31) reported on the effect of wet-dry cycles on resilient modulus (Mr), elastic modulus (E), and UCS for Class C fly ash stabilized soft limestone aggregate. Mr was increased 55% for specimens cured 3 days prior to testing and subjected to 30 wet-dry cycles. Twenty-eight cured specimens exhibited an increase in Mr up to 12 cycles, at which time Mr began to decrease. They also observed that E and UCS values increase as the number of wet-dry cycles increase.
Strength gain, as well as compacted density, of self-cementing fly ash and soil is more sensitive to compaction delays than is the soil modification application (25). Ferguson (25) found that compaction delay can cause a pronounced decrease in the compacted unit weight and strength gain. As the ash hydrates, the fly ash soil mixture flocculates and agglomerates. While uncompacted, the mixture tends to become quite aggregated, therefore requiring more compactive effort to break down the cemented particles (26). Ferguson (25) has observed decreases in density of 10 pcf or more resulting from compaction delay. The loss of strength is probably due to the loss of cementitious reaction products used up during hydration and loss of interparticle contact points that result from a lower compacted density (26). Materials compacted immediately after mixing exhibit 6 to 12 times the strength of non-stabilized soils. Mixtures compacted at times exceeding one hour only show a 3 to 5 times increase in strength over non stabilized soils. This strength loss can be as much as 50% reduction in strength from the no compaction delay material, as reported by the ACAA (26). In addition Senol et al. (43) report UCS of low plasticity clay and 20% fly ash decreased after 2-hour compaction delay, and CBR was reduced by 18% for 2-hour compaction delay.
Ferguson (25) and the ACAA (26) suggest that compaction of self-cementing fly ash
stabilized materials be completed within two hours of initial mixing, and they have observed delay times of less than one hour during well planned construction operations. Senol et al. (43) suggests strength can be maximized by stabilization at a mixture specific moisture content and minimizing compaction delays.
Hydrated Fly Ash and Conditioned Fly Ash
Due to the excessive volume of fly ash produced that is not utilized in other
industries, some power plants store this material on site rather than waste it to landfills. This material can be stored one of two ways. One way to store the ash is to spread it in thin lifts, water it, and compact it, thereby producing hydrated fly ash (HFA). When this material is needed it can be reclaimed using pavement reclamation techniques. Another way to store the fly ash is to apply water to the fly ash in a pug mill and then stockpile it on site; this is termed conditioned fly ash (CFA). CFA is considered to be more reactive that HFA because only some of the raw ash has been hydrated, not all as in the case of HF A. CF A materials are typically excavated from the stockpiles using a front end loader.
The advantage of HF A and CF A materials is that they can be used as structural fill, pavement subgrade, and soil stabilizers. The major disadvantage from a stabilization standpoint is that these materials gain strength at a much slower rate than freshly hydrated self-cementing fly ash. When reclaimed, the HFA and CFA act similar to a lightweight aggregate (18). ISU has conducted extensive research on the engineering properties and uses of HFA and CF A. The engineering properties evaluated are moisture-density relationships,
compressive strength, CBR, freeze/thaw durability, hydraulic conductivity, and volumetric stability.
Barnes (18) and later Mahrt (35) reported that the moisture-density relationships of HF A and CF A are typically flat curves without a pronounced peak as shown in Proctor curves for cohesive materials. Four sources of HFA materials and one source of CFA from Iowa show a range of maximum dry unit weight between 74 and 94 pcf, and optimum moisture contents from 22% to 37%.
The majority of strength testing by ISU personnel for these materials has been through the use of CBR tests, both soaked and unsoaked tests, and in some cases the HFA and CFA were activated by CKD, lime, or raw self-cementing fly ash. Testing of CKD as an activator was discontinued because it became commercially unavailable due to
environmental concerns. Mahrt (35) reported molded moisture content does not appear to have an effect on CBR, but the level of compactive effort does. Sub standard compactive effort (-95% of standard Proctor) produces unsoaked and soaked CBR values around 40% while modified compactive effort yields values between 80 and 90%. Barnes (18) conducted research on the influence of an activator on CBR and unconfined compressive strength of HFA and CFA. An activator of 10% raw fly ash was shown to increase CBR values that were as low as 60% up to 110%, and 2.5% lime addition showed values over 200%.
Test results show unconfined compressive strengths for HFA and CFA materials are generally between 50 and 100 psi after 7 days, but shows gradual strength increase at 56 days due to pozzolanic reactions (18). HFA and CFA mixed with 10% raw fly ash have shown compressive strength increases as much as 300% and 2.5% lime addition has produced strengths 700% greater than those of untreated material as reported by Barnes (18).
The addition of an activator (CKD, lime, or raw fly ash), or the material being left untreated has no bearing on the amount of shrink and swell HFA and CFA exhibit. Berg (19) observed no problems related to volumetric instability for air cured or 100% saturated
samples.
HF A and CFA have low freeze/thaw durability when tested in accordance with ASTM C593 [Standard Specification for Fly Ash and Other Pozzolans for Use With Lime], but the addition of lime and raw self-cementing fly ash as activators tends to greatly increase the freeze/thaw durability (19). Berg reports the activators are necessary to facilitate strength gain of the HFA and CFA (19).
Hydraulic conductivity of untreated HFA and CFA is in the range of 1x10⁻³ to 5 x
10-6 emfs, which is comparable to silty clay soils (35). Mahrt (35) has shown that differences
in hydraulic conductivity are dependant on compactive effort, molded moisture content of the material, and the source of the HF A and CFA. More compaction energy and higher molded moisture content tend to decrease hydraulic conductivity.
Hydrated Fly Ash/Conditioned Fly Ash and Soil
White ( 48, 4 7) has experimented on the feasibility of HF A and CF A as soil
stabilizers. Addition of 20% Prairie Creek Generating Station CFA to oxidized glacial till increased crushing strength to 80 psi, while 20% Prairie Creek CFA addition to non-oxidized glacial till increased strength to 70 psi, compared to 60 psi for the non-oxidized till alone. Another study initiated by White (47) has shown that regardless of addition rate of HFA to both lean and fat clays, the strength increase was 2 to 3 times that of the soil, when
be HFA material dependant as Ottumwa HFA showed strength increases of 8 to 12 times when compacted wet of optimum with fat clay, whereas Neal 3 HFA did not produce nearly the strength gain of the Ottumwa HF A ( 4 7). White's ( 4 7) results also showed that lean clay stabilized with HF A fines and prepared wet of optimum moisture content did not appear to have much of strength gain over about 2 times that of the natural soil. A small compaction delay study was completed with non-oxidized glacial till and 20% Prairie Creek CF A; this study showed it was actually beneficial for a long compaction delay (-8 hours) to facilitate maximum strength gain, although the reasons for this are not understood (48).
Expansive clays that have a high plasticity index can show a dramatic decrease in plasticity index and therefore swell potential with the addition of HF A fines due to
mechanical stabilization as well as pozzolanic reactions. The expansive clay used in White's study originally had a very high swell potential (PI=47) which was reduced to medium swelling potential (Pl=22) after HFA addition and a cure time of 28 days (47).
Chemistry of Self-Cementing Fly Ash
Chemical Composition and Reaction Mechanisms of Self-Cementing Fly Ash
Fly ash is the fine residue produced from burning ground or powdered coal (6). Fly ash is collected from the flue gas of coal fired boilers. Most self-cementing fly ashes are Class C as designated by American Society for Testing and Materials (ASTM) C618
[Standard Specification for Coal Fly Ash and Raw or Calcined Natural Pozzolan for Use as a Mineral Admixture in Concrete] and are in fine powder form, usually dark or light tan in color (18). Self-cementing fly ash is produced from the burning of low sulfur, subbituminous
and lignite coals. The greatest percentage of self-cementing fly ash composition is from silica, alumina, ferric oxide, and calcium oxide. Class C fly ash typically has the
composition shown in Table 1 and the chemical requirements of ASTM C618 are also shown in Table 1 (18, 6).
Table 1. Typical Chemical Compositions of Class C Fly Ash and ASTM C 618 Chemical Requirements for Class C Fly Ash
Oxide
Cao
MgO
Ti02 LOI
Self Cementing Fly Ash(% of Total Weight) 20-40 10-30 3-10 10-32 0.5-8 0.5-6 0.5-4 0.5-2 1-8 0-3 ASTMC618 Summation between 50% and 70% Maximum of 5% Maximum of 5%
Fly ash particles are typically glassy spheres that contain some crystalline and carbonaceous matter (18). Fly ash is a pozzolanic material that ASTM (6) defines as materials rich in silica and alumina which in themselves have little or non self-cementing properties, but will, in finely divided form and in the presence of moisture, chemically react with calcium hydroxide at ordinary temperatures to form compounds possessing cementitious properties. Barnes (18) reports that the pozzolinity of fly ash is mainly dependant on the amounts of silica and alumina, presence of moisture and free lime, and fineness of the fly ash. The calcium in self-cementing fly ashes is mostly in the form of crystalline compounds
of aluminates and silicates, which account for hydration characteristics that are more like portland cement rather than lime. Initial formation of cementitious reaction products is due to the hydration of tricalcium aluminate, which the ACAA (26) reports is the cause of problems during long compaction delay times. Strength gain at periods over 28 days is mostly attributed to the pozzolanic reactions between calcium oxide and the aluminous and siliceous materials in the fly ash.
Negative Reactions Resulting from Pozzolans and Sulfur
Due to environmental concerns, some power plants have converted over to fluidized bed combustion (FBC) or flue gas desulferization (FGD) to help remove S02 from the boiler
exhaust streams. The effectiveness of these two procedures can be seen in the fact that the resulting fly ashes have more than 15% sulfate content (26). The ACAA (26) reports that FBC ashes can contain up to 35% S02 while FGD ashes contain S02 contents greater than
35%.
Problems are encountered when growth of crystals composed of sulfate compounds occur after incorporation of these high sulfate ashes into the material to be stabilized. As the calcium sulfate reactions proceed in the stabilized material, gypsum, ettringite, and
thaumasite form and continue to form which produce long term expansion. Ettringite and thaumasite are formed by reactions of calcium, sulfates, alumina, silica, and water. Ettringite forms initially and these crystals occupy a volume over 200% of the volume the constituents once did. The secondary formation of expansive crystals is the conversion of thaumasite from ettringite, which takes a longer time and results in an additional 200% volume
isomorphous substitution of the alumina in ettringite for silica. The amount of clay present and the pH of the soil are major factors involved in the formation of expansive materials. Addition of these high sulfur ashes typically raises the pH of the soil to around 12. The ACAA (26) stated that as the pH of a soil reaches about 10.5, the alumina and silica in clay particles becomes soluble, which provides a source of extra ions needed to form the
expansive crystals.
The suitability of high sulfur, about 30%, FBC fly ash was evaluated in a limited study at ISU. White (48) observed that 56 days after samples were molded, delineation and expansion were observed, and at 90 days the FBC stabilized specimens had shown a
volumetric expansion of 35% compared to original molded volume. It has been noted that fly ashes meeting the requirements of ASTM C 618 for sulfur content (<5%) show no evidence of potential expansion problems, while fly ashes with sulfur contents of 5% to 10% may be beneficial to construction, as the sulfates tend to retard the initial set of the ash due to tricalcium aluminate (26). The ACAA provides the following guidelines for stabilization with high sulfur ashes (26):
• Ashes with sulfur content in the range of 5% to 10% should be considered expansive until laboratory testing proves otherwise.
• High sulfur ashes with sulfur contents greater than 10% should not be used for stabilization operations.
• In addition to sulfur content of the fly ash, soluble sulfates in both the soil and groundwater used for the project must be considered. These can also influence the swell potential of the stabilized mixture.
• Saturated conditions make the ions needed for crystal growth more mobile, whereas non saturated conditions tend to slow crystal growth.
• The potential for problems related to swell increases with increasing clay and colloids content.
Reports are available concerning projects that had catastrophic results when calcium based stabilizers, usually lime or portland cement, were used: (1) To stabilize sulfate bearing clay soils, (2) In areas where there is a supply of fresh groundwater that continues to provide available sulfates, or (3) When the mixing water for the project contained high amounts of soluble sulfates (29, 34, 39). Hunter (29) reported on problems that arose in Las Vegas when sulfate bearing clay soils were stabilized with lime. The sulfate content of the clay was high enough that lime should not have been used to begin with, but the sulfate content of the soil alone was not large enough to account for the all of the measured expansion. The extra sulfates needed for the expansion were provided through a granular backfilled utility trench that ran along the length of the project, which provided excess dissolved sulfates to the stabilized areas through groundwater.
The Texas Department of Transportation has investigated sulfate bearing soils and calcium induced heave. The soils in Texas have a high concentration of gypsum (CaS04 ·
2H20), which is a precursor to the formation of ettringite and thaumasite. One project
involved ettringite formation as rain water infiltrated the subgrade that was stabilized with lime and Type II portland cement. Areas on the same project that were not stabilized did not exhibit swelling related problems (34 ).
The other major project dealt with a double application of lime. Heaving of the subgrade stabilized with the first lime treatment was observed within 6 months of project
completion. Ko ta et al. (34) hypothesized that gypsum laden water was entering the subgrade, therefore causing the formation of ettringite. After laboratory testing, it was recommended that the pavement be removed and an additional treatment of lime be applied. As with the first treatment, heave was again observed within 6 months, destroying the
pavement structure. Kota et al.(34) provides some ideas to prevent the destruction caused by sulfates and calcium based stabilizers:
• Double application of lime.
• Low calcium stabilizers such as cement and fly ash. • Non calcium stabilizers
• Geotextile or Geogrid soil reinforcement. • Stabilizing the top with non sulfate select fill. • Pretreatment with barium compounds.
• Asphalt stabilization of the sulfate bearing soils. • Compacting to lower densities.
Rollings et al.(39) examined a project in Georgia that involved a cement stabilized sand base course material that was mixed off-site at the sand borrow pit. As in the Texas examples, sulfate induced heave was evident within 6 months after construction. A preliminary investigation provided no definite answers as to why the base course heaved. Sulfur was not present in the cement used or in the sand. Closer inspection showed the mixing water used at the off-site mixing plant contained over 10% sulfur, and the water was also a major contributor of calcium. When the cement was added, the pH increased to about 12 and the alumina and silica in the soil became soluble, leading to the formation of
Case Histories Involving Self-Cementing Fly Ash Stabilization
Self-Cementing Fly Ash Stabilization for an Industrial Road, Missouri
The project, completed in 1973, was located in Kansas City, Missouri and involved an industrial road underlain by clay soils with a liquid limit of 65, plasticity index of 43, and low CBR value of 3.5. Initial design of the pavement was 12 inches of full depth asphalt. However, it was desired to reduce the pavement thickness by improving the subgrade.
Laboratory testing using a fly ash content of 15% from Hawthorne Power Station showed decreases in liquid limit and plasticity index to 45 and 18, respectively. The 28 day unconfined compressive strength of the stabilized clay soil was 7 times that of the native soil. Mixing took place on grade, in two 4.5-inch layers. Field CBR values increased to 9% unsoaked and 12.5% soaked. The increase in CBR allowed pavement thickness to be reduced to 9 inches, and as of 1975 the pavement was holding up to light traffic loads (27).
Low Cost Fly Ash Stabilized Sand, Des Moines County, Iowa
The main objective of this Iowa Department of Transportation project was to develop a low cost fly ash stabilized roadway using locally available unprocessed sand. The project was county road H-40 in Des Moines County. The roadway is located adjacent to the Mississippi River Levee and traffic was estimated at 27,000 ESALs. The mixture for the project consisted of 5.1 % Type I cement, 13.7% Ottumwa Class C fly ash (23% CaO), sand, and water. The grade was prepared in July 1984. Construction of the base course began on August 1, 1984 and was completed on August 4, 1984.
The mixture was mixed off-site in a central plant mixer, then transported to the site in dump trucks and placed in front of a subgrade trimmer. Compaction of the mix was difficult at times due to the material shoving under the roller. Average density was 97 .6% of standard Proctor and strength testing was conducted by coring the base at 14, 28, 91, and 313 days. Strengths were greater than typical lime-fly ash mixtures. The main objective, low cost, was not met. After the road had been through two years of heavy tractor-trailer traffic, it was noted that an overlay would be necessary (32).
Recycled Pavement, Shawnee County, Kansas
This 1.5 mile section of 93rd Street is considered a rural road but carries a high volume of truck traffic. The existing thickness of the road material varied from 1 to 6 inches for the asphalt surface and 1 to 8 inches for the granular base overly a clay subgrade. The mix design was for 18% class C fly ash to be added to the pulverized pavement and base materials at a moisture content of 10%.
Starting in June 1987, the pavement and base was pulverized to a 6 inch depth and lightly compacted. The fly ash was spread on the surface and mixed in with a Bomag MPH
100; water was added through nozzles in the mixing drum. Initial mixing was completed with a vibratory padfoot roller and final compaction was completed with a smooth drum or pneumatic rubber tired roller. The stabilized section was kept moist for 5 days before a layer of cold mix asphalt was placed. Two months after the asphalt was placed a chip seal surface was applied. The road was in excellent shape after 4 years of service (27).
Construction of the Heartland Park Race Track, Topeka, Kansas
Soils on the site of the proposed race track were classified as lean clay, weathered shale, and fat clay. Stabilization of the on-site soils was needed to reduce volume change potential, increase shear strength, and reduce pavement thickness. The self-cementing fly ash was from Kansas Power and Light Jeffrey Energy Center and had calcium oxide content between 28% and 33%. Fly ash contents of 14%, 16%, and 18% were evaluated, and
moisture-density and moisture-strength testing was completed at compaction delay times of 0 and 2 hours. A fly ash content of 16% was chosen for the project, with a moisture range of 0% to 4% above optimum for maximum compressive strength. The completed stabilized section was 12 inches thick. Construction of the subgrade started in October 1988 and finished in December of that year. The soil temperature was closely monitored during construction. Field monitoring included nuclear density testing and sample molding of the mixture in the field to monitor strength gain of the production mix. The areas that were stabilized when the temperature was below 4.4 °C required more passes of the compaction equipment but these areas have remained stable. As of 1992, the race track pavement was in excellent condition and performing at the expected level (25).
Northwest Highway Fly Ash Stabilization, Oklahoma
The material on the site was sandy clay that required stabilization. The design engineers specified an ash addition rate of 15%, and this was to be initially mixed to a depth of 8 inches with the subbase. After preliminary mixing, water was sprinkled on the mixture and immediately following was a second pass of the mixing equipment. The compaction window on the project was 4 to 6 hours. Compaction was completed the next day, and this
compacted stabilized layer was trimmed to meet project requirements. The stabilized subgrade was finished of with a 10-inch hot mix asphalt layer (22).
Power Plant Access Road, Marshalltown, Iowa
Construction began in June 1994 on a 1700-foot long by 22-foot wide access road to the Sutherland Generating Station in Marshalltown, Iowa. The road was constructed on a 10-inch thick base of CF A from the Prairie Creek Generation Station in Cedar Rapids, Iowa. Since the base material had been previously conditioned, the project called for an activator to be used to promote the pozzolanic reactions. Cement kiln dust (CKD) and atmospheric fluidized bed combustion (AFBC) residue were both used as activators on the project. The activators were mixed at 15% by dry weight of CF A. The CKD was used on 1000 feet of the access road. For this portion of the project, the CFA was placed on-site and then the CKD was spread over it. Next a reclaimer mixed the CFA, CKD, and water together to a loose depth of 12 inches. This mixing process was repeated until the proper moisture content for compaction was reached, at which time the mixture was compacted using a padfoot roller first and then a smooth steel drum roller for final compaction. The compacted section was kept in a moist condition until paving. The 700-foot long AFBC section was completed in much the same manner except that the CF A was prewetted prior to application of the AFBC, and water was again applied after the first pass of the reclaimer. Compaction of the AFBC was the same as the CKD section and the compacted AFBC section was also kept in a moist condition. Final surfacing was a 2-inch chip seal. Beginning in November 1994, ISU personnel have extracted cores of the base material annually through July 2002. The AFBC became unrecoverable several years ago and recently the CKD cores have shown horizontal
delamination near the top and vertical cracks that propogate down through the samples.