Technological University Dublin
Technological University Dublin
ARROW@TU Dublin
ARROW@TU Dublin
Conference papers
School of Computing
2020-06-30
Moving Targets: Addressing Concept Drift in Supervised Models
Moving Targets: Addressing Concept Drift in Supervised Models
for Hacker Communication Detection
for Hacker Communication Detection
Susan McKeever
Brian Keegan
andrei quieroz
Follow this and additional works at: https://arrow.tudublin.ie/scschcomcon Part of the Robotics Commons
This Conference Paper is brought to you for free and open access by the School of Computing at ARROW@TU Dublin. It has been accepted for inclusion in Conference papers by an authorized administrator of ARROW@TU Dublin. For more information, please contact
[email protected], [email protected], [email protected].
This work is licensed under a Creative Commons Attribution-Noncommercial-Share Alike 3.0 License
Moving Targets: Addressing Concept Drift in
Supervised Models for Hacker Communication
Detection
Andrei Lima Queiroz
Information Technology Secretariat - STI University of Bras´ılia - UnB
Bras´ılia, Brazil [email protected]
Brian Keegan
Applied Intelligence Research Centre Technological University (TU) Dublin
Dublin, Ireland [email protected]
Susan Mckeever
Applied Intelligence Research Centre Technological University (TU) Dublin
Dublin, Ireland [email protected]
Abstract—In this paper, we are investigating the presence of concept drift in machine learning models for detection of hacker communications posted in social media and hacker forums. The supervised models in this experiment are analysed in terms of performance over time by different sources of data (Surface web and Deep web). Additionally, to simulate real-world situations, these models are evaluated using time-stamped messages from our datasets, posted over time on social media platforms. We have found that models applied to hacker forums (deep web) presents an accuracy deterioration in less than a 1-year period, whereas models applied to Twitter (surface web) have not shown a decrease in accuracy for the same period of time. The problem is alleviated by retraining the model with new instances (and applying weights) in order to reduce the effects of concept drift. While our results indicated that performance degradation due to concept drift is avoided by 50% relabelling, which is challenging in real-world scenarios, our work paves the way to more targeted concept drift solutions to reduce the re-training tasks.
Index Terms—Cyber Security, Machine Learning, Concept Drift, Hacker Communication, Software Vulnerabilities
I. INTRODUCTION
In recent times, machine learning algorithms have been popularised due to their capacity for solving real-world prob-lems through the discovery of useful patterns in data. These algorithms have revolutionised tasks such as image recognition (e.g., handwriting and face classification) and natural language understanding (e.g., sentiment analysis, Named-entity recog-nition). The enthusiasm surrounding data-driven learning ap-proaches has expanded to a wide range of domains, including cyber security [1].
In general, machine learning models applied to cyber secu-rity tasks are designed with the assumption of a static world view. Such an assumption does not accommodate dynamic changes which present themselves over a period of time [2]. As a result, the accuracy of these models can be affected by changes in the problem concept, rendering the models less effective or useless as time goes on. This phenomenon is known as Concept drift and it is commonly seen in natural language tasks where the language usage and meaning changes constantly.
In cyber security initiatives that use hacker communications, movement in the concept is observed when new forms of malicious hacking emerge and are shared in social media channels. As seen in [3], new cyber related vocabulary (i.e. jargon) is created by hackers to communicate well-known security issues in computer systems. These forms of expression amongst peers are not static and are susceptible to changes. As seen in [4], between 2013 to 2017, there was an increase of new types vulnerabilities in software that were not previously categorised. This implies that hackers are communicating this type information by using different words and grammatical structures for expressing new concepts. It is in this dynamic context that cyber defenders are trying to operate to protect computer systems from threats.
For this reason, the aim of this paper is to investigate the extent and effect of concept drift on the accuracy of machine leaning (ML) models used to detect software vulnerabilities mentioned in social media posts. We base our experiment in the following research questions:
• Does the accuracy of our machine learning models, created to detect software vulnerabilities in social media posts degrade over time, indicating concept drift?
• Can we alleviate this problem using a typical concept drift solution method?
With this in mind, we carry out our work using 3 datasets, consisting of user posts gathered from social media and hacker forums. These datasets are gathered over an 8 year period, allowing a sufficiently long temporal window to observe and alleviate concept drift, if it exists. In order to visualise the concept drift, the messages which the models are trained and tested on are organised to consider the date and time where they were posted on social media platforms. We believe that this study can also be used as a base for detection of hacker communications regarding security problems in a new paradigms, such as Smart Cities and Internet of Things (IoT), which are constantly being shared in underground communities [5]
review a selection of related works on software vulnerability communication detection and concept drift. In Section 3 we describe our approach, including a description of the datasets used and methodology. We also present our approach to quantify the effect of the concept drift in the models. In Section 4, we provide an analyses of the performance of the model in 1-year period for Twitter(surface web) and hacker forum (deep web) datasets. In section 5, we measure the slope of the line to identify the best approach to contain the deterioration of performance in these models. Finally, in Section 6, we summarise the contribution of this work and present the future work.
II. RELATED WORK
Recent work in the domain of hacker communication de-tection has shown little or no concern with the evolving nature (concept drift) of communications amongst peers. For instance, in [6], the authors provided an experiment using tra-ditional classification algorithms to detect cyber discussions in social media channels. Also, in [7], the authors have provided a comparison of traditional Support Vector Machine (SVM) algorithm and Convolutional Neural Network (CNN) applied to the detection of hacker communications. Despite showing promising results, with high levels of classification accuracy, neither work considers the importance of the applicability and durability of their models over time under effects of concept drift.
To the best of our knowledge, there is no other work measuring concept drift in communication specific to software vulnerabilities in hacker forums and social media. However, our research has identified supporting work applied to the security domain, where the authors identified that the perfor-mance of machine learning models are affected by the rapidly evolving (drift) of malware software. As a result, further unseen malware is not identified by models trained in long time past data [8].
Other related studies on concept drift use specific algorithms for triggering the retraining of models when changes in the underlying distribution of the incoming data is detected. As seen in [9], the authors proposed an algorithm that observe the change in distribution of the data using dynamic sliding window. Furthermore, an algorithm proposed in [10] detects the drift in a on-line manner without storing datapoints in memory, which provides a more efficient algorithm in terms of memory resource. These algorithms applied to concept drift are of interest, as they indicate future options for our work.
III. APPROACH A. Dataset
The 3 datasets used in this work have been used previously in [11] [12] and can be found in http://tiny.cc/8ws67y. They contain posts from on-line social media platforms such as fo-rums and micro-blogs, commonly used by hackers for sharing and learning information about hacking and computer security in general. The subject of these messages range from technical to personal opinions and are related to a broad range of
security topics, e.g., software security, data breach, copyright infringement, stolen credit card. Among these messages, we visually identify that few are related to malicious activities in software products or have mentioned security problems (flaws, vulnerabilities).
A summary description of each original dataset is described below:
D1 - CrackingArena Forum - This is a collection from one of the most used hacker forums existing in 2018 with 11,977 active users. It contains communications related to security issues in computing, which makes the data suitable for cyber security research on the interaction patterns among cyber criminals. The variety of covered topics in the forum ranges from social engineering, cracking/exploit tools to tutorials, which makes this forum a viable source for pinpointing the characteristics of newly emerged hacker assets.
D2 - Security Experts - The data contains posts from 12 security-expert users on Twitter, where six of them are part of the well-known-security experts having an average number of followers of 18,800, and the other six are part of the lesser-known security experts, having an average number of followers of 1,100. Their tweets are mostly related to security aspects of technology, including software vulnerabilities and hacking.
D4 - Garage4Hackers Forum - This is a medium-sized forum in terms of number of content and users. This forum contains material related to exploitation, botnets and reverse engineering, it also provides information regarding specialised hacking tools.
The dataset D2 lies on the Surface Web domain as it is indexed by search-engines (e.g., google search) and can be freely accessed by every person with internet access. Whereas D1 and D4 lie on the domain of Deep web, which has its content accessed only by users with permission, credentials or invitation.
B. Labelling Process
The messages in these datasets were labelled consistently, using the following method. Each message was labelled 3 times, by three different computer science experts according to the following rules:
• Yes, for posts that appear as malicious communication regarding software vulnerabilities and exploitation.
• No, for posts thatnotappear as malicious communication regarding software vulnerabilities, which also include data breach, copyrighted software cracked, stolen ac-counts (e.g., Netflix, Amazon) and credit card acac-counts.
• Undecided, for messages where the labeller does not have enough information or confidence to mark as Yes or No. The undecided choice is to cater for the ambiguity of certain posts, which is a non-trivial task (even for experts) to determine whether they are related to software security communication. The final label across the set of three labels was assigned according to the majority of votes. e.g., yes = 2, no = 1, undecided = 0, the final label (FL) = Yes. The posts with total disagreement between labellers, e.g., no = 1, yes =
1, undecided = 1, were excluded from the dataset, which are less than 5% of the messages for all dataset.
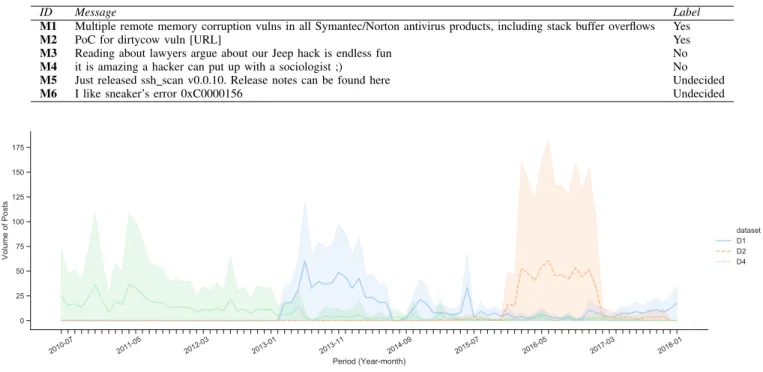
In Table I, we have examples of messages and their re-spective labels. The message M1, marked as Yes, is related to a type of vulnerability (Stack Buffer Overflow) affecting a software product. Message M2, also marked as Yes, is related to a release of a Proof Of concept (PoC) of a vulnerability calleddirtycow. The messages M3 and M4 are related to per-sonal opinion and have no direct relation to real vulnerabilities in software. It is worth mentioning that despite M3 and M4 having hack and hacker keywords, they are not considered malicious.
C. Transforming into a Binary Classification Task
From a security standpoint, we believe it is prudent to capture the Undecided messages as a potential malicious problem. For this reason, we have transformed this task into binary classification. We have placed the Undecided and Yes
messages into the positive class, whereas No messages are the negative class. Further details on the labelling task and description of social media platform used can be found in [12] [11].
It can be observed that all datasets have an imbalanced number of instances of positive and negative classes, with the minority proportion of these messages representing the posi-tive, thus, malicious communication. In Table II, we present the description of each dataset with respect to the number of posts, the distribution of positive and negative instances and the average number of words.
In Fig 1, we present the volume of messages in each dataset over time. On the x-axis we have the year-month and on the y-axis the volume of posts collected during that period. The collected messages are spread in a period between 2010-07 and 2018-01 with each dataset covering a subset of this range of time. The dataset D1 contains messages between 2013-01 and 2018-01 (5 year), D2, the shortest dataset in terms of temporal range, contains messages between 2015-11 and 2017-03 (≈1 year), D4, the longest, contains data between 2010-07 and 2017-13 (≈7 year), To compare these experiments fairly we choose to use a 1-year peak for each, as the shortest dataset has about 1 year range.
D. Experimental Methodology
This experiment follows a stream-based methodology over a period of time. The following sections explains how the Predictive Sequential (Prequential) evaluation was performed over a Monthly Time Window (MTW) period. We also de-scribe how we have trained the start model which proved to be the base for our experimental procedure.
1) Prequential Evaluation: Considering the changing na-ture of hacker language with the emergence of new forms of exploiting software vulnerabilities, we hypothesise that models trained in past instances will not present the same performance in new, or future, instances due the concept drift. For this reason, we propose to simulate the use of these models in real-life situations, where the model is trained and evaluated with
consideration of the time when the messages occur in social media platform. The data used to feed the model is therefore organised by date of publication. For this streaming task, we are using Sliding Window prequential evaluation similar to [13], which in our case the windows are fixed by months of the year.
2) Monthly Time Window: In order to evaluate the perfor-mance of the model over a 1-year time period, we selected the use of a monthly time window to train and test the model. These time windows are organised for every 2 month period (bimester), although, for the training phase of the experiment, we have used 2 bimesters (4 months) due to the need of a minimum number of positive instances for applying oversam-pling technique as seen in [12]. This technique provides a performance enhancement of models built using imbalanced data. For the remainder of this work, the notation shown on the graphs are as follows:w0, is the start model, which is trained
and cross-validated in 2 bimesters messages, whereas the time windoww1, w2, w3, w4 are the results of the test phase with
the incoming messages with messages of 1 bimester each.
3) Training the Start Model: All experiments presented in this paper start with this model. The resulting performance is given by a 10-fold-cross validation and present in the graphs of this work atw0window. Considering that this model is trained
with approximately 10% of instances from positive class (before resampling), we have applied the random oversampling technique to our training data as done in [12] to improve the classification performance of the model. The metric used to evaluate the model is the Average Class Accuracy Metric. This metric is the sum of the recall of the positive and negative classes divided by the number of classes as seen in (2) and recall being (1). This measure is commonly used to evaluate models trained on imbalanced datasets in order to capture class level accuracies. The performance achieved with the start model can be seen in Table III.
Recall= T rueP ositive
T rueP ositive+F alseN egative (1)
Avg.ClassAcc= Recall(pos.Class) +Recall(neg.Class)
N o.Classes
(2) IV. EXPERIMENT- CONCEPT DRIFT IN1-YEAR PERIOD
In this experiment, we have selected D1, D2 and D4 as these datasets allow us to reach a minimum proportion of positive instances (roughly 10%) for training the model within a 4-month period. Thus, we can apply enhancement techniques (oversampling) to increase the performance of the model [12]. In addition, the source of these datasets differs on origin, as D1 and D4 are collected from hacker forums (deep web) and D2 is from Twitter (surface web).
For testing, we have used the remaining 8 months of messages. The evaluation was performed considering the time when the messages occur in social media platform. This was done to simulate real-life use of this model. The importance
TABLE I: LABELLING TASK EXAMPLES
ID Message Label
M1 Multiple remote memory corruption vulns in all Symantec/Norton antivirus products, including stack buffer overflows Yes
M2 PoC for dirtycow vuln [URL] Yes
M3 Reading about lawyers argue about our Jeep hack is endless fun No
M4 it is amazing a hacker can put up with a sociologist ;) No
M5 Just released ssh scan v0.0.10. Release notes can be found here Undecided
M6 I like sneaker’s error 0xC0000156 Undecided
Fig. 1: Timeline and volume of messages of the datasets TABLE II: DESCRIPTION DATASET
ID Source Type No. of inst.
Distrib. (pos/neg)
Avg. words
D1 Hacker Forum Deep web 1,682 10/90% 50
D2 Twitter Surface web 1,927 15/85% 13
D4 Hacker Forum Deep web 1,966 13/87% 78
TABLE III: AVG. CLASS ACCURACY OF THE START MODEL (4 FIRST MONTHS)
SVM+BOW D1 0.67 D2 0.77 D4 0.68
of evaluating accordingly is to investigate how long the model would retain its performance after its creation - in other words, to measure the robustness of the model against the changes (drift) in the concept. Table IV presents the number of instances used in the training and test phase as well as the distribution of the classes in each month. The algorithm and feature representation used for this experiment are Support Vector Machine (SVM) with linear kernel and Bag-of-words (BOW) respectively. The SVM parameters are not tunned, in-stead, we used the library default values (Sci-kit 0.20.2v). We choose to use the defaults to fairly compare the performance of the models throughout all 3 datasets.
A. Static Model Evaluation (Baseline)
The purpose of this baseline experiment is to investigate the performance of static models over a period of 1-year. For
this specific experiment, we are not performing any retraining (updating) of the model. We have used messages from a 4-month period to train the model. In Table III, we see results of the training phase of this experiment. It is seen that, for hacker forums (D1 and D4), the model has achieved 67% and 68% of average class accuracy respectively, while Twitter source (D2) has achieved 77%.
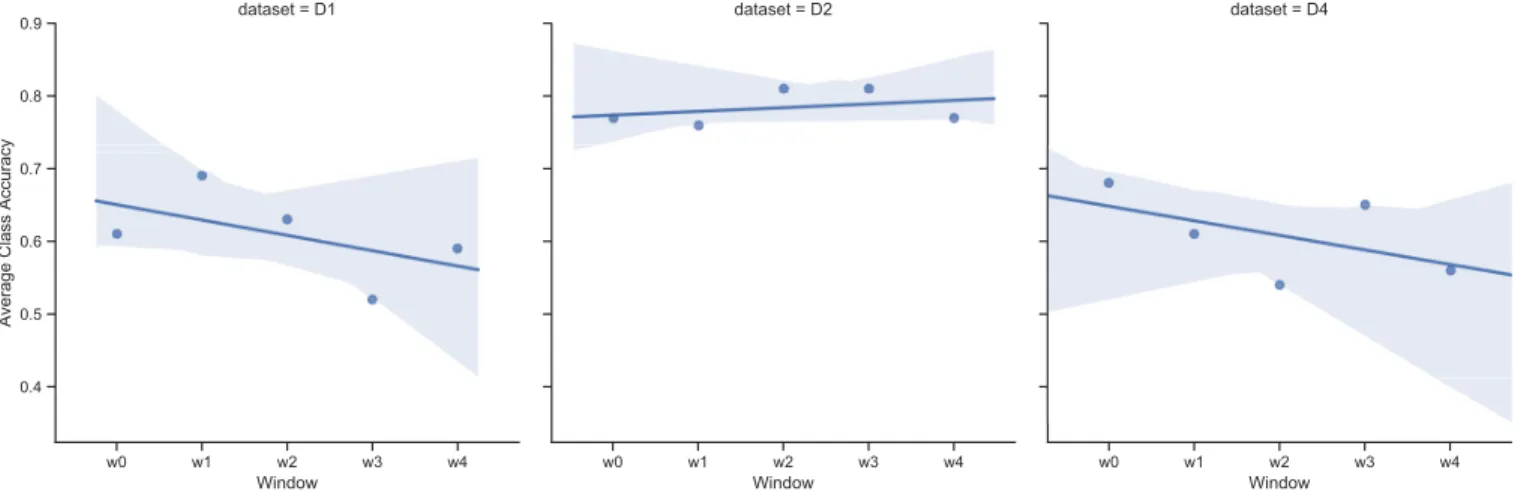
Moreover, Fig 2 presents the performance of the baseline model (w0) tested against messages of the remaining 8 months of the year (w1, w2, w3, w4). We have constructed a regres-sion line that best fits the data points over time. This line also represents the rise to run ratio of the model for each dataset. The x-axis is the time window and the y-axis is the performance of the model in average class accuracy for that period of time. w0 represents the results of the static model trained in 4 months and evaluated by 10-fold cross validation.
w1, w2, w3, w4 represent the results of the model tested in instances of a 2-month period.
Our baseline results show an apparent drift occurring in both hacker forums datasets (D1 and D4), whereas there is no apparent deterioration of the performance of model applied to D2 (Expert post on Twitter). We imply the hacker forums are environments that provide a more variate content than Twitter with regards to novelty on hacker techniques and tools, thus the drift on the former occurs earlier than in the latter.
Inspecting the absolute numbers, D1 starts at 61% avg. class acc. and ends in w4 with 59% of avg. class acc., whereas D4 has shown a bigger drift, starting at 68% and ending 56%. Only D2 (twitter) has shown no sign of drift, with start and ending performance 77% avg. class acc, while the performance in w1, w2, w3, w4 does not decrease to less than the static
TABLE IV: DISTRIBUTION OF INSTANCES IN EACH PHASE
D1 D2 D4
Phase Periods (months) Window No. Msgs Distrib. %(pos/neg) No. Msgs Distrib. %(pos/neg) No. Msgs Distrib. %(pos/neg) Train1 1st to 4th w0 342 (33/67) 826 (39/61) 314 (44/56)
Test 5th and 6th w1 144 (10/90) 317 (11/89) 179 (16/84) Test 7th and 8th w2 149 (10/90) 263 (13/87) 89 (20/80) Test 9th and 10th w3 185 (12/88) 291 (23/77) 106 (7/93) Test 11th and 12th w4 150 (9/91) 257 (19/81) 207 (8/92) 1Positive class instances in training phase are oversampled by 300% according to [12]
model, in w0, during the entire year.
B. Dynamic Model Evaluation
In this section, instead of using a static unchanging model, we present the results of a model retrained (updated) with incoming instances. We have also experimented with the introduction of weights on these new instances to increase the classification performance.
1) Updating Model with Past Instances: Differing from the static experiment, in this dynamic model we have performed a periodic update such that the model is tested in sample Pn
and outputs the average accuracy Wn, wheren∈ {1,2,3,4}
representing the periods of two months instances. Furthermore, the parameters of the model are updated considering the sample Pn. It is worth noting that there is no forgetting
mechanism in this update process, which means that the old parameters still form part of the model. Fig 3 (b) shows a simplified graph of this procedure.
In order to investigate the minimum number of instances needed to update the model, and, thus, avoiding the decrease of performance over time, we have performed this experiment using different proportions of relabelled instances. The pro-portion are: 25%, 50%, 75% and 100% can be seen in Fig 4. By the results, we see that, with all these proportions, the model has performed better than the baseline static model (thick line). It is also observed that, updating the model with 100% of the incoming instances gives, as expected, the best results. However, we can also reduce the update to 50% of the incoming instances and still have comparable results to 100%. Reducing the proportion of incoming instances provides a significant reduction on the time and resource (people) required to perform the labelling task and the update of the model.
2) Weighting on Newest Samples: In this experiment, we have updated the model using only 50% of the incoming data. On top of that, we have given more importance to the new incoming data through weighting.
Fig 5 shows how the model has performed after applying weights on top of the 50% random instances. The thicker (blue) line represents the model retrained with 50% random instances withoutweight, whereas the thin line represent the model retrained with the same 50% random instances, with
different proportion of weights on them (2:1, 3:1, 5:1 and 10:1).
Visually, we see that the models with weighting schemes have achieved in w4 the best performance compared to the baseline (thicker line). Although, in few points of D1 and D4 it was observed a decreasing in performance for some weights.
V. DEGREE OF DRIFT OF DYNAMIC MODELS
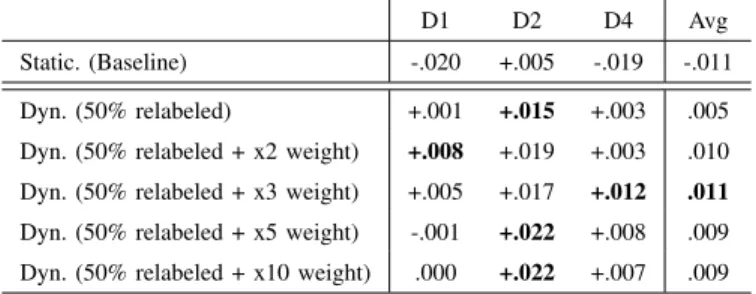
According to [14] and [15], there are four common drift patterns: Sudden,Incremental, GradualandReoccurring. We have noticed that the drift in D1 and D4 occurs gradually, where D2 the models stays practically flat. In order to measure this drift, we have calculated the slope of the line in dataset D1, D2 and D4 throughout a 1-year period. Negative values mean that the performance of the model has a tendency to decrease, whereas positive values is the opposite. In Table V, we show a comparison between the static (baseline) and dynamic model after applying different values of weight on 50% random samples.
It is observed that by retraining the model, the performance over time is improved over the baseline static model. With a minimum of 50% of retraining of the incoming messages we achieve such improvement. This result has shown that we can use only 50% of the incoming instances to retrain the model and still improves over the static model. Thus, reducing workload of labellers in 50%.
In addition, by weighting the newest incoming samples, we have achieved further improvements. In Table V, if we consider the average results, the best configuration for avoiding performance deterioration over time is by retraining 50% of new incoming instances and adding weights on them with a 3:1 proportion.
TABLE V: SLOPE OF THE LINE FOR STATIC AND DYNAMIC MODELS
D1 D2 D4 Avg
Static. (Baseline) -.020 +.005 -.019 -.011 Dyn. (50% relabeled) +.001 +.015 +.003 .005 Dyn. (50% relabeled + x2 weight) +.008 +.019 +.003 .010 Dyn. (50% relabeled + x3 weight) +.005 +.017 +.012 .011
Dyn. (50% relabeled + x5 weight) -.001 +.022 +.008 .009 Dyn. (50% relabeled + x10 weight) .000 +.022 +.007 .009
Fig. 2: Static Model (baseline) - Average Class Accuracy results of the model trained in 4 months period (w0) and tested in every two months (w1...w4) in 1-year period
Static Model
Result Wn
Pn
Test sample
(a) Static Model
Dynamic Model Result Test sample Update Wn Pn Pn (b) Dynamic Model
Fig. 3: Experimental procedure, where P = sample , W = result in Avg acc. and n = period
VI. CONCLUSION ANDFUTUREWORK
In this paper, we have investigated how concept drift affects the accuracy of machine learning models applied to detection of software vulnerability communication in social media and hacker forums. As the nature of computer security and language are dynamic, we confirm our expectation that the performance of these models decreases with the rapidly changing of concept within a 1-year period. However, models trained and applied to Twitter messages do not show apparent drift. We believe that, compared to other hacker forums, Twitter provides shorter and less variable post content with regards to novelty on hacker techniques and exploitation tools. Thus, we imply that the drift on this platform is not enough to affect the performance of such models in 1-year period. Moreover, its users (even security researchers) use a more direct style of communication to reach broad audience without the need to deepen into technical details with specific and novel terms.
Furthermore, in order to provide a solution to the drift problem, we have investigated techniques such as periodic
update and weighting. We have found that by updating the model with 50% of the incoming instances in a bimester while giving them weights in a proportion of 3:1 is sufficient to avoid the performance decreasing.
We acknowledge that, in real-life situation, it still infea-sible to perform the labelling of 50% of messages in larger streams of data. However, with these results we highlight two important findings: (1) the importance of retraining the model over new (recent) messages and weight them to maintain the performance, and (2) not all streamed messages have the same importance, as the drift can be avoided by at least 50% of the relabelled data. We also point out that our experiment is limited to the amount of data we collected. Further tests need to be done with great volumes of posts in longer periods of time.
As future work, we intend to study the characteristics (patterns) of the worth-to-label messages in the data stream. Finding these messages would allow us to reduce the labelling task workload while maintaining the model usable for longer periods. We are also investigating concept-drift-detection al-gorithms, such as ADAWIN [9], EWMA [10] to trigger the labelling task after a potential change into the underlying distribution of the incoming data.
ACKNOWLEDGMENT
Andrei Lima Queiroz would like to thank the scholarship granted by the Brazilian Federal Programme Science without Borders supported by CNPq (Conselho Nacional de Desen-volvimento Cient´ıfico e Tecnol´ogico), No 201898/2015-2.
w0 w1 w2 w3 w4 Window 0.55 0.60 0.65 0.70 0.75 0.80 0.85 Ave ra ge C la ss Accu ra cy dataset = D1 w0 w1 w2 w3 w4 Window dataset = D2 w0 w1 w2 w3 w4 Window dataset = D4 Retrained 25% 50% 75% 100%
Fig. 4: Comparing the baseline static model, bold line (blue), against models retrained with different proportions (25, 50, 75, 100)% of past instances w0 w1 w2 w3 w4 Month 0.55 0.60 0.65 0.70 0.75 0.80 0.85 Ave ra ge C la ss Accu ra cy dataset = D1 w0 w1 w2 w3 w4 Month dataset = D2 w0 w1 w2 w3 w4 Month dataset = D4 Weight x2 x3 x5 x10
Fig. 5: Comparing models with different values of weights on new instances (x2, x3, x5, x10) against model with no weights, bold line (blue). All models using 50% proportion of incoming instances
REFERENCES
[1] S. Greengard, “Cybersecurity gets smart,”Communications of the ACM, vol. 59, no. 5, pp. 29–31, 2016.
[2] T. S. Sethi and M. Kantardzic, “When good machine learning leads to bad security: Big data (ubiquity symposium),”Ubiquity, vol. 2018, no. May, May 2018. [Online]. Available: https://doi.org/10.1145/3158346 [3] K. Zhao, Y. Zhang, C. Xing, W. Li, and H. Chen, “Chinese underground
market jargon analysis based on unsupervised learning,” in2016 IEEE Conference on Intelligence and Security Informatics (ISI), 2016, pp. 97– 102.
[4] S. Chatterjee and S. Thekdi, “An iterative learning and inference ap-proach to managing dynamic cyber vulnerabilities of complex systems,” vol. 193, 2020, p. 106664.
[5] S. Hilt, V. Kropotov, F. Merces, M. Rosario, and D. Sancho, “The internet of things in the cybercrime underground,” uRL: https://media.rbcdn.ru/media/reports/ wp-the-internet-of-things-in-the-cybercrime-underground.pdf [Accessed: Jan, 2020].
[6] R. P. Lippmann, W. M. Campbell, D. J. Weller-Fahy, A. C. Mensch, G. M. Zeno, and J. P. Campbell, “Finding malicious cyber discussions in social media,”Lincoln Laboratory Journal, vol. 22, no. 1, pp. 46–59, 2016.
[7] I. Deliu, C. Leichter, and K. Franke, “Extracting cyber threat intelligence from hacker forums: Support vector machines versus convolutional neural networks,” in2017 IEEE International Conference on Big Data (Big Data), Dec 2017, pp. 3648–3656.
[8] R. Jordaney, K. Sharad, S. K. Dash, Z. Wang, D. Papini, I. Nouretdinov, and L. Cavallaro, “Transcend: Detecting concept drift in malware
classification models,” in26th USENIX Security Symposium (USENIX Security 17). Vancouver, BC: USENIX Association, Aug. 2017, pp. 625–642. [Online]. Available: https://www.usenix.org/conference/ usenixsecurity17/technical-sessions/presentation/jordaney
[9] A. Bifet and R. Gavald`a, “Adaptive learning from evolving data streams,” in Advances in Intelligent Data Analysis VIII, N. M. Adams, C. Ro-bardet, A. Siebes, and J.-F. Boulicaut, Eds. Berlin, Heidelberg: Springer Berlin Heidelberg, 2009, pp. 249–260.
[10] G. J. Ross, N. M. Adams, D. K. Tasoulis, and D. J. Hand, “Exponentially weighted moving average charts for detecting concept drift,” Pattern Recogn. Lett., vol. 33, no. 2, p. 191198, Jan. 2012. [Online]. Available: https://doi.org/10.1016/j.patrec.2011.08.019 [11] A. L. Queiroz, S. Mckeever, and B. Keegan, “Detecting hacker threats:
Performance of word and sentence embedding models in identifying hacker communications,” inThe 27th AIAI Irish Conference on Artificial Intelligence and Cognitive Science, 2019, p. in press.
[12] ——, “Eavesdropping hackers: Detecting software vulnerability commu-nication on social media using text mining,” inThe Fourth International Conference on Cyber-Technologies and Cyber-Systems, 2019, pp. 41–48. [13] J. I. G. Hidalgo, B. I. F. Maciel, and R. S. M. Barros, “Experimenting with prequential variations for data stream learning evaluation,” vol. 35, no. 4, 2019, pp. 670–692. [Online]. Available: https://onlinelibrary.wiley.com/doi/abs/10.1111/coin.12208
[14] I. Zliobaite, M. Pechenizkiy, and J. Gama,An Overview of Concept Drift Applications, ser. Studies in Big Data. Switzerland: Springer International Publishing AG, 2016, pp. 91–114.
[15] S. V. Kadam, “A survey on classification of concept drift with stream data,” 2019, uRL: https://hal.archives-ouvertes.fr/hal-02062610 [Ac-cessed: Jan, 2020].