Deep Learning Based Forecasting of Individual
Residential Loads Using Recurrence Plots
Roozbeh Rajabi
Faculty of Electrical and Computer Engineering Qom University of Technology
Qom, Iran [email protected]
Abouzar Estebsari
Department of Energy Politecnico di Torino Turin, Italy [email protected]Abstract—High penetration of renewable energy resources in distribution systems brings more uncertainty for system control and management due their intermittent behaviour. In this context, besides generation side, demand side should be also controlled and managed. Since demand side has variant flexibility over time, in order to timely facilitate Demand Response (DR), distribution system operators (DSO) should be aware of DR potential in advance to see whether it is sufficient for different services, and how much and when to send DR signals. This indeed requires accurate short-term or medium-term load forecasting. There are many methods for predicting aggregated loads, but more effective DR schemes should involve individual residential households which would require load forecasting of single residential loads. This is much more challenging due to high volatility in load curves of single customers. In this paper, we present a novel method of forecasting individual household power consumption using recurrence plots and deep learning. We use Convolutional Neural Network (CNN) for such a two-dimensional deep learning approach, and compare it with one-dimensional CNN, as well as Support Vector Machine (SVM) and Artificial Neural Network (ANN). Demonstrating some experimental tests on a real case proved that our approach outperforms the other existing solutions.
Index Terms—load forecasting, deep learning, recurrence plot, demand response, residential load
I. INTRODUCTION
Both planning and operation of power systems have been always dealing with power balance challenges due to the uncertainty of many uncontrollable parameters in the system [1]. System security, stability, and reliability would be jeopardized if power balancing is not well addressed [2], [3]. Conventionally, power balance is ensured mainly by load frequency control capability of some bulk generators equipped with Automatic Generation Control (AGC). Active and reactive power of generators are constantly controlled to keep the power system in the steady-state. The load frequency control (LFC) loop controls the real power and frequency, and the automatic voltage regulator (AVR) loop regulates the reactive power and voltage magnitude. The methods developed for control of individual generators and finally control of large interconnections, play a crucial role in power system control and management.
To feed proper load data for above-mentioned analysis to avoid large amount of unexpected power imbalance, an accurate ex-ante load estimation is required. This is practically
performed by forecasting electricity demand in different time horizons.
It has been decades that different forecasting methods could support power system analysis, especially for forecasting distributed loads in aggregated amount in transmission systems. But nowadays penetration of distributed generations in distribution systems, especially from variable renewable energy (VRE) resources make forecasting of net consumption of distribution systems more challenging. In case of low system flexibility and ramping reserve, sudden severe weather changes would lead to power imbalances by VREs [4]. Therefore, the load centers cannot be considered as passive systems with high predictability any more, instead they are becoming more active with higher uncertainty due to emerging intermittent VREs. As an example, in a modern urban distribution system with high penetration of rooftop PV generation and presence of lots of electric vehicles (EV), system operators face more challenges than before if a high power is demanded by many EVs exactly when PV generation is dropping due to some clouds which are dramatically reducing solar irradiation [4]. Net power absorption of this distribution network would rapidly increase and result in frequency control challenges in transmission systems.
In order to increase system flexibility to tackle the above-mentioned challenges of VREs, not only generation side, but also demand side should be managed and controlled. Distribution system operators exploit flexibility of some available resources such as storage units along with demand side management (DSM) schemes to ensure system stability and proper performance.
DSM consists of mechanisms that aim at modifying the consumers’ demand profile to match the supply. It facilitates the integration of distributed generation, and it eases handling emergency conditions. As a class of DSM mechanisms, Demand Response (DR) reschedules energy consumption patterns of users in response to the variance of the power utility’s incentive or electricity price [5]. In all these DR schemes, in order to wisely adjust the incentives or tariffs, we need load forecasting to estimate demand flexibility.
The load forecasting of aggregated loads have been studied in many literature (e.g. in [6] and [7]), and quite accurate methods have been proposed to predict the demand at the
aggregated level (e.g. at a primary or secondary substation level). Some new methods are based on machine learning algorithms which increase the accuracy of the prediction of these aggregated loads ([8]).
Some methods are applied to single large consuming devices, such as heat pumps [9], water heaters for interfacing electricity grid and district heating networks [10], electric vehicles at the station columns [11], etc. In some of these papers, some machine learning algorithms are used for load forecasting of only one single-phase or three-phase appliance ([12], [13]).
Our focus of study, instead, is on load forecasting of single residential customers. Regarding DR systems, in order to widely exploit flexibility of demand in the distribution system, not only large-scale assets of the network (e.g. water heater for district heating network) should be involved, but also residential customers could participate in DR for a more efficient contribution. As an example, in low voltage (LV) grids, to fix problem of unbalanced three-phase systems, shifting some residential loads supplied by one single-phase LV feeder, may bring back the three-phase balance to the network. This implies the importance of contribution of individual customers in DR programs. Nevertheless, solutions and discussions on this context is less mature with respect to the solutions provided for aggregated loads and large-scale consuming devices in the distribution systems. One of the main challenges is the high volatility in the small residential load profiles. The fewer the appliances, the higher volatility in the load curve could be expected, and this makes forecasting more difficult.
There are recent studies on proposing different machine learning solutions for accurate load forecasting of individual residential customers. Most of the effective algorithms are based on deep learning methods ([14], [15]). However, the performance of the methods and the accuracy of the solutions are the main points of discussions and comparisons. Within this context, we propose integration of recurrence plots to Convolutional Neural Network (CNN) to make the first layer 2 dimensional (2-D) instead of directly feeding time-series. The results of our tests showed a higher accuracy of this solution with respect to Support Vector Machine (SVM) [16], Artificial Neural Network (ANN) [17], and also 1-D CNN [18].
The rest of this paper contains following discussions: the methodology of our proposed solution is introduced in Section II. To evaluate the performance of the new solution, we applied it to a set of historic data of active power consumption of a single residential household. The experiments and the results are demonstrated and compared with three existing methods in Section III. The paper will be concluded with some short remarks and ideas of extension of the work in Section IV.
II. METHODOLOGY
In this section, proposed methodology is discussed. Firstly, time series forecasting problem is formulated in II-A. Deep learning methods and structures are discussed in II-B. Time series image encoding and generating recurrence plots are
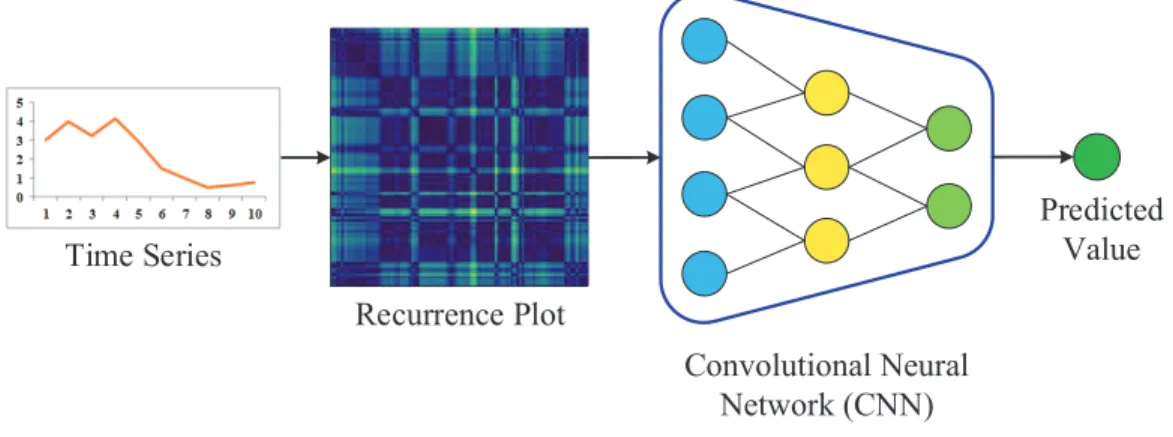
explored in II-C. Finally the proposed method based on deep learning and time series image encoding as depicted in Fig. 1 is discussed in II-D.
A. Time Series Prediction
Time series is a sequence of vectors or scalars that depend on time. Time series of vectors can be defined as (1).
{x(t0),x(t1),x(t2), ...} (1) Fig. 2 illustrates sample sequence of the dataset used in this study that is described in III-A.
On of the important tasks in time series processing is predicting future values of x(t). The problem of predicting future values can be done using past values of time series. From this point of view the future value can be predicted based on a model such as (2).
ˆx(ti+1) =fx(ti),x(ti−1),x(ti−2), ... (2) where f is the prediction function and i is the current time index.
B. Deep Learning
Deep learning techniques attracted a lot of interest in machine learning problems like classification, clustering and regression. There are two main types of deep learning networks named convolutional neural network (CNN) and recurrent neural network (RNN) [19]. Typically in regression and forecasting problems, one dimensional CNN (1D CNN) is used since the problem is based on time series data that is one dimensional intrinsically. CNN consists of convolutional, pooling and fully connected layers. In each convolutional layer, the input data is convolved with a number of filters. Values in the filter are equivalent to weights in neural networks that should be updated during the training procedure based on algorithms like backpropagation. After each convolutional layer, activation functions are applied to add nonlinearity to the system. Pooling layers are used to reduce spatial dimension in order to control the number of the parameters and overfitting. Finally fully connected layers maps the feature maps to the desired output.
In this paper we used deep 2D CNN to predict individual household power consumption. In 2D CNN, the input layer accepts two dimensional data in contrast to 1D CNN that accepts one dimensional time series. One convolutional layer and one max pooling layer is used with 16 filters and kernel size of 4. Fully connected layer with 64 nodes has been used after convolutional layer. All activation functions are set to rectified linear unit (ReLU). Fig. 3 shows the structure of used CNN network.
C. Time Series Image Coding
To improve performance of classification and prediction of time series it is possible to encode time series as images. The reason behind this idea is that deep networks shows high ability to understand images [20]. There are different
Recurrence Plot
Convolutional Neural
Network (CNN)
Time Series
Predicted
Value
Fig. 1: Proposed structure for individual household power consumption prediction using RP and Deep CNN.
Fig. 2: Sample Individual Residental Load Profile.
ways to encode time series to images like recurrence plots (RP), Gramian angular field (GAF) and Markov transtion filed (MTF) [21].
In this paper, recurrence plots (RP) have been used to encode individual household power consumption data as images. To generate recurrence plots [22] first states in the phase space trajectory of time series sequence should be computed according to the following equation:
s(ti) =x(ti),x(ti−1) (3) Then recurrence plots are formed using the following equation:
R(i, j) =dists(ti),s(tj) (4) whereRis the recurrence plot anddistis the distance function that can be calculated based on Euclidean distance.
Fig. 4a and 4b show RPs for two different sample times. The data set used here is described in III-A. As it can be seen in this figures different times ended to different encoded images containing different features.
D. Proposed Method
The proposed structure is depicted in Fig. 1. In this structure firstly time series data are encoded to recurrence plot images
and then these images are fed into deep CNN to get the predicted value of time series data. Details of used deep 2D CNN is discussed previously in II-B and depicted in Fig. 3.
III. EXPERIMENTS ANDRESULTS
In this section used dataset is described in III-A. Conducted experiments and comparison results to evaluate proposed method are discussed in III-B.
A. Dataset
In this paper, individual household electric power consumption data set [23] has been used for evaluation of proposed method. In Advanced Metering Infrastructure (AMI), data is typically collected as measurements from the meters or pushed as commands to devices every 15 minutes or hourly to ensure a wealth of granular information exchange for demand response service.
The dataset extracted for our experiments contain 2075259 records gathered in a house located in Sceaux (7km of Paris, France) between December 2006 and November 2010 (47 months). There are missing values in this dataset that in this work we replaced them by average of available measurement at that time section in other years [24]. Down-sampled data in conjunction with original high resolution data are depicted in Fig. 5.
B. Results
To evaluate performance of the proposed method, three different methods has been used to evaluate: support vector machine (SVM) [16], artificial neural network (ANN) [17] and convolutional neural network (CNN) [18].
The proposed algorithm and compared methods implemented using Python and Tensorflow. CNN with one convolutional layer, one pooling layer and one fully connected layer has been used in this study.
Fig. 6 and 7 demonstrate predicted and true values of test samples. These figures show that the proposed method can predict next values more efficiently in comparison with 1-D CNN. However, to evaluate quantitatively, two common
Input Convolutional Layer Output . . .
Max Pooling Layer
Flatten Fully Connected Layer . . . . . . . . .
Feature Extraction
Fig. 3: CNN Structure. (a) (b)Fig. 4: Sample recurrence plot of 96 points load profile time series calculated at two different time steps.
Fig. 5: High resolution and downsampled data by averaging every 15 minutes.
criteria used: Mean Absolute Error (MAE) and Root Mean Square Error (RMSE). These metrics are defined in Eqs. 5 and 6.
Fig. 6: Individual household power consumption prediction using CNN-1D.
Fig. 7: Individual household power consumption prediction using CNN-2D-RP.
MAE=
N
i=1|ˆy(ti)−y(ti)|
N (5)
whereˆyandyare the predicted and true values of test samples respectively and N is total number of test samples.
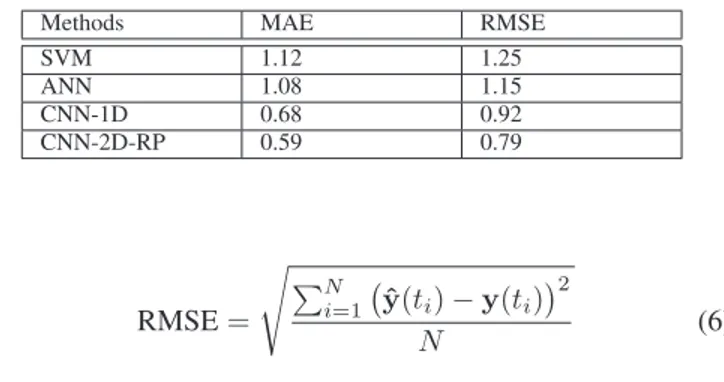
TABLE I: Comparison of different methods based on MAE and RMSE.
Methods MAE RMSE SVM 1.12 1.25 ANN 1.08 1.15 CNN-1D 0.68 0.92 CNN-2D-RP 0.59 0.79 RMSE= N i=1 ˆy(ti)−y(ti)2 N (6)
Table I shows comparison of the proposed method, 1D CNN, ANN and SVM based on MAE and RMSE. As it shows the proposed method outperforms compared methods in terms of defined criteria.
IV. CONCLUSION ANDFUTUREWORK
To apply an effective DR, individual residential customers should get also directly involved in DR process. Practically, this is possible thanks to widely distributed smart meters and emerging AMI. However, this would require accurate load forecasting of single residential loads, which is quite challenging with respect to the aggregated loads due to high volatility of power consumption of single customer.
In this paper, we introduced a deep learning based structure to predict such individual loads. In the proposed structure we exploit using recurrence plots to encode time series data into images. Results based on MAE and RMSE criteria show that the proposed method performs better in comparison with CNN and classic machine learning methods namely SVM and ANN. The proposed method outperforms its 1D counterpart about 20% in terms of RMSE.
For further works, one can use other image encoding methods like Gramian angular field (GAF) or Markov transition field (MTF) to convert time series into images before feeding to deep networks. Besides, recently proposed deep learning structures can be used instead of conventional deep CNN.
REFERENCES
[1] Y. Wang, N. Zhang, C. Kang, M. Miao, R. Shi, and Q. Xia, “An efficient approach to power system uncertainty analysis with high-dimensional dependencies,”IEEE Transactions on Power Systems, vol. 33, no. 3, pp. 2984–2994, May 2018.
[2] A. Estebsari, E. Pons, T. Huang, and E. Bompard, “Techno-economic impacts of automatic undervoltage load shedding under emergency,” Electric Power Systems Research, vol. 131, pp. 168 – 177, 2016. [Online]. Available: http://www.sciencedirect.com/science/article/pii/S0378779615003120 [3] A. Estebsari, T. Huang, E. Pons, and E. Bompard, “Electricity
infrastructure enhancement for the security of supply against coordinated malicious attacks,” in 2016 IEEE 16th International Conference on Environment and Electrical Engineering (EEEIC), June 2016, pp. 1– 6.
[4] M. Stevic, A. Estebsari, S. Vogel, E. Pons, E. Bompard, M. Masera, and A. Monti, “Multi-site european framework for real-time co-simulation of power systems,”IET Generation, Transmission Distribution, vol. 11, no. 17, pp. 4126–4135, 2017.
[5] L. Barbierato, A. Estebsari, E. Pons, M. Pau, F. Salassa, M. Ghirardi, and E. Patti, “A distributed iot infrastructure to test and deploy real-time demand response in smart grids,”IEEE Internet of Things Journal, pp. 1–1, 2018.
[6] B. Stephen, X. Tang, P. R. Harvey, S. Galloway, and K. I. Jennett, “Incorporating practice theory in sub-profile models for short term aggregated residential load forecasting,” IEEE Transactions on Smart Grid, vol. 8, no. 4, pp. 1591–1598, July 2017.
[7] J. Pono´cko and J. V. Milanovi´c, “Forecasting demand flexibility of aggregated residential load using smart meter data,”IEEE Transactions on Power Systems, vol. 33, no. 5, pp. 5446–5455, Sept 2018. [8] M. A. Nokar, F. Tashtarian, and M. H. Y. Moghaddam, “Residential
power consumption forecasting in the smart grid using anfis system,” in 2017 7th International Conference on Computer and Knowledge Engineering (ICCKE), Oct 2017, pp. 111–118.
[9] K. Kouzelis, Z. H. Tan, B. Bak-Jensen, J. R. Pillai, and E. Ritchie, “Estimation of residential heat pump consumption for flexibility market applications,”IEEE Transactions on Smart Grid, vol. 6, no. 4, pp. 1852– 1864, July 2015.
[10] M. Shaad, A. Momeni, C. P. Diduch, M. E. Kaye, and L. Chang, “Forecasting the power consumption of a single domestic electric water heater for a direct load control program,” in2015 IEEE 28th Canadian Conference on Electrical and Computer Engineering (CCECE), May 2015, pp. 1550–1555.
[11] X. Hu, E. Ferrera, R. Tomasi, and C. Pastrone, “Short-term load forecasting with radial basis functions and singular spectrum analysis for residential electric vehicles recharging control,” in2015 IEEE 15th International Conference on Environment and Electrical Engineering (EEEIC), June 2015, pp. 1783–1788.
[12] J. Schachter and P. Mancarella, “A short-term load forecasting model for demand response applications,” in11th International Conference on the European Energy Market (EEM14), May 2014, pp. 1–5.
[13] K. P. Warrior, M. Shrenik, and N. Soni, “Short-term electrical load forecasting using predictive machine learning models,” in2016 IEEE Annual India Conference (INDICON), Dec 2016, pp. 1–6.
[14] W. Kong, Z. Y. Dong, F. Luo, K. Meng, W. Zhang, F. Wang, and X. Zhao, “Effect of automatic hyperparameter tuning for residential load forecasting via deep learning,” in2017 Australasian Universities Power Engineering Conference (AUPEC), Nov 2017, pp. 1–6.
[15] W. Kong, Z. Y. Dong, Y. Jia, D. J. Hill, Y. Xu, and Y. Zhang, “Short-term residential load forecasting based on lstm recurrent neural network,”
IEEE Transactions on Smart Grid, pp. 1–1, 2018.
[16] B.-J. Chen, M.-W. Chang, and C.-J. lin, “Load forecasting using support vector machines: a study on eunite competition 2001,” IEEE Transactions on Power Systems, vol. 19, no. 4, pp. 1821–1830, Nov 2004.
[17] D. C. Park, M. A. El-Sharkawi, R. J. Marks, L. E. Atlas, and M. J. Damborg, “Electric load forecasting using an artificial neural network,”
IEEE Transactions on Power Systems, vol. 6, no. 2, pp. 442–449, May 1991.
[18] K. Amarasinghe, D. L. Marino, and M. Manic, “Deep neural networks for energy load forecasting,” in2017 IEEE 26th International Symposium on Industrial Electronics (ISIE), June 2017, pp. 1483–1488. [19] Y. LeCun, Y. Bengio, and G. Hinton, “Deep learning,”nature, vol. 521,
no. 7553, p. 436, 2015.
[20] X. Ma, Z. Dai, Z. He, J. Ma, Y. Wang, and Y. Wang, “Learning traffic as images: a deep convolutional neural network for large-scale transportation network speed prediction,”Sensors, vol. 17, no. 4, p. 818, 2017.
[21] Z. Wang and T. Oates, “Encoding time series as images for visual inspection and classification using tiled convolutional neural networks,” in Workshops at the Twenty-Ninth AAAI Conference on Artificial Intelligence, vol. 1, 2015.
[22] J. D. Nima Hatami, Yann Gavet, “Classification of time-series images using deep convolutional neural networks,” pp. 10 696 – 10 696 – 8, 2018. [Online]. Available: https://doi.org/10.1117/12.2309486 [23] K. Bache and M. Lichman, “Individual household electric power
consumption data set,” 2012, data retrieved from UCI machine learning repository, https://archive.ics.uci.edu/ml/datasets.html.
[24] E. Mocanu, P. H. Nguyen, M. Gibescu, and W. L. Kling, “Deep learning for estimating building energy consumption,”Sustainable Energy, Grids and Networks, vol. 6, pp. 91 – 99, 2016. [Online]. Available: http://www.sciencedirect.com/science/article/pii/S2352467716000163