Estimation of the Causes of Subprime Mortgage
Crisis
by Grece Aoun
November, 2009
Abstract
In light of the recent mortgage crisis, identifying the origins is crucial to prevent such a crisis from reoccurring in the future. This paper pri-marily links foreclosure to subprime loan expansion. To that end, more than one and half million subprime loans originated between 2006 and 2007 across top metropolitan statistical area in the United States are an-alyzed. First, this research shows evidence that subprime loans played a signicant role in the deterioration of the real-estate market. Second, it demonstrates that other variables such as income and lending stan-dards have contributed to the high default rate. Third, it conrms the fact that subprime loans originated for the purpose of renancing have more impacts on foreclosure. The results obtained are all signicant and consistent.
Keywords: foreclosure, subprime, renancing Résumé
Ce rapport traite de la crise immobilière et essaie d'identier ses causes et origines an de pouvoir éviter des crises similaires dans le futur. En eet, cette étude s'intéresse principalement aux hypothèques à risque ainsi qu'au lien entre l'expansion du marché du crédit et la déteriora-tion du marché immobilier. À cette n, plus d'un million et demi de prêt émis entre 2006 et 2007 dans les grandes métropoles américaines ont été analysés. Les objectifs de cette étude sont de trois ordres. Premièrement, des preuves sont présentées an de démontrer le lien existant entre les hypothèques à risque et le grand nombre de maisons saisies. Deuxième-ment, cette étude cherche à quantier l'impact des variables revenu et conditions de prêt sur la crise immobilière. Troisièmement, ce rapport démontre empiriquement le rôle prépondérant des hypothèques de re-nancement quant au nombre de saisies. Enn, les résultats obtenus sont signicatifs et consistants avec la littérature antérieure sur le sujet. Mots clés: maisons saisies, hypothèques à risque, renancement
Acknowledgement
I am heartily thankful to my supervisor, Emanuela Cardia, whose encourage-ment, guidance and support from the initial to the nal level enabled me to develop an understanding of the subject. Also, I would like to thank Professor Benoit Perron for his help and contribution to this paper. Lastly, I am grateful to Vincent Hébert and Rana Traboulsi who supported me and helped me during the completion of the project. I believe this thesis would not have been possible without their contribution and for that I am profoundly thankful.
Abbreviations
ABS Asset backed Security ARM Adjustable rate mortgage CDO Collateralized debt obligation DTI Debt to income
FALP First American LoanPerformance
FFIEC Federal Financial Institutions Examination Council FICO Fair Isaac Corporation
FRM Fixed rate mortgage
GSE Government sponsored enterprise HMDA Home Mortgage Disclosure Act HUD Housing and Urban Development LTV Loan to value
MBS Mortgage Backed security MSA Metropolitan statistical area
OFHEO Oce of Federal Housing Enterprise Oversight RMBS Residential mortgage backed security
Contents
1 Introduction 1
2 Background and timeline of events 2
2.1 Overview . . . 2
2.2 The rise of subprime lending . . . 3
2.3 Distribution of subprime lending . . . 8
3 Impacts of subprime lending on the economy 10 3.1 Impact on foreclosures . . . 10
3.2 Impact on nancial institutions . . . 11
4 Related literature 13 5 The empirical analysis 16 5.1 Methodology . . . 16
5.2 Data and descriptive statistics . . . 18
5.3 Estimations . . . 19 5.3.1 Regression 1 . . . 19 5.3.2 Regression 2 . . . 20 5.3.3 Regression 3 . . . 20 5.3.4 Regression 4 . . . 21 6 Conclusion 22
List of Figures
1 Changes in type of loans over time . . . 32 Securitization rates . . . 5
3 Fraction of mortgages sold to private mortgage institutions . . . 6
4 Monthly house price index, purchase only . . . 7
5 Homeownership rate . . . 7
6 Geographic dispersion of subprime originations in 2006 . . . 8
7 Mortgage foreclosure llings as a percent of households for MSAs, 2007 . . . 10
8 House price appreciation and subprime delinquency rates among MSAs . . . 11
9 Actual and adjusted delinquency rate . . . 11
A.1 Distribution of the MSAs of interest . . . 26
List of Tables
1 Evolution of subprimes . . . 42 Distribution of subprime by purpose and year of origination . . . 4
3 Distribution of subprime loans by major metropolitan area . . . 9
4 US banking industry . . . 12
1 Introduction
The sharp rise in U.S. mortgage default rates has led to the most severe nancial crisis since the Great Depression. It has had impacts not only on the housing market, but also on the nancial market, the goods and services market, the labour market and many others. Losses have reached extraordinary levels and are still rising. The recent global nancial turmoil has been linked to many catalysts, such as the housing bubble, the increased level of risk, asymmetric information, and a change in monetary policy. In addition, preliminary evidence in the aftermath of the crisis indicates that the probability of default is higher for subprime loans. Subprime lending targets borrowers who lack or suer from insucient credit history, and who would otherwise be denied credit. It has increased remarkably over the last decade, evolving into a major segment of the mortgage market.
This paper provides information about subprime lending and the subsequent increase in default rate in an attempt to shed light on the causes of the crisis. More particularly, this analysis aims at empirically examining the impact of sub-prime origination on foreclosures. Data about foreclosures, subsub-prime, income, loan amount, and others, are taken from several sources; in addition, micro-level data are analyzed to capture within-state variability, since the impact of the nancial crisis diers from one region to another.
The paper is organized as follows: Section 2 describes the context of the cri-sis, denes key words and exposes the timeline of events; Section3 identies the major impacts on the real-estate market and on the nancial institutions; Sec-tion 4 reviews the related literature; SecSec-tion 5 describes the empirical method-ology as well as the data used for the analysis and presents the results obtained; and nally, section 6 concludes.
2 Background and timeline of events
2.1 Overview
The term subprime is not consistently dened in the literature so there is no unique denition of a subprime mortgage.
From the lender's perspective, a subprime mortgage loan is a residential loan directed to borrowers who are less likely to repay a loan because of lack or insucient credit history. Thus, the lenders can charge higher upfront1 and
continuing costs2 than conventional3 or prime mortgage; they can ask for an
interest rate premium based on the expected risks of default which, according to Chomsisengphet and Pennington-Cross (2006), is typically around 2 percentage points. Finally, such institutions are likely to practice predatory lending4 and
as a result can charge even higher interest rates on their loans.
Subprime loans have very loose underwriting standards. In fact, Ki and Mills (2007), nd that the loan-to-value ratios5are usually high: over 85 percent,
the debt-to income requirements are not very stringent: above 55 percent, and subprime borrowers have a FICO6 below 620. Moreover, subprime lenders are
willing to accept limited or no documentation of borrowers' income and assets. Subprime mortgages can vary a lot between one type and another. Interest-only payments allow borrowers to pay solely the interest for a period of time between 5 to 10 years, while pay option loans usually have adjustable interest rates and allow borrowers to choose their monthly payment. The latter can either pay the full amount, or pay only interest or a minimum payment lower than the payment required reducing the balance of the loan. Finally, there are hybrid mortgages that may start with xed rates that are often below-market (i.e.teaser) rates and eventually convert to adjustable rates.
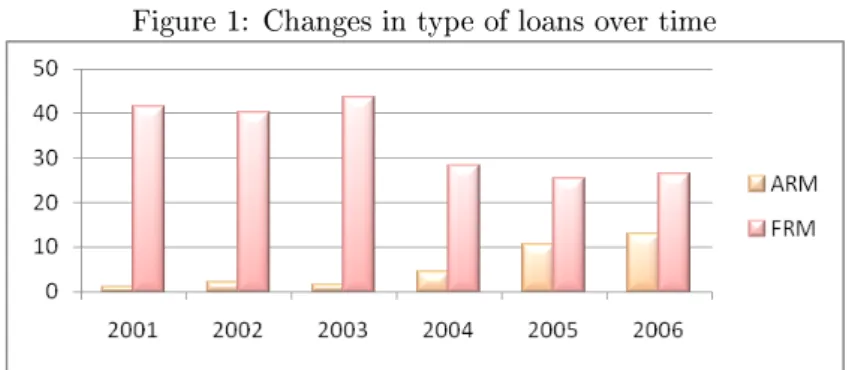
Interest rates on adjustable rates mortgages (ARMs) are pegged to a bench-mark rate, such as the six month Libor rate or the one-year Treasury bill rate. Over time, ARMs have experienced a sharp increase whereas FRMs experienced a slowdown (Figure 1). Moreover, based on Chomsisengphet and Pennington-Cross (2006), ARM borrowers have on average, lower credit scores than xed rate mortgage (FRMs) borrowers. For example, in 2003, FRMs were almost 50 points lower than ARMs (623 versus 675).
1Upfront costs include application fees, appraisal fees, and other fees associated with orig-inating a mortgage
2Continuing costs include mortgage insurance payments, principle and interest payments, late fees and nes for delinquent payments, and fees levied by a locality (such as property taxes and special assessments)
3Conventional loans are loans that are eligible for purchase by government sponsored en-tities: Fannie Mae and Freddie Mac.
4Predatory lending is an abusive practice where lenders charge excessive, often hidden fees; successively renance loans; make loans without regard to a borrower's ability to repay; and engage in high-pressure sales tactics or outright fraud and deception
5Loan-to-value (LTV) ratio measures the amount of the loan expressed as a percentage of the value of the home
6FICO, developed by Fair Isaac Corporation, is a summary measure that captures the borrower's credit quality
Figure 1: Changes in type of loans over time
All gures are in percentage
Source: Demyanyk, Van Hemmert, (2008)
2.2 The rise of subprime lending
The subprime mortgage market gained national attention in the mid-1990s when it started being considered as a major component of home nancing.
For some, the growth in subprime lending is viewed as an economic break-through. Former Federal Reserve Chairman Alan Greenspan generally referred to subprime lending as the democratization of credit, that enables borrowers with impaired or limited credit history to receive access to home loans that would have been denied in the past. Subprime loans may give higher incentives to become homeowners instead of staying renters. Also, it may allow some homeowners, suering from liquidity constrained, to extract cash from their properties.
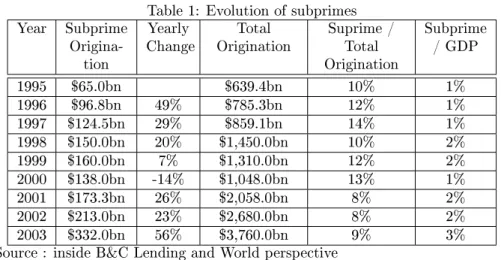
Over the last decade, the share of subprime loans experienced a sharp in-crease. Using data reported by the magazine Inside B&C Lending (2006), total subprime loans grew from $65 billion in 1995 to $332 billion in 2003 (Table 1). Moreover, according to Federal Reserve Governor Randall S. Kroszner (2006), subprime loans were more prevailing, as newly originated mortgages conformed less to strict prime standards and to government-sponsored housing enterprises criteria. Nevertheless, it is the whole mortgage market that expanded, including conventional, subprime and other types of loans. Indeed, mortgage lending has more than quadrupled between 1995 and 2003.
Table 1: Evolution of subprimes Year Subprime
Origina-tion
Yearly
Change OriginationTotal Suprime /Total Origination Subprime / GDP 1995 $65.0bn $639.4bn 10% 1% 1996 $96.8bn 49% $785.3bn 12% 1% 1997 $124.5bn 29% $859.1bn 14% 1% 1998 $150.0bn 20% $1,450.0bn 10% 2% 1999 $160.0bn 7% $1,310.0bn 12% 2% 2000 $138.0bn -14% $1,048.0bn 13% 1% 2001 $173.3bn 26% $2,058.0bn 8% 2% 2002 $213.0bn 23% $2,680.0bn 8% 2% 2003 $332.0bn 56% $3,760.0bn 9% 3%
Source : inside B&C Lending and World perspective
However, unlike the common notion that a mortgage loan is intended to people wanting to become homeowners, most subprime loans did not follow this same purpose. In fact based on Schloemer, Li, Ernst, and Keest (2006), the majority of subprime loans originated in the last decade have been for the purpose of renance7 rather than for home purchase. In 2004, 50.8% of total
mortgage originated were for renance whereas, only 39.5% were intended to purchase a home (Table 2). Indeed, American households have used intensively renancing to pull money out of their homes. Figures from Greenspan and Kennedy (2004) indicate that over two trillion dollars were extracted in the past ve years alone. In addition, according to Darlin (2006), even when interest rates were rising in 2006, the renance pace did not slow down. Therefore, over $500 billion were extracted in home equity, which represents more than the total amount taken out in all of 2005.
Table 2: Distribution of subprime by purpose and year of origination
1998 1999 2000 2001 2002 2003 2004 Purchase 30.45% 31.55% 38.47% 35.21% 32.84% 32.09% 39.5% Renance (cash out) 47.03% 51.85% 49.65% 52.06% 52.55% 53.7% 50.8% Renance
(no cash out)
20.12% 15.06% 11.75% 12.71% 14.61% 14.2% 9.68%
Other 2.39% 1.54% 0.12% 0.03% 0.01% 0.01% 0.02%
Source: Schloemer, Li, Ernst, and Keest, (2006)
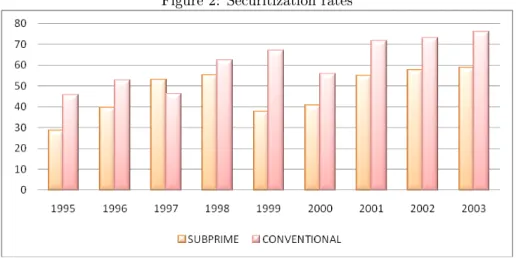
Furthermore, the nancial market experienced an unrecorded increase in the rate of securitization8. In fact, according to Keys, Mukherjee, Seru and Vig
(2008), the securitization rate has more than doubled going from 30 percent in 1995 to over 80 percent in 2006.
Securitization is a process where loans are purchased from originating rms such as banks, mortgage companies, and others institutions, and then assembled
7Cash-out renancing indicates that the borrower receives the dierence in cash between a new loan that is larger than the old loan
into pools and nally sold to third-party investors. These securitized credits represent claims on the principal and interest payments made by borrowers on the loans in a pool. Securitization helps converting illiquid assets into liquid securities and oers innovative nancial benets such as a greater diversication and spreading of risk, potentially broadening access to credit and lowering its cost.
Figure 2: Securitization rates
Figures are in percentage Source: Inside MBS & ABS
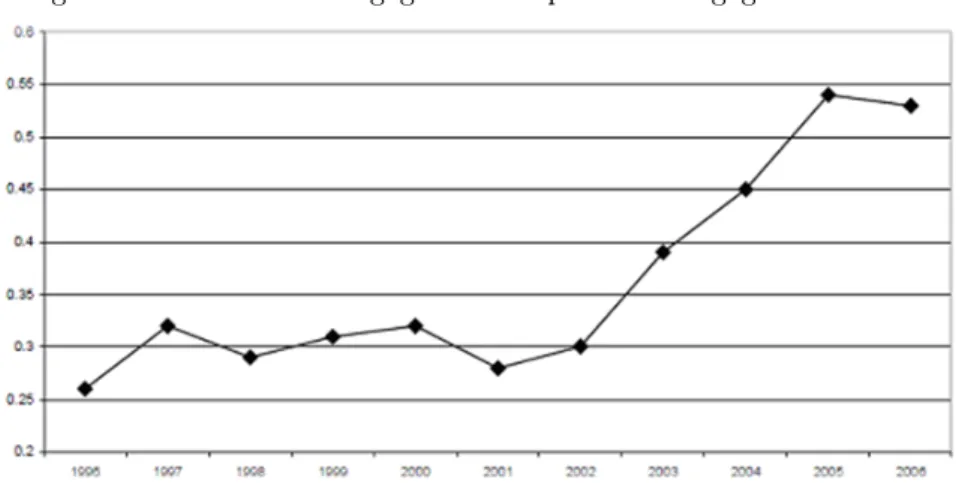
In the last decade, brokerage rms, banks, and other private institutions took over residential mortgages securitization which used to be issued by gov-ernmentsponsored enterprises (GSEs), such as Fannie Mae and Freddie Mac. These shifts from public to private entities lead to the fast development of private-label residential mortgage-backed securities (RMBSs). Based on Fur-long, Takhtamanova, Laderman, and Krainer (2007), the share of total subprime nancing through RMBSs grew from about 46 percent in 2001 to 75 percent in 2006.
Consequently, while the private and public sector might be working similarly, the main dierence between them is that the latter is far more stringent on its eligibility criteria and primarily securitizes loans to higher quality borrowers who met legislative limits on loan size, credit score, and underwriting standards.
Figure 3: Fraction of mortgages sold to private mortgage institutions
*Private mortgage institutions include all third parties except for Fannie Mae, Ginnie Mae, and Farmer Mac
Sources: Mian and Su, (2008), and HMDA data
Moreover, investors were not only holding RMBS but also other types of asset-backed securities (ABS). Therefore, they were not directly exposed to subprime loans but rather through a combination of debt. Indeed, mortgage institutions securitize several already securitized bundles of long-term debt in-struments and then sell them to investors. For example, collateralized debt obligations (CDOs), are a package of multiple RMBSs and other types of debt. As a result, these investors did not know the risk exposure of their investment and thus had to rely on credit rating agencies such as Standard & Poor's and Moody's. Unfortunately however, a very large share of investments was origi-nally highly rated (AAA or AA) but eventually turned out to be implicated in much higher risk.
On the other hand, the nancial innovations were not the only main changes that occurred during the late 1990s. In fact, the real estate market and interest rates also experienced some drastic alterations. Based on Furlong, Takhta-manova, Laderman, and Krainer (2007), house prices increased tremendously, reaching in 2004 and 2005 unbelievable gains while, interest rates dropped sharply. Therefore, this period was characterized by low-cost access to the equity in homes. Furthermore, speculative borrowers were drawn toward the mortgage market because of the prevailing rise in housing prices and because house values were expected to keep appreciating. They were thus after capital gain opportunities.
Figure 4: Monthly house price index, purchase only
Source: Federal housing nance agency, (2009)
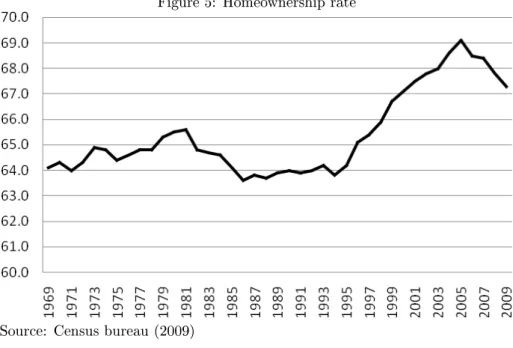
These favourable conditions combined with the development in asset-backed markets facilitated a substantial expansion of homeownership and thus encour-aged people to take on more credits. Indeed, Figure 5 shows the sharp increase in homeownership from 1995 to 2005.
Figure 5: Homeownership rate
Source: Census bureau (2009)
In addition to these changes in the market structure, some laws were imple-mented and have contributed to the growth of subprime lending.
In 1980, the Depository Institutions Deregulation and Monetary Control Act (DIDMCA) was adopted: it allowed charging high rates and fees to
borrowers which was not possible until then. It pre-empted state interest rate caps.
In 1982, the Alternative Mortgage Transaction Parity Act (AMTPA) al-lowed the use of variable interest rates and balloon payments.
In 1986, the Tax Reform Act prohibited the deduction of interest on con-sumer loans, yet allowed interest deductions on mortgages for a primary residence as well as one additional home. This made even high-cost mort-gage debt cheaper than consumer debt for many homeowners.
2.3 Distribution of subprime lending
The subprime growth has transformed the mortgage nancial system throughout the nation. However, the regional importance of subprime mortgages varies considerably.
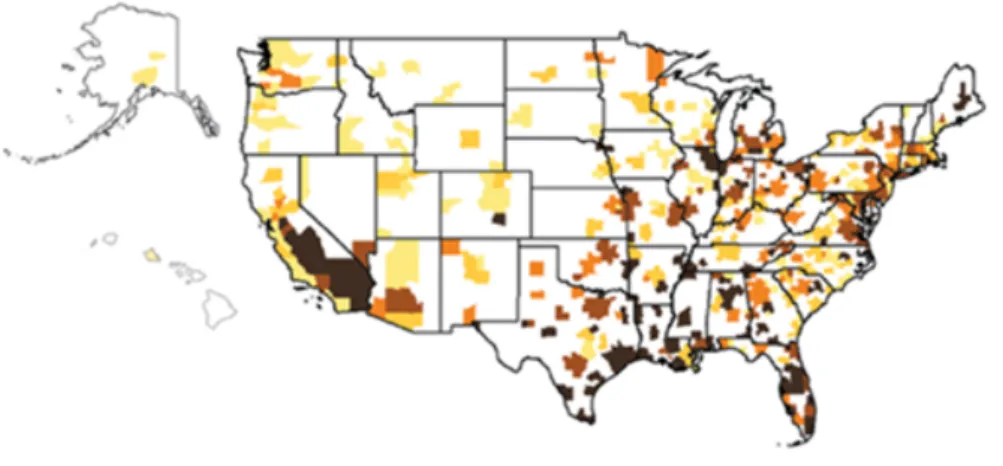
Figure 6: Geographic dispersion of subprime originations in 2006
Source: HMDA Data- Released by FFIEC
According to Mayer and Pence (2008), Subprime originations appear to be heavily concentrated in fast-growing parts of the country with considerable new construction, such as Florida, California, Texas, Washington DC, and the Great lakes area. Concentrations are especially pronounced in Los Angeles, Chicago, Phoenix, Atlanta, New York, Houston, San Francisco, Washington D.C., Florida, and Dallas.
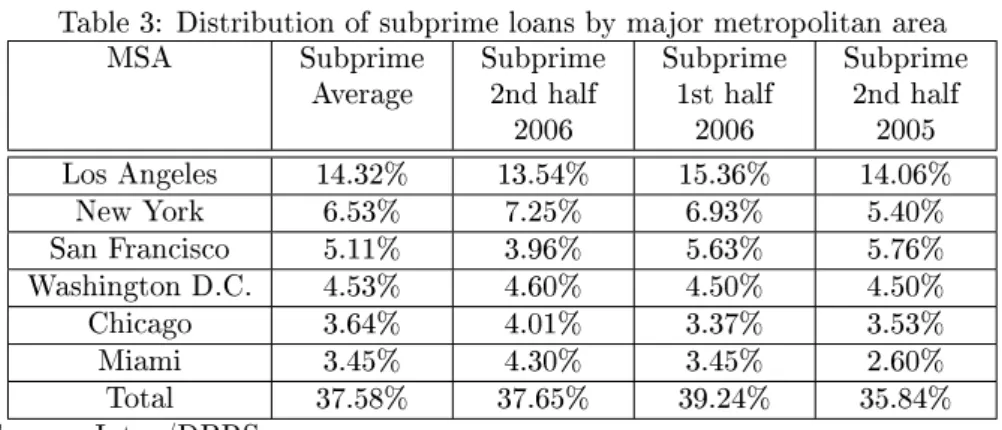
Table 3: Distribution of subprime loans by major metropolitan area
MSA Subprime
Average Subprime2nd half 2006 Subprime 1st half 2006 Subprime 2nd half 2005 Los Angeles 14.32% 13.54% 15.36% 14.06% New York 6.53% 7.25% 6.93% 5.40% San Francisco 5.11% 3.96% 5.63% 5.76% Washington D.C. 4.53% 4.60% 4.50% 4.50% Chicago 3.64% 4.01% 3.37% 3.53% Miami 3.45% 4.30% 3.45% 2.60% Total 37.58% 37.65% 39.24% 35.84% Source: Intex/DBRS
Moreover, geographical data shows that the locations where subprime rates are high are the same that include faster than average increase in house prices. Indeed, Mayer and Pence (2008), believe that mortgage activity is triggered by a mix of increased construction activities and housing price appreciation. Ac-cording to them, an area embodying this kind of dynamic must have greater mortgage activities than areas with more depressed housing markets. There-fore, it may be protable to move to rapidly growing areas: renters may have better incentives to transition to homeownership; investors may nd real-estate opportunities and nally, homeowners may pull out capital gains through cash-out renancing. However, even though many papers argue that construction and house prices are correlated with subprime lending, the link between these variables is not universally dened yet.
Furthermore, according to Minczeski and Taylor 2007, the subprime loans market has shifted from underserved areas to higher-income metropolitan ar-eas. In fact, subprimes are initially designed to provide credit to lower-income borrowers and to contribute to their development and growth. However, it may be possible that moderate to high income borrowers have substituted conven-tional loans with subprime loans. The main incentive behind it is speculative behaviour and renancing.
3 Impacts of subprime lending on the economy
3.1 Impact on foreclosures
The 2007 subprime mortgage crisis has lead to a large number of delinquencies9
and foreclosures10. More precisely, only months after subprime origination in
2006 and 2007, foreclosures increased drastically. Data compiled by First Ameri-can LoanPerformance (FALP) 2007, show that delinquency rate is not consistent across regions in United States and that the median subprime delinquency rate is 17.4 percent, with a range from about 7 to over 30 percent. Some of the cities that experienced the most severe delinquency rate are Stockton in California, Sacramento, San Diego, San Francisco, Detroit, Indianapolis, Boston, New York and Miami. For example, for the Stockton area in California jumped from about 3.5 percent at the end of 2005 to over 25 percent in 2007. Also, in the Las Vegas and Phoenix areas, subprime delinquency rates reached 17.7 percent and 12.7 percent, respectively, in 2007, compared with 4 percent and 3.6 percent at the end of 2005.
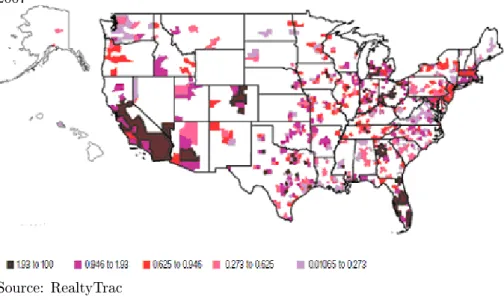
Figure 7: Mortgage foreclosure llings as a percent of households for MSAs, 2007
Source: RealtyTrac
Many factors are relevant in explaining the dierences in subprime delin-quency rates among MSAs such as variation in economic conditions, dierences in the riskiness of borrower, and changes in the house prices. However, the main reason is the sudden and disparate decrease in housing prices across US regions. Moreover, the slowdown of housing prices was accompanied by higher inter-est rates leaving borrowers with no equity to sell their homes and prepay their mortgages. Indeed, the Federal Reserve Board has increased interest rates from
9Denition of delinquency vary , but the one used here denes it as the cumulative fraction of loans that were past due 60 or more days, in foreclosure, real-estate owned, or defaulted, at or before a given age
10Foreclosure is a legal procedure in which a mortgaged property is sold in a legal process to pay the outstanding debt
1% in 2003 to 5.25% in 2006 which led to a faster deterioration of the mortgage market.
Figure 8: House price appreciation and subprime delinquency rates among MSAs
Sources: First American LoanPerformance and Oce of Federal Housing En-terprise Oversight (OFHEO)
Finally, according to Demyanyk and Hemert (2008), loans originated in 2006 and 2007 have a much higher delinquency rate than loans originated in earlier years at the same age even after adjusting for year-by-year dierences in loans (Figure 9).
Figure 9: Actual and adjusted delinquency rate
Source: Demyanyk and Hemert, (2008)
3.2 Impact on nancial institutions
The subprime crisis has so far made losses on nancial institutions that surpass 750 billion dollars as of 2008 based on estimates from Lehman Brothers and
Citigroup (2007). Also, more than 200 bank and mortgage institutions have either closed down operations, or declared bankruptcy.
Losses are mostly prominent among investors holding unrated and lower-rated MBS and CDO equity. These losses have occurred because mortgage borrowers have massively defaulted on their payments. Moreover, the delay be-tween the dierent reactions in the securitization chain has played an important role. Indeed, the foreclosure process takes time to complete and thus principal payments to third party investors' are not immediately aected.
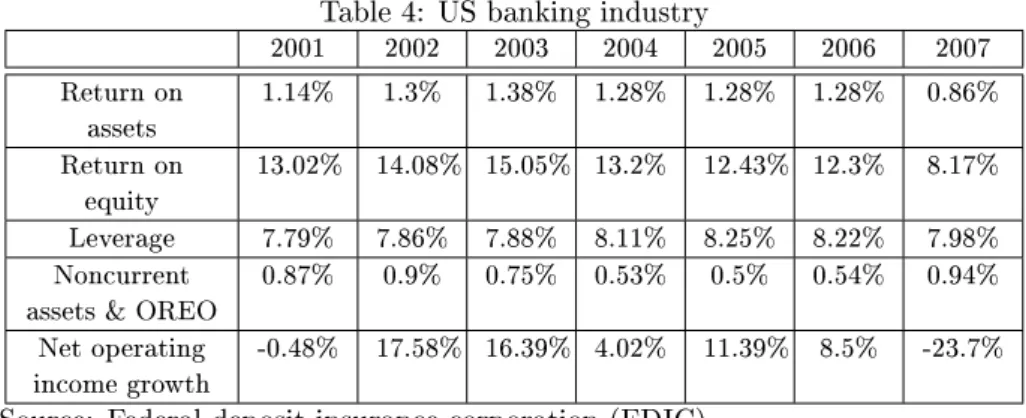
The table 4 shows that the banking industry as a whole has seen a dramatic slowdown in terms of protability and performance. Also, this table shows a rise in non-current assets and other real estate owned (OREO).
Table 4: US banking industry
2001 2002 2003 2004 2005 2006 2007 Return on assets 1.14% 1.3% 1.38% 1.28% 1.28% 1.28% 0.86% Return on equity 13.02% 14.08% 15.05% 13.2% 12.43% 12.3% 8.17% Leverage 7.79% 7.86% 7.88% 8.11% 8.25% 8.22% 7.98% Noncurrent
assets & OREO
0.87% 0.9% 0.75% 0.53% 0.5% 0.54% 0.94% Net operating
income growth
-0.48% 17.58% 16.39% 4.02% 11.39% 8.5% -23.7% Source: Federal deposit insurance corporation (FDIC)
4 Related literature
The literature based on the subprime crisis is quite recent and reviews dierent aspects of the problem. This report will limit itself to a few selected papers and their contributions to the understanding of the crisis. In addition, this report tries to nd a logical link between the selected papers.
Mian and Su (2008) conduct a micro-level analysis across the United States in order to explain the mortgage credit expansion in subprime neighbourhoods. They dene subprime zip codes as zip codes in the lowest quartile in which borrowers have a credit score under 660 as of 1996. On the other hand, they dene prime zip codes as the highest quartile of borrowers with a credit score above 660. According to their hypotheses, the massive growth of mortgages in subprime zip codes in 2002-2005 can be explained by one (or more) of these hypotheses:
1. Improvement of credit worthiness of subprime borrowers 2. Expectation of future house price growth
3. Outward shift in mortgage supply increase.
The rst two hypotheses are not necessary for the purpose of this report, al-though those two conditions are later rejected by the authors. Indeed, the facts established that the income and the mortgage credit growth are negatively cor-related for the years 2002-2005. Also, the growth in credit occurred in very elastic housing supply that are highly unlikely to have large increases in house price growth expectations due to the fact that the quantity of housing stock adjusts quickly to any upward pressure on house prices.
As for the supply-based hypothesis, data from 2002-2005 show strong evi-dence of reduction in denial rates and relaxation in credit rationing constraints on mortgage applications in subprime zip codes. However, neither prime zip codes nor subprime zip codes before 2002 have experienced similar characteris-tics. As a result, the 2002-2005 expansion of mortgage credit mostly occurred in subprime zip codes.
In addition, another important nding of this paper is the 2002 to 2005 increase in the fraction of originated mortgages sold to non-GSE investors. In other words, 2002-2005 reected a massive wave of mortgage securitization that mostly occurred in subprime zip codes. This central breakthrough lead to this conclusion: lenders in subprime zip codes increased their supply of mortgage credit in order to securitize or sell them to other private investors. As a result, subprime zip codes have experienced an expansion in mortgage credit.
Furthermore, some economists believe that an expansion of credit will lead to nancial instability. For instance, Kiyotaki and Moore (1997) argue that the nancial deterioration might occur through the release of credit constraints or Dell'Ariccia and Marquez (2006) argue it might occur through adverse selection. Furthermore, Dell'Ariccia, Igan and Laeven (2009) focuse their research on the expansion in mortgage credit and nd that the rapid expansion in mortgage credit and the changes in the market structure are associated with a decline in lending standards and with excessive risk taking by lenders11 leading to credit
crisis.
11They take denial rates as a proxy for lending standards and loan-to-income ratios for the risk taken
First, they nd that in the subprime market, a strong negative relationship existed between the lending boom and lending standards. Subprime lenders appear to have denied fewer loan applications and to have approved larger loans in areas where the number of loan applications rose faster. In addition, they nd that subprime lenders appeared to have denied fewer loan in areas with a larger number of competitors, and more specically, in areas with a larger number of incumbent nancial institutions. These areas subsequently experienced a sharper increase in delinquency rates.
A major dierence between the prime and subprime market is that in the latter, information about the credit history of borrowers is not publicly avail-able. Thus, under asymmetric information and speculative behaviour, subprime lenders found it more protable to keep originating loans with no screening to the applicants resulting in deterioration in the quality of the pool of applicants. Indeed Fuller and Fuller (2009) believe that asymmetric information and moral hazards were fuelled by mortgage securitization. With securitization, mort-gage lenders have more incentives to increase the amount of credit without too much worrying about the borrower and its risk of default. Thus, banks and mortgage originators have less information about the borrower, about its credit worthiness, the approximate value of the home and other macroeconomic mea-surements since they won't be the ultimate holder of the mortgage. However, third parties and investors have very little information about the underlying individuals and homes in the portfolio of mortgages they have purchased via an MBO.
This is consistent with theories of disintermediation where asymmetric infor-mation among lenders plays an important role in altering the supply of credit, and altering lending standards. Mian and Su (2008) come across similar results suggesting the possibility of moral hazard on behalf of originators selling bad loans to third-party lenders for the purpose of securitization. They nd that the number of mortgages sold for securitization is positively correlated with subsequent increase in default rates.
Likewise, Schloemer, Li, Ernst, and Keest (2006) highlight the eects of subprime mortgages origination on the number of foreclosure lling. The results of this article are signicant due to the large number of observations in the sample that included more than six millions securitized subprime loans from 1998 to 2004.
First, this study reveals that the subprime market inevitably leads to foreclo-sure. Indeed, it stipulates that even under recent favourable economic conditions such as house price appreciation, and good monetary policy, as many as one in eight subprime loans originated between 1998 and 2004 ended in foreclosure within ve years. Also, half of all subprime loans will be delinquent at least once within ve years.
Moreover, one of the most important contribution of this article is that not only does it prove that subprime leads to foreclosure but also asserts that subprime loans are riskier in themselves, regardless of the borrower's credit. Borrowers who are already nancially stressed are receiving loans associated with a higher risk of default. Therefore, even after controlling for dierences in credit scores, subprime mortgages are found to increase the likelihood of default. Some of the subprime characteristics that are adding risk include re-adjustable interest rates, prepayment penalties, balloon payments, low-doc and no-doc loans or the ability to renance out of an unaordable loan.
Furthermore, loose underwriting standards magnied the risk of loans that are already hazardous, and so does predatory lending. In addition, third-party originators such as mortgage brokers, who originated the majority of subprime mortgages, have a strong incentive to close as many loans as possible, but very little reason to consider the loans' future performance. Lenders shielded them-selves from the full potential cost of foreclosures by selling their loans to investors through the secondary mortgage market. And nally, insucient legal and reg-ulatory consequences to lenders emitting home loans that are not appropriate or aordable for the borrowers' situation exacerbated this credit crisis.
5 The empirical analysis
This section is divided into three subsections. First, it explains the purpose and methodology of the analysis as well as denes the empirical model; second, it species the data sources; and nally, it presents results of the regression using feasible generalized least squares.
5.1 Methodology
The purpose of this report is to empirically determine whether the subprime loans played an important role causing the high number of foreclosures that occurred in the United States in 2006 and 2007. More specically, the goal of this report is to test the hypothesis that subprime mortgage expansion is behind the subsequent high default rate and thus is responsible for the crisis. To that extend, related literature have revealed that only a few variables are signicant and, consequently will be tested to see their impact on foreclosures. Also, as explained in Section 2, the eects of mortgage expansion has been very dierent from one region to another. Therefore, it is necessary to focus on micro-level data instead of national data. Indeed, Mian and Su (2008) assert that any such analysis requires micro-level data, (...), the use of more aggregated data can lead to erroneous conclusions. In this report, the variables that are selected are listed at MSA12level (Metropolitan Statistical Area) a core urbanized area
with population density of at least 50,000.
Unfortunately, data on foreclosure are only available for the top 100 MSA, corresponding to the largest urbanised agglomeration among the 363 MSA. Therefore, this paper will have to limit itself to these observations even though more observations or smaller denomination would have been better. Also, due to a lack of publicly available data, the timeframe that is chosen corresponds to the years 2006-2007.
The analysis that is conducted tries to test whether there is a relation be-tween foreclosures and the number of approved subprime. Additionally, other related variables are included to the analysis to verify their relationship with foreclosures. Therefore, the focus will be put upon the coecients' sign rather than their face value to establish the impact on the dependent variable. This paper will test the validity of two primary hypotheses, (1) the subprime param-eter is very signicant and positively related to foreclosures, (2) loan amounts, income measure, and homeownership rates are key factors of the high default rate.
The subprime variable is obtained following a series of meticulous manipula-tion on a huge dataset. The rst step was to gather the complete list of subprime lenders of the Department of Housing and Urban Development (HUD)13. Then,
adding all loans originated by these lenders gives the total subprime loans. In fact, the HUD identies subprime lenders according to the reported spread be-tween mortgage loans and comparable-maturity Treasury for rst-lien and junior liens with a three and ve percentage points over the benchmark respectively. These loans are referred to as higher-priced loans while all other loans are treated as non-subprime.
12Refer to The U.S. Census Bureau 13See appendix 1
Furthermore, the Federal Financial Institutions Examination Council (FFIEC) under the Home Mortgage Disclosure Act (HMDA) requires from all lending in-stitutions located within a MSA and with assets in excess of 30 million dollars to le loan registers providing information on each mortgage loan application. Therefore, by identifying subprime companies and adding all the loans orig-inated by these companies, we can have the closest value to the number of subprime loans in each MSA. Nevertheless, there is potential measurement er-ror due to the omission of smaller lenders that do not report under HMDA and to inability to classify lenders who originate both prime and subprime loans.
The dataset obtained with this manipulation gives information about the purpose of the subprime loan. Subsequently, the analysis will try to evaluate the eect of renancing and home purchasing on foreclosures. However, based on the literature, renancing is expected to cause more foreclosures.
The loan amount gives an estimate about the real estate market in the area and thus indicates the house price change between 2006 and 2007. According to the literature, house prices are an important factor in the subprime mort-gage expansion. In addition, the loan amount is used as a proxy for lending standards indicating that as granted amounts are increasing, the less stringent are the lending standards. Taking all this together, one might expect that as lending standards loosen, mortgages become riskier and thus may lead to more foreclosures.
The income measure used represents the ratio of the median family income in a particular census track compared to the median family income in the MSA where the census track belongs. This variable is considered an indicator of wealth in each census track area, assuming that inhabitant of this area have similar earnings and thus, similar creditworthiness. In other words, this variable tests the eect of income and creditworthiness on foreclosures.
The demographic variable added is the ratio of the average number of owners over the average number of dwellings. This variable refers to the homeowner-ship rate which, as explained in Section 2, experienced a sharp increase after the subprime mortgage expansion. Also, this variable highlights the prevailing economic condition and the inhabitants' preference between being owners versus renters. Therefore, testing this variable allows evaluating the incentive induced by subprime origination.
In order to conrm these assumptions, several regressions will be undertaken and their respecting results will be analysed in the following section.
The regressions are conducted using feasible generalized least squares given the panel-heteroskedastic assumption. Indeed, since the parameters used vary in time and in space, the error term have a high probability to also vary with each observation. Thus, the heteroskedastic assumption is a very realistic one. Similarly, the presence of AR(1) autocorrelation is very likely to occur within panels. Consequently, the estimation with feasible generalized least squares can be more ecient and preferred across panels.
To summarize, this analysis uses a panel model across the 100th largest agglomeration in the United-States for the year 2006 and 2007. The dierent variables that may have an impact on foreclosure are put at test using feasible generalized least squares to correct for the existence of heteroskedasticity. It is expected that subprimes, loan amounts, and homeownership rates are positively correlated with foreclosures. Moreover, income measurement is expected to be negatively correlated. Finally, renancing would be more signicant that home
purchasing.
Therefore, the regressions of interest are:
F ORCL=β1+β2SU B+β3AM T+β4IN C (1)
F ORCL=β1+β2SU B+β3AM T+β4IN C+β5ODW (2)
F ORCL=β1+β2REF IN+β3AM T +β4IN C (3)
F ORCL=β1+β2HOM EP +β3AM T+β4IN C (4)
where
FORCL Number of foreclosure
SUB Number of subprime loan originated AMT Loan Amount
INC Income
ODW Homeownership rate REFIN Renancing subprime HOMEP Home purchasing subprime
5.2 Data and descriptive statistics
The variables that are used in the estimation of foreclosures are extracted from a variety of sources.
First of all, there are only three available sources on subprime mortgages: the Federal Financial Institutions Examination Council (FFIEC), Mortgage Bankers Association (MBA) and private sector data providers such as First American LoanPerformance (LP) or McDash Analytics. The latter two are re-porting subprime loans according to the lender's business if it is predominantly in the subprime category. FFIEC compiles subprime loans in accordance with the Home Mortgage Disclosure Act (HMDA), based on a threshold interest rates charged to the borrowers when the loan was emitted, i.e. higher-priced loans. Unfortunately, MBA only gathers data on a state level basis and LP's data are accessible only to subscribed users. Therefore, the data collected and used in this report are from the FFIEC accessible through the Home Mortgage Disclo-sure Act (HMDA) for the year of 2006 and 2007. The HMDA DiscloDisclo-sure Reports summarize mortgage information from data that are prepared yearly by indi-vidual institutions as well as provide information about indiindi-vidual loan such as the amount borrowed, the number of denied applications, the institutions that gave out the loan, etc...
On the other hand, the FFIEC publishes various nationwide census data based on the U.S. Census Bureau's 2000 census data. Census information used in this report are the number of Owner Occupied Units and the number of 1- to 4-Family units. Finally, FFIEC Census Reports include income estimates
developed by the United States Department of Housing and Urban Development (HUD).
Foreclosure data comes from RealtyTrac and are compiled on a micro-level basis for the largest 100 US MSA. RealtyTrac has been chosen because of its large database covering more than 90 percent of U.S. households' data on foreclo-sures. Also, RealtyTrac is the only online marketplace for foreclosure properties that have its data publicly available. Unfortunately however, a limited number of observations is accessible to the public (100 compared to the 363 existing MSA).
RealtyTrac data comes from their yearly foreclosure reports where they pub-lish the total number of foreclosure lings by metropolitan area. Foreclosure lings include foreclosure-related documents in all three phases of foreclosure: Default, Auction, and Real Estate Owned (REO) properties (that have been foreclosed on and repurchased by a bank).
The household numbers are based on the U.S. Census Bureau's 2005 esti-mates of total housing units.
5.3 Estimations
After reviewing the related literature and explaining the model that will be used in this report, this section lays out the results obtained from the above model, describing their signicance and attempting to explain them. In all the following models, p-values are in parenthesis below the corresponding variable. 5.3.1 Regression 1
F ORCL=−32971
(0.076)+ 0.36(0.SU B00) + 23.(072.121)AM T+ 399(0.79.025)IN C
This is a very basic regression where only the subprime, the loan amount and the income variables are included and tested to evaluate their eect on foreclosure. In the following subsections, the regression will be revised, adding new variables to observe their subsequent eect on foreclosures. The eect of these new variables on the overall regression will also be studied, to hopefully obtain more insightful deductions.
In this rst regression, the subprime coecient and the income coecients obtained are signicant at 0 and 2.5%. Thus, the conduced regression is con-sidered to be ecient. In addition, the coecient of the loan amount variable is signicant at 12%.
Moreover, the variables' coecients are positive, which imply that all three variables are correlated with foreclosure. These results are not surprising since they conrm the review of literature. More particularly, they are in accordance with those of Schloemer, Li, Ernst, and Keest (2006) who assert that subprime loan origination inevitably leads to foreclosure.
Furthermore, with regard to the loan amount variable, the positive relation between the latter and foreclosure indicates that for larger loan amounts the risk of foreclosure is much higher. Thus, it may be that during the analysis' timeframe, the high level of foreclosure llings can be explained by subprime companies giving greater loan amounts to the public. In other words, this re-sult conrms the link between subprime mortgage expansion, decline of lending standards and excessive risk taken by lenders.
Finally, the income measure is also positively correlated with foreclosures. This coecient seems at rst unexpected and contrary to the common belief that poor people are the main agents behind the crisis. However, as mentioned in many papers, riskier strategies and speculative behaviour, and specically renancing, were more prevalent in richer neighbourhoods. This could be a valid explanation for the fact that the higher the income measure, the greater the foreclosures. 5.3.2 Regression 2 F ORCL=−42818 (0.037)− 0.089SU B (0.831) + 23.54AM T (0.123) + 493.68IN C (0.012) + 94.13ODW (0.267)
In this regression, the variable owners over dwellings is added to the model. This variable refers to the homeownership ratio. The main point is to test for the eect of a demographic variable on foreclosure and on the overall model. Also, this new regression aims at examining whether the previous results are still maintained.
Unfortunately, this model is far less signicant than the rst one: the only really signicant coecient is for the income variable and has a p-value of 1.2%. Also, another striking dierence in this model is the sign of the subprime co-ecient, but since the latter is not signicant at all (p-value of 83%) there is no point in explaining the negative correlation with foreclosure. Moreover, the loan amount and the income variables show similar correlation with foreclosure and are more signicant; this observation could suggest that the conformity of the results conrms their respective role in the subsequent crisis.
One nal result to interpret in this regression is the homeownership ratio, which is the number of owners over the overall number of dwellings. The positive sign may lead us to believe that the subprime market created an incentive to people to choose being owners rather than renters.
However, due to the overall signicance of the regression, the results obtained in this model will not be taken into consideration. In addition, in the following regression, the variable owners over dwellings will not be used.
5.3.3 Regression 3 F ORCL=−37180
(0.004)+ 0.076(0REF IN.00) + 22.49(0.AM T14) + 440(0.08.013)IN C
In this regression, subprime loans are substituted with subprime renancing loans. The basic idea is to examine subprime loans by their purpose instead of looking at the total number originated. The rst purpose of loan origination that will be examined is loan renancing; in the following model, the focus will be on home purchasing. Also, as mentioned previously, the variable owners over dwellings will not be included in order to preserve the overall signicance of the model.
The results obtained are signicant and thus the model is considered reliable. Indeed, most of the variables have a p-value below 1%, except the loan amount variable which signicant at 14% (p-value of 14%).
As for the coecients' signs, the loan amount variable and the income vari-able are positively correlated with foreclosure. These results are similar to those of the rst regression and thus validate the analysis and the outcomes.
Finally, the renance variable refers to the number of subprime loans orig-inated for the purpose of cash out. Renancing is in itself a risky behaviour that is associated with a great deal of speculation and thus is more sensitive to minor economic changes. In fact, Schloemer, Li, Ernst, and Keest (2006) refer to renancing as a major component in the subprime mortgage expansion and believe that it exacerbated the credit crisis. Therefore, there is no surprise in nding that renancing and foreclosures are positively correlated.
5.3.4 Regression 4 F ORCL=−30042 (0.1) + 0.66HOM EP (0.001) + 27.01AM T (0.077) + 372.36IN C (0.039)
This last regression focuses on subprime loan originated for home purchasing and tries to relate it to foreclosure. The coecients obtained are signicant at 5% and 8%, and are positively correlated with foreclosures. Therefore, the rela-tion between the explained variable and the explanatory variables is consistent with previous results.
Furthermore, comparing regressions 3 and 4 reveals the eect of dierent loan purposes on the number of foreclosure llings. Indeed the home purchase coecient is 0.66 compared to 0.76 for the renancing coecient. So, as expected, renancing leads to a greater number of foreclosures; more specically, renancing leads to 10% more foreclosures than home purchasing. Surprisingly however, the dierence between the two coecients is not as large as expected.
6 Conclusion
Recently, many studies have focused on the mortgage crisis and tried to com-prehend its origins. Many papers have proposed some potential solutions to prevent the occurrence of similar crisis in the future. This paper's main goal is to link the subprime mortgage expansion to the high default rate observed in the United States. In addition, it tries to nd the relation between foreclosure and some key variables. The analysis covers more than one and a half million subprime loans that have been originated in 2006 and 2007.
This paper provides evidence that the sharp increase in foreclosure llings is associated with subprime loans, loan amounts and income. First, there is evidence that subprime loans are riskier than conventional loans and thus were considerably responsible for foreclosure. More particularly, this paper nds that foreclosure is more sensitive to renancing subprime loans than to home purchase subprime loans. Second, there is evidence consistent with existing work that foreclosure is associated with easing credit standards. Indeed, for greater loan amounts, there are higher levels of foreclosures where loan amounts are used as a proxy for credit standards. Finally, there is evidence that income played a role in worsening the real-estate crisis. It seems that richer neighbourhoods were more involved in risky practices increasing the probability of foreclosure. Moreover, the eect of homeownership on foreclosure is either weak or absent because including this variable reduce the overall signicance of the model. These results seem relevant because they are consistent with related literature. One limitation of this project is that the analysis is limited to only 100 MSA. Also, this study is focused around the years 2006 and 2007. Thus, the results obtained do not cover the whole eect of the subprime mortgage crisis.
References
[1] Chomsisengphet S. and Pennington-Cross A. 2006, The Evolution of the Subprime Mortgage Market, Federal Reserve Bank of St. Louis Review, 88(1), pp. 31-56
[2] Darlin D. 2006, Mortgage Lesson No. 1: Home is Not a Piggy Bank, New York Times
[3] Dell'Ariccia G. and Marquez R. 2006, Lending Booms and Lending Stan-dards, Journal of Finance Vol. 61, Nº 5, 2511-2546
[4] Dell'Ariccia G., Igan D. and Laeven L. 2009, Credit booms and lending standard: evidence from the subprime mortgage market, European Bank-ing Center Discussion Paper No. 200914S
[5] Demyanyk Y. and van Hemert O. 2008, Understanding the Subprime Mortgage Crisis, Federal Reserve Bank of St. Louis, manuscript
[6] Federal Reserve Governor Kroszner R. 2007, The Challenges Facing Sub-prime Mortgage Borrowers, Consumer Bankers Association 2007 Fair Lending Conference, Washington, D.C.
[7] Fuller J. and Fuller G. 2009, The sub-prime mess (What We Should Have Known, or Learned, From Behavioral Economics), Fuller & Thaler Asset Management, Inc.
[8] Furlong F., Takhtamanova Y., Laderman E. and Krainer J. 2007, The Subprime Mortgage Market National and Twelfth District Developments, Federal Reserve Bank of San Francisco, Annual Report
[9] Greenspan A. and Kennedy J. 2005, Estimates of Home Mortgage Origina-tions, Repayments, and Debt on One-to-Four-Family Residences, Finance and Economics Discussion Series Divisions of Research & Statistics and Monetary Aairs Federal Reserve Board, Paper No. 2005-41 p. 21
[10] Inside Mortgage Finance 2006, The 2006 Mortgage Market Statistical An-nual, Bethesda, MD, Inside Mortgage Finance Publications, Inc.
[11] Inside Mortgage Finance 2004, The 2004 Mortgage Market Statistical An-nual. Washington, DC, Inside Mortgage Finance Publications, Inc. [12] Keys B., Mukherjee T., Seru A. and Vig V. 2008, Did Securitization Lead
to Lax Screening? Evidence From Subprime Loans, EFA 2008 Athens Meetings Paper
[13] Ki J. and Mills P. 2007, Money for Nothing and Checks for Free: Recent Developments in U.S. Subprime Mortgage Markets International Mone-tary Fund, working paper
[14] Kiyotaki N. and Moore J. 1997, Credit Cycles Journal of Political Econ-omy, volume 105, issue 2 pp 211-48.
[15] Mayer C. and Pence K. 2008, Subprime Mortgages: What, Where, and to Whom?, Finance and Economics Discussion Series Divisions of Research & Statistics and Monetary Aairs Federal Reserve Board, Paper No. 2008-29
[16] Mian A. and Su R. 2008, The Consequences of Mortgage Credit Expan-sion: Evidence from the U.S. Mortgage Default Crisis, Working Paper University of Chicago
[17] Minczeski P. and Taylor B. 2007, where subprime delinquencies are getting worse the wall street journal, online edition issue of March 29, 2007. [18] Schloemer E., Li W., Ernst K. and Keest K. 2006, Losing ground:
fore-closures in the subprime market and their cost to homeowners, Center for Responsible Lending
[19] Whalen R. 2008, The Subprime Crisis Cause, Eect and Consequences, Network nancial institute at Indiana State University. Policy Brief No. 2008-PB-04
Data Sources
Census Bureau
Department of Housing and Urban Development (HUD) Federal Financial Institutions Examination Council (FFIEC) Home Mortgage Disclosure Act (HMDA)
RealtyTrac
First American LoanPerformance (FALP)
Internet sources
Dominion Bond Rating Service, (DBRS) Federal deposit insurance corporation (FDIC) Federal housing nance agency
Federal Reserve Board
First American LoanPerformance (FALP) Freddie Mac
Lehman Brothers and Citigroup (2007)
Table A.1: List of subprime lenders
AAMES FUNDING CORPORATION HOMELAND MORTGAGE COMPANY ACCREDITED HOME LENDERS, INC HOMEOWNERS LOAN CORPORATION
ACOUSTIC HOME LOANS, LLC HSBC MORTGAGE SERVICES, INC. ACT LENDING CORPORATION IMPAC FUNDING CORP ADVANCED FINANCIAL SERVICES IN INVESTAID CORPORATION
ADVANTIX LENDING, INC. JLM DIRECT FUNDING LTD ADVENT MORTGAGE, LLC KELLNER MORTGAGE INVESTMENTS AEGIS LENDING CORPORATION LANCASTER MORTGAGE BANKERS
AIG FEDERAL SAVINGS BANK LENDERS DIRECT CAPITAL CORP ALLIANCE MORTGAGE BANKING CORP LENDMARK FINANCIAL SERVICES
ALLIED MORTGAGE & FINANCIAL CO LENDSOURCE INC
ALTERNATIVE FINANCING COP LIBERTY AMERICAN MORTGAGE CORP AMC MORTGAGE SERVICES, INC. LIME FINANCIAL SERVICES, LTD. AMERICAN BENEFIT MORTGAGE, INC LOAN CENTER OF CALIFORNIA, INC
AMERICAN EQUITY MORTGAGE, INC. LONG BEACH MORTGAGE CO. AMERICAN GENERAL HOME EQU.(DE) M&I BANK FSB
AMERICAN HOME EQUITY MARIBELLA MORTGAGE, LLC. AMERICAN HOME LOANS MASTER FINANCIAL, INC. AMERICAN PIONEER FINANCIAL SVC MBNA AMERICA (DELAWARE), N.A.
AMERICAP FINANCIAL INC MERITLENDING.COM AMERIQUEST MORTGAGE COMPANY MILA, INC. AMERITRUST MORTGAGE COMPANY LLC MLSG, INC.
ARGENT MORTGAGE COMPANY LLC MONEY CORP (FN) ASSOCIATES INT'L HOLDING CORP MONEYONE, INC
BERGIN FINANCIAL, INC. MOREQUITY, INC. (NV) BRIDGE CAPITAL CORPORATION MORTGAGE LENDERS NETWORK USA
BUDGET FINANCE COMPANY NATION ONE MORTGAGE CO., INC. BUDGET MORTGAGE BANKERS NATIONSFIRST LENDING, INC
CALUSA INVESTMENTS, L.L.C. NEW CENTURY MORTGAGE CORP CASA BLANCA MORTGAGE, INC NEW DAY FINANCIAL, LLC CENTEX HOME EQUITY COMPANY LLC NOVASTAR HOME MORTGAGE, INC.
CHAPEL MORTGAGE NOVASTAR MORTGAGE, INC. CHOICE CAPITAL FUNDING NPB MORTGAGE, LLC CITICORP TRUST BANK, FSB OAK STREET MORTGAGE
CITIFINANCIAL COMPANY OAK STREET MORTGAGE/GW CITIFINANCIAL EQUITY SERVICES OCEAN BANK FSB
CITIFINANCIAL SERVICES, INC. OPTION ONE MORTGAGE CORP CITIFINANCIAL, INC. OPUS HOME EQUITY SERVICES, INC COLUMBIA MORTGAGE & FUNDING CO OWNIT MORTGAGE SOLUTIONS, INC CONCORDE ACCEPTANCE CORPORATION PEMM.TEK MORTGAGE SERVICES
CORESTAR FINANCIAL GROUP PEOPLE'S CHOICE FINANCIAL CORP CORINTHIAN MORTGAGE CORP PINNACLE DIRECT FUNDING CORP COURTESY MORTGAGE COMPANY PLATINUM CAPITAL GROUP
DELTA FUNDING CORPORATION POPULAR FINANCE, INC. DOLLAR MORTGAGE CORPORATION PREMIUM CAPITAL FUNDING
EASTERN SAVINGS BANK RESMAE MORTGAGE CORPORATION EHOMECREDIT CORP RIGHT AWAY MORTGAGE, INC EMPIRE MORTGAGE CORPORATION SAXON MORTGAGE
ENCORE CREDIT CORP SEBRING CAPITAL PARTNERS, L.P. EQUIFIRST CORPORATION SECURED FUNDING
EQUITY ONE, INC. SELECT MORTGAGE GROUP, LTD. EQUITY RESOURCES, INC. SOUTHSTAR FUNDING
EVABANK SPECTRUM FUNDING CORPORATION EVERGREEN LENDING, INC. SPRINT FUNDING CORPORATION EXPRESS CAPITAL LENDING STERLING MORTGAGE & INVESTMENT
FICORE FUNDING, INC. STEWARD FINANCIAL, INC FIELDSTONE MORTGAGE COMPANY SUMMIT MORTGAGE
FIRST CHOICE FUNDING SUNSET DIRECT LENDING FIRST CONSOLIDATED MORTGAGE TALBOT STATE BANK
FIRST CONTINENTAL MORTGAGE THE CIT GROUP/CONSUMER FINANCE FIRST GREENSBORO HOME EQUITY THE LENDING CONNECTION, INC FIRST NATIONAL BANK OF AMERICA THE MORTGAGE OUTLET
FIRST NLC FINANCIAL SERVICES THE MORTGAGE OUTLET, INC. FIRST STATE MORTGAGE CORPORATION TOWN & COUNTRY CREDIT CORP
FIRST STREET FINANCIAL, INC. UNIMORTGAGE LLC FLEXPOINT FUNDING CORPORATION UNION FEDERAL SAVINGS BANK
FREMONT INVESTMENT & LOAN UNITED MIDWEST SAVINGS BANK GMFS, LLC UNITED-BILT HOMES, INC. HAMILTON MORTGAGE COMPANY WALTER MORTGAGE COMPANY HARBORSIDE FINANCIAL NETWORK WELLS FARGO FIN'L, INC HARBOURTON MORTGAGE INVESTMENT WILMINGTON FINANCE, INC. HOME LOAN MORTGAGE CORPORATION WMC MORTGAGE CORP.