Research Article
Spatial Planning of Electric Vehicle Infrastructure for
Belo Horizonte, Brazil
Evaldo Costa ,
1,2Arthur Paiva,
3Julia Seixas,
4Gustavo Costa,
5Patr
-
cia Baptista ,
6and Brian Ó. Gallachóir
71The Environmental Research Institute, University College Cork, Ireland
2Faculty of Science and Technology, Nova University of Lisbon, Caparica, Portugal
3Department of Cartographic Engineering, University of the State of Rio de Janeiro, Rio de Janeiro, Brazil
4Center for Environmental and Sustainability Research, Faculty of Science and Technology, Nova University of Lisbon,
Caparica, Portugal
5Engineering Department, Military Engineering Institute (IME), Rio de Janeiro, Brazil
6Center for Innovation, Faculty of Science and Technology, Instituto Superior T´ecnico, University of Lisbon, Lisbon, Portugal
7Energy Policy and Modeling Group School of Engineering, University College Cork (UCC), Ireland
Correspondence should be addressed to Evaldo Costa; Evaldo.Costa@vub.be
Received 6 August 2018; Revised 29 October 2018; Accepted 26 November 2018; Published 19 December 2018
Academic Editor: Eneko Osaba
Copyright © 2018 Evaldo Costa et al. This is an open access article distributed under the Creative Commons Attribution License, which permits unrestricted use, distribution, and reproduction in any medium, provided the original work is properly cited. In pursuit of a more sustainable transportation system, electric vehicles (EVs) have the potential to play a fundamental role due to their improved efficiency and lower emissions. The absence of an adequate electric vehicle supply equipment (EVSE) network has been one of the major obstacles for the mass adoption of EV, in large municipalities of developing countries. This is the case in Belo Horizonte (BH), Brazil, which also has a high motorization rate (7 light-duty vehicles per 10 inhabitants). The purpose of this study is to measure and identify the optimal locations for EVSE according to selected criteria to meet the needs of light-duty electric vehicles (LDEV) corresponding to a penetration of 1% by 2025 in the municipality of BH. The study highlights the most important attributes that need to be considered for the installation of an EVSE network in an urban space for a developing country. Multi-Criteria Decision Making (MCDM), the Weighted Linear Combination (WLC) method, and the Analytical Hierarchy Process (AHP) technique based on the inputs from a group of Brazilian electrical mobility specialists, coupled with a Geographic Information System (GIS) modeling tool, were used for this study. The results revealed that around 1,200 EVSE units are needed, with a large concentration of EVSE in a small region. We also illustrate where stakeholders should focus their attention for the successful promotion of EV. The development methodology has the potential to be applied in other future EVSE development projects.
1. Introduction
There is a large mobility demand in urban centers. These urban centers hold about 80% of global Gross Domestic Product (GDP) and account for two-thirds of all primary
energy consumption and 70% of carbon dioxide (CO2)
emissions [1, 2]. Global transport is responsible for almost a quarter of energy-related emissions [1, 2]. In Brazil, more than 32% of final energy consumption is from the transport sector with road transportation accounting for more than 92% of this amount [3]. Ethanol has an important role for low carbon transportation in Brazil. A Comparative Life Cycle Assessment (LCA) study shows that when replacing gasoline
with ethanol fuels, Greenhouse Gas (GHG) emissions can decrease by around 81% [4]. On the other hand, several studies highlight that the agricultural process for producing ethanol can be responsible for considerable problems such as ecotoxicity, soil acidification, and human toxicity among others [5, 6]. Some even studies that identify benefits in the production of ethanol also highlight the negative
envi-ronmental impacts [7]. Other studies suggest that the
competition from the production of ethanol with food is another substantial problem [8–10].
Replacing internal combustion engines (ICE) with EV charged with clean energy has the potential to further reduce
Volume 2018, Article ID 8923245, 16 pages https://doi.org/10.1155/2018/8923245
CO2emissions [11–17]. This makes EVs a more appropriate option for urban space [18].
A study for Sao Paulo (with adopted emissions by car of
220 gCO2/km) revealed that EV could reduce around 11,0
TgCO2, if 20% of its fleet of gasoline cars is replaced by
2030 [19]. This is equivalent to removing the emissions of about 140,000 medium gasoline-powered cars in one year when considering an LCA methodology—European study
indicates emissions of 250 gCO2/ km [20]. Therefore, the EV
can eliminate the emission of local pollutants (namely, HC, CO, NOx, and PM) and significantly contribute to reducing energy consumption and the mitigation of climate change, especially when the electricity is produced from a renewable energy mix [21, 22].
Emissions from the transport sector have grown 2.5% annually between 2010 and 2015; however, OECD (Organiza-tion for Economic Coopera(Organiza-tion and Development) countries aim to reduce emissions by 2.1% annually between 2015 and 2025 [1, 2]. The development of EV technology and corresponding recharging infrastructure can be one potential way to reduce emissions as well as increase energy efficiency [23].
However, the lack of expansion of suitable electric vehicle supply equipment (EVSE) networks provides a barrier for EV, e.g. range anxiety effect (the drivers fear that the electric vehicle will not have enough range to reach its destination) [24], even though features such as Safe-Range-Inventory (SRI) is capable of overcoming the obstacle of range anxiety. In some developing countries, other problems also need to be considered when planning for the development of EVSE. These include greater social inequality, public security prob-lems, and lack of logistic support, as developing countries also do not have the same level of experience when compared to developed countries. China is the only developing country that is prioritizing EV. However, this Asian country may not be a good benchmark, since China and Brazil have different public safety standards; i.e., there is no significant record of vandalism in Chinese EVSE.
Consequently, the aim of this study is to measure and identify the optimal locations for the installation for EVSE in the municipality of Belo Horizonte (BH), Brazil, to meet a penetration of 1% of light-duty electric vehicles (LDEV) by 2025. This study answers the following questions: (i) what attributes should be highlighted for the installation of an EVSE network in urban areas in developing countries with substantial risk areas? And (ii) where is the optimal location for a network of EVSE network in the municipality of Belo Horizonte?
The literature review is presented in the next section. The third section is dedicated to the methodology, the fourth section presents the results, the fifth section presents the discussion, and the sixth section presents the conclusions, limitations, and suggestions for upcoming studies.
2. Literature Review
2.1. Characterization of the Studied Region. A large share of the total GHG emissions in Minas Gerais (MG), whose capital is BH, is due to transportation activities. It ranks second in all
of Brazil’s 26 states for GHG emissions. The transport sector is responsible for around 36% of the state’s total emissions with the road transport sector accounting for more than 96% of these emissions [25].
The estimated population in BH is around 2.5 million inhabitants, the highest population density in the MG state. The municipality of BH has 17% of the total road fleet in the state of MG which is estimated to be 1.8 million units—70% of these are light-duty vehicles (LDV).
BH is divided into 9 administrative regions, 8 districts, and 487 neighborhoods [26]. Some of BH neighborhoods, such as Sion, Lourdes, and Belvedere, have a significant population concentration with an average household income higher than US $ 2.2 thousand monthly. The income square meter price in the area is higher than the average within the BH municipality [27].
Other neighborhoods such as Savassi, Santo Agostinho, and Funcion´arios have a high population concentration. The BH South-Central region (Figure 1) is characterized as a metropolitan center with a diversity large quantity of services and a concentration of economic activity [28].
From an environmental and energy point of view, BH reveals a favorable potential for the expansion of electric mobility since Brazil has a predominantly clean energy mix. In 2016, almost half the energy consumed in Brazil was from renewable sources [29]. The Brazilian electricity matrix uses 82% of renewables, due to hydroelectric generation that accounts for 68% of the total electric generation [29]. The use of renewable energy in recharging of EV is crucial to
guarantee a reduction in CO2life-cycle emissions.
On the other hand, there are some challenges that need to be overcome in the case of large-scale implementation of an EVSE network in Brazil’s urban areas. These include irregular urbanization with large areas of subnormal agglomerates (cluttered and dense poor settlements, most lacking basic urban utilities and essential services). Often it is necessary to cross-areas of irregular urbanization to have access to airports, railway stations, bus terminals, highways, financial zones of the city, and upper middle class neighborhoods.
In 2010, Brazil registered more than 6,300 subnormal agglomerates—with more than 50% of them in the Southeast of the country—containing around 1.6 million households and a population of around 5.5 million inhabitants [30]. These areas are often associated with urban violence, due to the difficulties in accessing essential public services in these regions.
In BH, the situation is not different; in 2009, there were more than 364,000 living in subnormal agglomerates, corresponding to 23% of the population and 10% of the territory of the municipality [31]. Areas of geological hazards and areas subject to flooding should also receive special attention. BH experiences recurrent floods, mainly in the regions of the municipality involving the basins of the Arruda
(South andSouth-Central) and Onc¸a (North) due to problems
involving irregular soil patterns and steep relief [32].
2.2. Electric Vehicle Penetration. Due partially to public policy support in some nations, the global number of EVs has almost doubled every year since 2010. In 2016, there
N 609000.00 612000.00 615000.00 1:50.000 7797000.00 7794000.00 7791000.00 7797000.00 7794000.00 7791000.00 609000.00 612000.00 615000.00
Santo Agostinho Lourdes
Savassi
Funcion;́rios
km
1 0 1 2 3 4 5
Administrative Regions
SOUTH CENTRAL REGION Administrative Regions Neighborhoods Funcion;́rios Lourdes Santo Agostinho Savassi Neighborhoods Belo Horizonte
Figure 1: South-Central region of the municipality of Belo Horizonte.
were 2 million EVs worldwide, with more than 750,000 EVs sold in the same year. In addition, there are more than 200 million two-wheeled EVs and 345,000 electric buses mainly concentrated in the Chinese market. This highlights the increase of EV penetration that can occur over a relatively short period of time; as in 2005, there were only a few hundred EVs [1, 2]. A global goal of 100 million electric cars and 400 million electric 2- and 3-wheelers by 2030 was defined in the Paris Declaration on Electro-Mobility and Climate Change and Call to Action [33].
Restrictive policies on the use of ICE vehicles adopted by some countries may favor the penetration of EV. Some European countries, for example, are already restricting the circulation of ICE vehicles in some areas and allowing access only to low emission vehicles such as EV [34]. Europe has set a goal of reducing transport emissions by 20% by 2030 and by 70% in 2050 compared to 2008 levels [34]. In Brazil, electric mobility is beginning to develop but the number of EVs is still insignificant. From 2011 to 2016, around 3,500 units of LDEV (most of them for demonstration purposes) have been
licensed in the country (in this period BH does not have any EV registered), while in this period more than 15.3 million LDV (ethanol, gasoline, and fuel flex) have been licensed in Brazil [35].
2.3. Importance of EVSE for the Success of EV. In 2016, the EVSE infrastructure grew substantially and reached around 2.3 million charging points globally. However, most EV drivers depend on public charging points to recharge their vehicles [1, 2]. The lack of charge points near the place of residence, roads, and workplace is a potential barrier to EV market penetration due to the range anxiety barrier [36]. The EVSE network must be adequately planned considering both volume and location [37].
The characteristics of the EVSE, especially those related to the charging level, are relevant for the creation of an infras-tructure network. The EVSE levels (Table A2) considered in this study are as follows[38, 39]:
(i) EVSE L1 (level 1) is equivalent to a slow recharging station corresponding to 8 h or more for a full charge
Table 1: Attributes used in similar studies (√– presence). Attributes∗/ Authors
(See explanation in Supplement 1) (1) (2) (3) (4) (5)
(6)
This study
(1:9) Selective attributes-SA (1Socio-economic-SE;2Socio-demographic-SD;3Geographic-G)
1. Inc: Household income (SE)1 √ √ √ √ √ √
2. Dens: Population density (SD)2 √ √ √ √ √ √
3. PTran: Public transp. Connection (G)3 √ √ √ √ √
4. PShop: Shopping centers (G)3 √ √ √ √ √ √
5. Dcia: Workplace (G)3 √ √ √ √ √ √
6. PPP: Roads, corridors and avenues (G)3 √ √ √ √ √
7. PGeo: Geohazard (G)3 √ √
8. PWat: Flooding areas (G)3 √
9. Slop: Slopes (G)3 √ √ (10:12) Restrictive attributes – RA 10. Green areas √ √ √ √ 11. Water bodies √ √ √ 12. Subnormal agglomerates √ (1): [50–58] (2): [43, 54, 56] (3): [57, 59, 60] (4): [54, 57, 59] (5): [43, 55, 57, 61]
∗Contemplated by other studies.
[40, 41]. It is recommended for the area where the driver lives.
(ii) EVSE L2 (level 2) corresponds to the fast charging station accounting for 3 h to 8 h for a full charge [40, 41]. It is recommended for workplaces, public transportation connection areas, and shopping cen-ters.
(iii) EVSE L3 (level 3) is characterized by super-fast recharge of up to 30 minutes for a full charge [40, 41]. It is recommended for shopping malls, roads, corridors and main avenues.
The optimization of public and private investments in the expansion of EVSE requires research in order to gain knowl-edge on the main attributes capable of calibrating the supply versus demand equation [42]. These attributes include the availability of garages in residential areas, points of public transport connections, high traffic roads, shopping centers, large parking lots, and other areas with a considerable concentration of vehicles. In addition, another important factor is the EV range, which continues to improve. For example, in 2011, only three models of pure EV were available for the mass-market in the USA, with a range between 100 and 150 kilometers. In 2017, 15 pure EV models were available in the USA, with a minimum range of 92 kilometers for the Smart Fortwo Electric Drive Coupe model and a maximum range of 540 kilometers for the Tesla Model S 100D [41].
Additionally, the availability of physical space to install EVSE must also be accounted for, as well as the impact on the
electricity generation network [43–47], the general attitude towards EV [44], and consumer attitude [48] and psycholog-ical aspects [49] as well. The installation of an EVSE network should include technical and geographic resources in order to meet consumer’s expectations of charging the vehicle’s battery in the least amount of time and with short displacements [43], thus avoiding unnecessary energy consumption.
Among the most important innovations pointed out by the research are the areas of restriction since they are signif-icantly important in projects that contemplate the develop-ment of EV infrastructure. A detailed literature review reveals the main attributes for the expansion of the EVSE network in urban areas, as shown in Table 1.
3. Materials and Methods
The study is divided into two parts. The first focuses on establishing the methods, defining geographic criteria, iden-tifying the demand, and completing a survey with specialists. The second part of the study aims at parameterizing and processing the data in the GIS tool.
3.1. Method Definition. GIS was used because it is a spatial information system capable of processing different types of data and accurately indicating the desired spatial location. Similarly to other studies (Church 2002), GIS was used to carry out this study and to manage geospatial data analysis supporting the criteria and indicators for the optimal location on EVSE [67]. Furthermore, the Multi-Criteria Decision
Making (MCDM) method for locating EVSE is important and requires maximum assertiveness [68], as facilities of this type are meant to endure for large periods (i.e., decades).
In the context of applying the MCDM, a multidisciplinary group of specialists were invited to evaluate—through the assignment of the importance of different attributes—the best location for the EVSE network. The MCDM allows the consistent analysis of different quantitative and qualitative elements in a decision-making process. The MCDM method has been widely used for decision-making processes applied to the environment, energy, business, and infrastructure for EV [42, 69–71]. Additionally, MCDM was considered adequate for this study, since Brazil is an incipient EV market, with the additional problem of the limitation and complexity of the available processing data [72], justifying the use of MCDM for the localization of infrastructure for electric vehicles.
The Weighted Linear Combination (WLC) method was applied, as it is an analytical method for dealing with mul-tiattributes or when more than one attribute must be taken into consideration. The WLC method has been largely used in similar studies [73, 74]. Due to the complexity of the problem, the Analytical Hierarchy Process (AHP) was also considered. AHP helps to solve problems using a comprehensive and rational procedure. The AHP technique is also widely used in studies linked to geographic analysis [73–75].
3.2. Territorial Divisional. The geographical area considered was based on the territorial division of the municipality BH, based on the Brazilian Constitution of 1988 and the Brazilian Institute of Geography and Statistics or IBGE (Portuguese: Instituto Brasileiro de Geografia e Estat´ıstica). It considers 487 neighborhoods [26, 63].
3.3. Demand Identification. The demand identified in this study corresponds to an estimated LDEV penetration of 1% in BH by 2025. This estimate was based on a report on energy demand for the Brazilian automotive sector [29]. This is a conservative scenario; however it is justified as after more than half a decade of EV availability, which is comparable with the market share of less than 1% in most countries [1, 2]. Among developing countries, only China shows a high EV penetration; nevertheless, the EV market penetration in 2016 was only around 1% [1, 2]. In Brazil, the rate of EV expansion may be affected by the lack of public policies for electric mobility development and the existing governmental ethanol protection policy.
In the absence of a reference for the ideal number of EVSE, as well as the ideal ratio between EVSE level 2 (L2) and EVSE level 3 (L3), the experience of other urban regions was used as a reference. We defined the proportion of one EVSE for each ten electric vehicles for use in this study. This is comparable to a case study of the main Chinese cities that have the same target [39]. Regarding the EVSE by level—(L2) and (L3)—the proportion of 80% for EVSE L2 and 20% for EVSE L3 was used. This was based on the average number of EVSE for sixteen countries that have a more intensive electric
mobility use [21, 22, 29, 33]. This study also considers that each EV owner has a home charger (EVSE L1).
3.4. Survey to Specialists. The electrified mobility is in very incipient phase in Brazil. There are a limited number of experts in the country. To identify specialists in this topic, we made email and phone contact was made with Brazil electric vehicles associations, car manufacturing association, car dealers federation, automakers, car dealerships, suppliers of EV equipment, union of taxi companies working in EV test projects, specialized media, and research by Internet.
After preparing a list containing the names of the spe-cialists, we sent 67-approach email to clarify the research and invite them to participate by answering a questionnaire that would be sent later.
The main attributes identified based on the literature review (Table 1) used to create the questionnaire that was classified into three groups: economic, sociodemographic, and geographic. Before submitting the questionnaire, we carried out a 40-day trial with a group of 17 people formed by researchers and friends linked to the automotive sector. The test proved to be valuable in adjusting some issues.
The survey was conducted by email from 09/05/2016 to 10/09/2016, and the sample covered 51 specialists with an interest in electric mobility.
The survey targeted EVSE L2 and EVSE L3, and spe-cialists were required to assign a value for each attribute, according to the criteria explained in the introduction of each question. The comparison between two elements using AHP can be performed in different ways [76]. However, the scale of relative importance between two alternatives proposed by Saaty [77] is the most widely used. Therefore, the specialists assigned values from 1 to 9 for each attribute, where 1 meant that the attribute had no importance to the location of the EVSE and 9 was linked to highest importance. The questionnaire had ten questions with one space for the respondent to identify new attributes.
Although the number of respondents was not
expressive, it does not compromise the study’s results, because the specialists limited themselves to evaluating the attributes—elements of greater relevance—that were identified in publications covering studies and experiences with EVSE implementation in other countries. Most of the respondents were in executive direction (57%), worked in the private sector (79%), in the automotive industry (37%), and lived in Southeast Brazil, as shown in Table 2.
3.5. GIS Analyses. The use of the GIS tool can be considered as the backbone of the study. It is composed of three steps: preprocessing, processing, and generation of maps, as described in the next sections.
3.5.1. First Processing Step. The first stage of the GIS analysis called preprocessing was divided into two phases. The first one focused on creating parameters and obtaining and preparing the processing data and the second phase on
management of the attributes.(i)Preprocessing and
Table 2: Survey characterization.
% of the total respondents Job position
Top management and advice 14
Executive Direction 57
Operational management and consultant 29 Sector
Private 79
Public 7
Third sector (NGO) 14
Segment Automobile industry 37 Transport-related services 21 Service provider 21 Government 7 Energy sector 14 Region South 21 Southeast 72 North 0 Northeast 7
Table 3: Data source of the attributes in vector format. Vector format
Source Attributes Source
[62] Slopes Household income [63]
Public transportation connections Population density [63] Roads, corridors and avenues Shopping Centers
Desk research
[64] Green areas Workplaces
Water bodies Geohazards [65]
Subnormal agglomerates Flooding areas [65]
order to structure and parameterize the study. The attributes were established in vector format, as presented in Table 3.
In the evaluation of the spatial analysis and location of EVSE, operational characteristics for the different levels of EVSE were considered:
(i) EVSE L1: the attributes considered were household income (equivalent to US $ 2.2 thousand or higher) and population density of people aged 18 years or older (Table 1).
(ii) EVSE L2: it is suitable to be located near shopping centers, workplaces, or public transportation connec-tions with parking lots with a minimum of 50 parking spaces, among other attributes shown in Table 1. (iii) EVSE L3: the places with the greatest potential for
installation are roads, shopping centers, and public transportation connections among other attributes revealed in Table 1. The attributes were grouped and processed according to the EVSE levels (L1, L2, and L3), as shown in Table 4.
The Euclidean distance was adopted and defined as a group-ing from the delimitation of the average distance between the attributes, i.e., if the average distance between shopping malls is 20 km, 10 km is considered to be the maximum radius
Table 4: Attributes considered in the survey (✓presence,∗benefit).
Class Attributes L1 L2 L3 Ben∗ Inc ✓ ✓ ✓ Ben∗ Dens ✓ ✓ ✓ Ben∗ PTra ✓ ✓ Ben∗ PShop ✓ ✓ Ben∗ Dcia ✓ ✓ Ben∗ PPP ✓ ✓ Cost PGeo ✓ ✓ Cost PWat ✓ ✓ Cost Slop ✓ ✓ Rest Rest ✓ ✓ ✓ Rest Rest ✓ ✓ ✓ Rest Rest ✓ ✓ ✓
(limited to 30 km) from each shopping mall in which the EVSE should be installed. The attributes are standardized by the minimum and maximum values of classification. The Boolean method was applied and consists of the logical com-bination of binary values, where each attribute was evaluated and standardized at “0” as an unsatisfactory hypothesis and “1” as a satisfactory hypothesis [3].
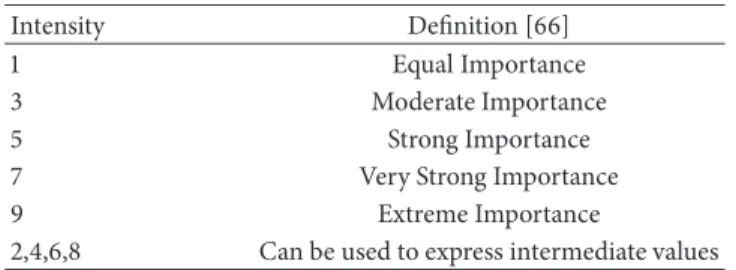
Table 5: AHP analysis criterion. Intensity Definition [66]
1 Equal Importance
3 Moderate Importance
5 Strong Importance
7 Very Strong Importance
9 Extreme Importance
2,4,6,8 Can be used to express intermediate values
Spatial inference is a step in the MCDM that aims to integrate the data involved. For this, we perform the standard-ization of attributes (Table 3) into two categories: benefits and cost [78]. From the distance condition of the attributes, the benefits criteria are the maximization indicators whose values are always higher (value 1). The cost criteria are related to distance minimization (value 0).
(ii) Management of attributes defines the importance of each attribute from the peer-to-peer comparison between attributes.
The AHP that is created under MCDM is composed of techniques that are suitable for ranking of critical manage-ment problems. The AHP is a ranking process that is used in making group decision and is widely used around the world in a variety of fields.
Through the AHP process and the multicriteria decision-making technique, the quantitative and qualitative aspects were combined generating weights for the attributes [79] that were compared in pairs from an importance definition scale in relation to EVSE installation [80]. The weights of comparison respected the scale of Saaty, as shown in Table 5. The weights of the attributes were determined in four stages and the AHP technique was performed using the Easy AHP tool integrated with the QGIS software [81]:
(i) 1st Stage. Establishing the hierarchical structure of the factors influence.
(ii) 2nd Stage. Assembling the judgment matrix, based on the AHP technique consisting of comparative notes between the attributes (from 1 to 9) indicated by the experts.
(iii) 3rd Stage. Determining the uniformity of the matrix
applied to the normalization process. The eigenvector𝜆max
(the highest value of the matrix) was adopted in order to verify the consistency index (CI), the judgment, and consis-tency ratio (CR), thus indicating the degree of randomness of the matrix [82] and checking the consistency of decisions, as shown in (1) and Table 6:
𝐶𝐼 = (𝜆m´ax− 𝑛) (𝑛 − 1) and𝐶𝑅 = 𝐶𝐼 𝑅𝐼 (1) where
CI is the Consistency Index,
Λmax is the highest matched array value,
CR is the consistency ratio, N is the number of attributes, RI is the Random Index.
Although there are cases in the literature that consider CR
>0.1 because of the low knowledge of the parameters [83], in
this project we consider that the RC reached the conditions of execution of the model, since only about 12% of cases CR was
>0.1 provoking a rediscussion of the project with the experts.
(iv) 4th Stage. Determination and analysis of the weights that are the basis for the MCDM method of linear combination weighted, according to the scenarios modeling:
(a) Modeling for the L1 Scenario. For the L1 scenario, since these two attributes have the same degree of importance, a comparative matrix was not required. To refine the model results, a spatial grouping of the average income data by households was applied, considering only the regions with a minimum of 40 households (respecting the principle of equal US $ 2.2 or higher) and people 18 years old or older.
(b) Modeling for the L2 Scenario. In the L2 scenario, all attributes were confronted and judged according to the degree of inherent importance. Attributes shopping and workplace were characterized as strong and very strong importance. Table 7 shows the application of the weights according to the AHP technique.
(c) Modeling for the L3 Scenario. To ensure the consistency of the judgments and the degree of randomness of the matrix,
the eigenvalue𝜆max (9.57) and the CI (0.072) and CR (0.05)
indexes were calculated. Then, the value of the weights for each attribute was determined in order to meet the WLC method.
In the modeling for EVSE L3, the roads, avenues and cor-ridors, shopping centers, and public transportation connec-tion were characterized as strong and very strong importance. Table 8 shows the importance levels for the L3 scenario. The matrix was consistent and with a low degree of randomness,
with the following values being reached: Λmax (9.24), CI
(0.031), and CR (0.021).
3.5.2. Second Processing Step. The weights for each attribute in the model were applied according to the given scenario. The WLC method was used in the linear combination of the weights generated by the comparison matrix in each attribute [84] and considering the three steps:
(i) Weight Application. The WLC method was adopted for linear combination and matrix application.
The WLC approach is a widely used GIS-based decision rule technique [85]. Its most common applications are land use analysis, site matching and selection, and resource assess-ment [60]. In this work, the WLC method is impleassess-mented in the GIS environment with the support of the reclassification and map algebra tools. The AHP technique provided the weights of the attributes and the WLC performed the weights
Table 6: Number of attributes and random index.
N 2 3 4 5 6 7 8 9 10
RI 0 0.58 0.9 1.12 1.24 1.32 1.41 1.45 1.51
Table 7: L2 scenario.
Inc Dens PWat Pgeo Slope PTrans Pshop DCia PPP
Inc 1.0 1.0 5.0 5.0 3.0 1.0 0.333 0.333 2.0 Dens 1.0 1.0 3.0 3.0 3.0 0.333 0.2 0.2 1.0 PWat 0.2 0.333 1.0 0.5 0.5 0.2 0.143 0.143 0.333 Pgeo 0.2 0.333 2.0 1.0 0.333 0.333 0.2 0.2 0.333 Slope 0.333 0.333 2.0 3.0 1.0 0.333 0.143 0.2 0.5 PTrans 1.0 3.0 5.0 3.0 3.0 1.0 0.333 0.333 3.0 Pshop 3.0 5.0 7.0 5.0 7.0 3.0 1.0 0.333 3.0 DCia 3.0 5.0 7.0 5.0 5.0 3.0 3.0 1.0 5.0 PPP 0.5 1.0 3.0 3.0 2.0 0.333 0.333 0.2 1.0 Scenario 0.11 0.07 0.02 0.03 0.04 0.12 0.22 0.29 0.06
Meaning of acronyms in Supplement 1.
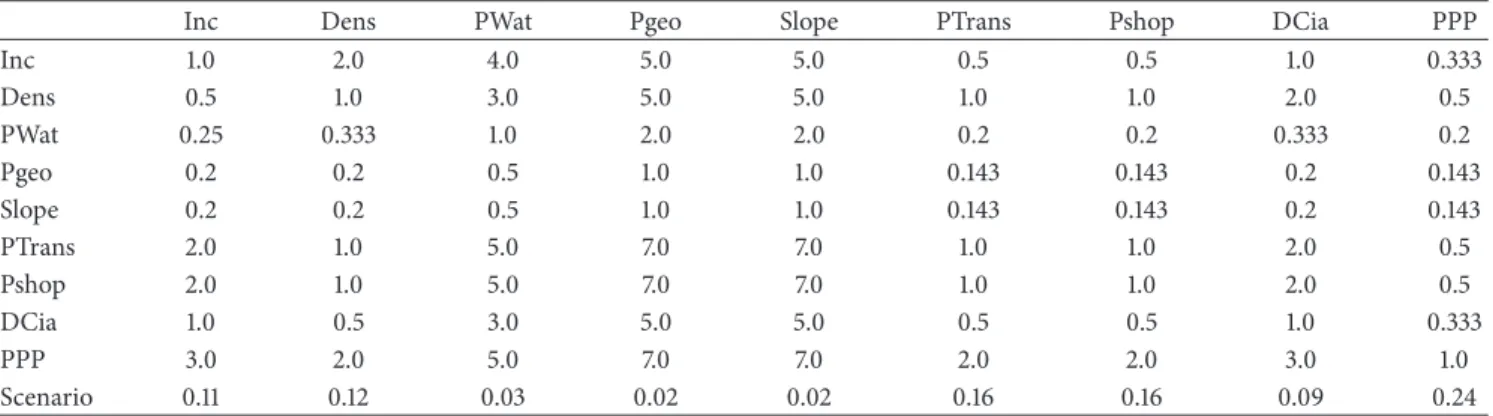
Table 8: Pairwise matrix for L3 scenario.
Inc Dens PWat Pgeo Slope PTrans Pshop DCia PPP
Inc 1.0 2.0 4.0 5.0 5.0 0.5 0.5 1.0 0.333 Dens 0.5 1.0 3.0 5.0 5.0 1.0 1.0 2.0 0.5 PWat 0.25 0.333 1.0 2.0 2.0 0.2 0.2 0.333 0.2 Pgeo 0.2 0.2 0.5 1.0 1.0 0.143 0.143 0.2 0.143 Slope 0.2 0.2 0.5 1.0 1.0 0.143 0.143 0.2 0.143 PTrans 2.0 1.0 5.0 7.0 7.0 1.0 1.0 2.0 0.5 Pshop 2.0 1.0 5.0 7.0 7.0 1.0 1.0 2.0 0.5 DCia 1.0 0.5 3.0 5.0 5.0 0.5 0.5 1.0 0.333 PPP 3.0 2.0 5.0 7.0 7.0 2.0 2.0 3.0 1.0 Scenario 0.11 0.12 0.03 0.02 0.02 0.16 0.16 0.09 0.24
Meaning of acronyms in Supplement 1.
calculation in relation to the attributes in a georeferenced way. The calculation for the identification of the most suitable areas for the EVSE network was performed according to (2), (3), and (4):
(A) L1 Scenario
(''Inc''+''Dens'') (2)
(B) L2 Scenario
(0.11 ∗''Inc''+ 0.07 ∗''Dens''+ 0.02 ∗''PWat''+ 0.03
∗''PGeo''+ 0.04 ∗''Slope''+ 0.12 ∗''PTrans''
+ 0.22 ∗''PShop''+ 0.29 ∗''DCia''+ 0.06 ∗''PPP'') (3)
(C) L3 Scenario
(0.11 ∗''Inc''+ 0.12 ∗''Dens''+ 0.03 ∗''PWat''+ 0.02
∗''PGeo''+ 0.02 ∗''Slope''+ 0.16 ∗''PTrans''
+ 0.16 ∗''PShop''+ 0.09 ∗''DCia''+ 0.24 ∗''PPP'') (4)
(ii) Grouping of Areas. To identify the areas with the greatest potential for EVSE network, the technique of Natural Break (Jenks) was adopted [58].
(iii) Subtraction of Restriction Areas. Inappropriate areas for the implementation of any type of infrastructure linked to road transport, i.e., water bodies, irregular settlements, environmental conservation units, etc. Therefore, all restric-tion areas were unified and subtracted from the global map [86]. The term unsafe area was used to refer to subnormal agglomerates considered with a high degree of violence that endangers physical and property integrity, thus resulting in serious material and personal damage. Risk areas refer to the flooding areas that are vulnerable to major floods that can cause damage to materials and endanger personal safety.
3.5.3. Third Processing Step. This stage highlights the appro-priate areas by neighborhood, taking into account spatial and cartographic issues. Spatial intersection processing was used in the relation of the maps (municipality and neighborhoods) and the cartographic questions are characterized by mapping
18% 20% 100% 50% 38% 50% 100% 28% 0% 20% 40% 60% 80% 100% An sw er s Sectors Au to m ak er s M an ufac tur er s T axi C o m p anies Go ve rn m en ts S er vice p ro vider s U tili ty s er vices E V ass o cia tio n s T o tal f eed bac k
Figure 2: Replies received from the specialists.
indicating the main locations for the installation of the EVSE network. Finally, the cartographic presentation is designed to support decision-makers in the areas with the highest potential areas (percentage) for EVSE and their overall geographic location.
4. Results
The considered scenarios account for 12,000 units of LDEVs by 2025 in BH, corresponding to a total of 1,200 EVSEs. The study revealed new attributes in this type of research, such as subnormal agglomerates—a patrimonial and physical risk in the region studied because it deals with areas with high violence rates, and flooding areas—in the case of high rainfall event. These findings were fundamental for this and future studies.
4.1. Survey Results. Around 30% of the response rate was obtained from the 51 expert surveys. The sectors with the highest percentage of participation were taxi companies and EV associations. The sector with the lowest return was the industrial segment. The experts evaluated that, for the EVSE L2, the most important attributes were workplace, shopping centers, public transportation connections, and household income.
When compared to EVSE L3, the household income and workplace attributes had higher weights. For EVSE L3, the best-evaluated attributes were roads, public transporta-tion connectransporta-tions, shopping centers, and populatransporta-tion density. When compared to EVSE L2, the roads, shopping centers, public transportation connections, population density, and geohazards were considered the most important attributes, revealing experts’ preference for super-fast charging stations (L3), as shown in Figure 2.
The experts also revealed the further away the EVSE are from the violence zones such as subnormal agglomerates and
risk zones such as flooding areas the better. The result of the analysis also revealed a wide standard deviation, especially in attributes as flooding areas and slopes. The most plausible explanation for this deviation is that attributes characteristics directly affect those who regularly live or access the region and these respondents usually give higher value to these attributes. On the other hand, the roads attribute presented the lowest standard deviation, which revealed a more bal-anced evaluation due to the fact that it shows a common and widespread demand in the diffusion process of the electric mobility infrastructure, as shown in Figure 3.
Regarding the GIS analysis, the optimum location of Level 1 installations of the EVSE network is largely affected by attributes like household income and population density. However, proximity of attributes, like shopping centers, public transportation connections, workplaces and roads, corridors and avenues, has positive impacts on Level 2 and Level 3 installations of the EVSE network, while attributes like flooding areas, slopes, and geohazards areas have negative impacts.
4.2. GIS Analysis Results of Recommended Area for EVSE L1.
The study showed that 65% of the recommended EVSE L1 installations were located in 10 neighborhoods located in the South-Central region, as shown in Figure 4. This is due to higher household income concentration and people aged 18 years or older in the targeted regions.
4.3. GIS Analysis Results of Recommended Area for EVSE L2.
The analysis revealed that the suggested areas for installation of the EVSE L2 network are contained in 45% of the BH neighborhoods, covering the South-Central and East regions (Figure 5) mainly due to the greater concentration of com-panies (workplace), shopping centers, and public transport connections, attributes that have been well evaluated by the specialists for this type of infrastructure.
6.86 6.43 6.79 6.93 8.29 5.14 5.14 4.57 3.36 6.36 7.57 7.79 7.50 6.21 5.14 5.14 4.50 8.21 1.00 3.00 5.00 7.00 9.00 11.00 A ssigned w eig h t Attributes AVG_L2 AVG_L3 H o us eho ld inco me P o p u la tio n den si ty Pub . tra n sp . co nnec tio n s Sh o p p in g cen ter s W o rk p laces G eo h aza rd s Flo o din g a re as Sl op es Roads & a ven ues
Figure 3: Average rating of expert rated attributes and standard deviation.
OESTE
CENTRO-SUL NOROESTE
65% of Recommended Areas are in 10 neighborhoods of the South-Central administrative region km 1:20.000 MG N N 0 0,225 0,45 0 ,9 1 ,3 5 1 ,8 2 ,25 2,7 3,15 Recommended Areas L1 Administrative Regions Neighborhood State MG
Map of recommended areas for L1 stations
Projected/Geography Referenced System: Sirgas 2000/UTM 23S Author: Evaldo Costa and Arthur Paiva
Date: 23/03/2017 Source: The own author
,000000
,000000
,000000
km 1:50.000
0 0,5 1 2 3 4 5 6 7
All recommended areas are
in 45% of all Belo Horizonte Neighborhoods
Recommended Areas L2 Administrative Regions Neighborhood State MG N N ,000000 600000 610000,000000 620000,000000 ,000000 600000 610000,000000 620000,000000 ,000000 7788000 ,000000 7797000 ,000000 7788000 ,000000 7797000
Map of recommended areas for L2 stations Projected/Geography Referenced System: Sirgas 2000/UTM 23S
Author: Evaldo Costa and Arthur Paiva Date: 23/03/2017 Source: The own author
Figure 5: Optimal locations for EVSE L2.
4.4. GIS Analysis Results of Recommended Area for EVSE L3.
Around 36 neighborhoods of the municipality of BH hold about 40% of the location recommended areas for EVSE L3, as shown in Figure 6. These areas are distributed in the Northeast, Northwest, West, South-Central, and Pampulha regions.
They are located near expressways, major avenues, and highways such as the Celso Mello Azevedo ring road that connects the South-Central (economic pole) to the other regions of BH and neighboring municipalities, as well as the Cristiano Machado avenue, Dom Pedro Primeiro Avenues, access to Pampulha Airport and Confins International Air-port, Contorno Avenue, among others. This region has some important shopping malls in BH, public transportation connections, and a high population density as well as access to major highways.
The distances between the extreme areas in the munici-pality of BH are short and compatible with the use of EVs. For example, the connection from extreme North to extreme South is around 37 km and from East to West it is less than 20 km. From the central area in the municipality to the farthest point (from extreme South to extreme North) the distance is close to 17 km.
5. Discussion
The identification of unsuitable areas for infrastructure instal-lation in developing countries has been considered in other investigations. The study to analyze the best locations for new filling stations in Malaysia, Asia, Khahro indicated that 24% of the planned areas for EVSE installation were in inadequate areas [87]. In the aforementioned study, the adaptations of the areas were carried out based on environmental risk factors and not as inadequate areas due to risks of public security. In the present study, this problem did not occur, since we excluded the risk areas from the recommended areas for EVSE installation. However, the problem is not completely solved because it is necessary to take into account the areas close to the risk areas; i.e., many access routes in the studied region cross long areas of subnormal agglomerate, which are not recommended for EVSE installation, due to the risks of violence during the loading time. Therefore, our recommendation is for the EVSE to be installed as far as possible from unsafe areas, in order to avoid serious occurrences with risks of physical integrity and damage.
Other studies proposed an assignment model to dis-tribute charging infrastructure in Beijing, China, and to investigate the development of optimal EV charging station
40% of the recommended areas are in 36 neighborhoods intersected by the main access roads to the municipality
Map of recommended areas for L3 stations
Projected/Geography Referenced System: Sirgas 2000/UTM 23S Author: Evaldo Costa and Arthur Paiva
Date: 23/03/2017 Source: The own author
0,95 1,9 2,85 3,8 4,75 5,7 6,65 0,475 km 1:40.000 N ,000000 ,000000 2,000000 N ,000000 ,000000 2,000000 0 AVE TYPE ROD Recommended Areas L3 Administrative Regions Neighborhood State MG
Figure 6: Optimal locations for EVSE L3.
assignments in Seattle, USA. Hao and Chen [88, 89] also did not address the issues of risk areas with a high rate of urban violence. Actually, almost all of the projects on the expansion of electric mobility are restricted to a few developed countries and public safety issues are focused on the safety of people and the vehicle with regard to the potential for battery accidents that can cause fires or explosions. However, the expansion of electric mobility in urban areas of some developing countries will probably require concern with other factors, such as unsafe urban areas highlighted in this study.
6. Conclusions, Limitations, and
Recommendations
This Brazilian pioneering study aimed at identifying the optimal locations to implement EVSE in the municipality of BH and identify what attributes should be prioritized for the installation of an EVSE network in urban areas. Some attributes such as subnormal agglomerates and flooding areas were identified for the first time in this study and support the identification of the best locations for EVSE (L2 and L3) in
BH, and in developing countries with substantial risk areas. Therefore, projects for the development of infrastructure for electric vehicles in regions with a high risk of violence and therefore subject to material and personal damage should include projects risk attributes such as those identified in this study.
In this context, the study reveals that EVSE L3 should not be located in public places, only in places that offer 24/7 personal security, as they do with gas stations currently in Brazil, and places as hotels, airports, shopping malls, etc. Besides that, the flooding areas may be obstacles to the expansion of its infrastructure network in Brazil. Similar regions around the world, especially in developing countries, are likely to present the same limitations for EVSE network expansion and require the development of business models capable of overcoming this issue.
Most of EVSE should be concentrated in small and specific areas of the municipality of BH. This can be a facilitating factor for optimizing the investment potential and maximizing the offer of user services by the expansion of the EV. The installation of an EVSE network will depend
on government regulation and potential financial incentives for the users. Participation of the public sector and other stakeholders will likely create sustainable business models capable of attracting investments to EVSE. In this context, the involvement of utilities, automakers, and companies that own large fleet and various level of government (i.e., federal, state, and municipal government) could be a promising start for the development of electric mobility and an incentive to support the EV infrastructure network.
The short distances that connect the main regions to the central region of the BH municipality may be favorable for the adoption of EV, as with a full charge the range of most EVs is much higher than the distances needed to cross the BH municipality (maximum distance of 37 km from extreme North to extreme South). The results of this research can contribute to better understand the diffusion of the charging infrastructure for EV and guide stakeholders and public policies in Brazil and other regions (not restricted to South America) with similar characteristics as BH in electric mobility projects.
Although it was not the objective of this study, it was possible to observe that the specification of the types of EVs during the vehicle registration process (up to now, the Brazilian authorities have not started this process) will be of great importance for the stakeholders and for future studies. This type of practice and information on various types of EVs might reveal significant differences in energy consumption and have an impact on the grid.
This study was limited due to the difficulty of locating specialists in electric mobility in Brazil, and further studies are still required to complement the current one. These include incorporating the EVSE financial aspect, evaluating the impacts of the EVSE network growth on the grid, incor-porating the drivers’ psychological aspects, and consumer attitudes towards e-mobility.
Data Availability
The data used to support the findings of this study are included within the article.
Disclosure
An introductory and limited version of this study (with different areas of study) was presented at the ITRN 2016 conference.
Conflicts of Interest
There are no conflicts of interest in this research.
Acknowledgments
The authors thank all participants for their patience and openness to share opinions on a novel technology and a special acknowledgement to Peter Deeney, Emma Hanley, Hickey Conor, Parveen Kumar, Jair Rattner, Ana Horta, the Researchers of the Environmental Institute at University
College Cork, and ITRN 2016 conference organizers. The fifth author acknowledges Fundac¸˜ao para a Ciˆencia e Tec-nologia for project grant MITP-TB/C S/0026/2013–SusCity Project and for support through IN+, Strategic Project UID/EEA/50009/2013. This research did not receive any spe-cific grant from funding agencies in the public, commercial, or not-for-profit sectors.
Supplementary Materials
The description of all the attributes used in the study is in Table A1, and the technical specifications of the charging by level, typical use, energy interface, power level, and charge time are in Table A2 of the supplementary materials.
(Supplementary Materials)
References
[1] Internation Energy Agency (IEA),Electric Vehicles Iniciative:
Global EV Outlook 2017. Two million and counting, Electric
Vehicle Iniciative. Clean Energy Ministerial, Paris, France. 2017. https://www.iea.org/publications/freepublications/publication/ GlobalEVOutlook2017.pdf.
[2] International Enegy Agency (IEA), Tracking Clean Energy Progress: Energy Thecnology Perspective 2017 Excerpt Informing
Energy Sector Transformations., Paris. 2017. http://www.iea.org/
publications/freepublications/publication/TrackingCleanEner-gyProgress2017.pdf.
[3] Empresa de Pesquisa Energ´etica (EPE), Balanc¸o energ´etico
nacional, Ano Base 2014, Minist´erio de Minas e Energia,
Brasilia, Brazil, 2015, https://ben.epe.gov.br/downloads/Relato-rio Final BEN 2015.pdf.
[4] L. Luo, E. van der Voet, and G. Huppes, “Life cycle assessment and life cycle costing of bioethanol from sugarcane in Brazil,”
Renewable & Sustainable Energy Reviews, vol. 13, no. 6-7, pp.
1613–1619, 2009.
[5] A. Roberto Ometto, M. Zwicky Hauschild, and W. Nelson Lopes Roma, “Lifecycle assessment of fuel ethanol from sugarcane in Brazil,”The International Journal of Life Cycle Assessment, vol. 14, no. 3, pp. 236–247, 2009.
[6] S. Filoso, J. B. Do Carmo, S. F. Mardegan, S. R. M. Lins, T. F. Gomes, and L. A. Martinelli, “Reassessing the environmental impacts of sugarcane ethanol production in Brazil to help meet sustainability goals,”Renewable & Sustainable Energy Reviews, vol. 52, pp. 1847–1856, 2015.
[7] A. Walter, M. V. Galdos, F. V. Scarpare et al., “Brazilian sugarcane ethanol: Developments so far and challenges for the future,”Wiley Interdisciplinary Reviews: Energy and Environ-ment, vol. 3, no. 1, pp. 70–92, 2014.
[8] L. A. Martinelli, R. Garrett, S. Ferraz, and R. Naylor, “Sugar and ethanol production as a rural development strategy in Brazil: Evidence from the state of S˜ao Paulo,”Agricultural Systems, vol. 104, no. 5, pp. 419–428, 2011.
[9] D. Pimentel, A. Marklein, M. A. Toth et al., “Food versus biofuels: Environmental and economic costs,”Human Ecology, vol. 37, no. 1, pp. 1–12, 2009.
[10] S. C. Bray, E. R. Ferreira, and D. G. G. Ruas,As pol´ıticas da
agroind´ustria canavieira eo pro´alcool no Brasil, Unesp-Mar´ılia
Publicac¸˜oes, 2000.
[11] P. Baptista, J. Tavares, and G. Gonc¸alves, “Energy and envi-ronmental impacts of potential application of fully or partially
electric propulsion vehicles: Application to Lisbon and S˜ao Miguel, Portugal,”Transportation Research Procedia, vol. 3, pp. 750–759, 2014.
[12] A. Foley and B. ´O. Gallach ´Oir, “Analysis of electric vehicle charging using the traditional generation expansion planning analysis tool WASP-IV,”Journal of Modern Power Systems and
Clean Energy, vol. 3, no. 2, pp. 240–248, 2015.
[13] M. Messagie, “Life Cycle Analysis of the Climate Impact of Elec-tric Vehicles,”Journal of Life Cycle Assessment. Tansportation
Enviromental. Belgium, 2014.
[14] P. Wolfram and T. Wiedmann, “Electrifying Australian trans-port: Hybrid life cycle analysis of a transition to electric light-duty vehicles and renewable electricity,”Applied Energy, vol. 206, pp. 531–540, 2017.
[15] H. Ambrose and A. Kendall, “Effects of battery chemistry and performance on the life cycle greenhouse gas intensity of electric mobility,”Transportation Research Part D: Transport
and Environment, vol. 47, pp. 182–194, 2016.
[16] J. F. Peters, M. Baumann, B. Zimmermann, J. Braun, and M. Weil, “The environmental impact of Li-Ion batteries and the role of key parameters – A review,”Renewable & Sustainable Energy
Reviews, vol. 67, pp. 491–506, 2017.
[17] T. R. Hawkins, B. Singh, G. Majeau-Bettez, and A. H. Strømman, “Comparative environmental life cycle assessment of conventional and electric vehicles,” Journal of Industrial
Ecology, vol. 17, no. 1, pp. 53–64, 2013.
[18] N. Hooftman, L. Oliveira, M. Messagie, T. Coosemans, and J. Van Mierlo, “Environmental analysis of petrol, diesel and electric passenger cars in a Belgian urban setting,”Energies, vol. 9, no. 2, pp. 1–24, 2016.
[19] E. Costa and J. Seixas, “Contribution of Electric Cars to the Mitigation of CO2 Emissions in the City of Sao Paulo,” in
Proceedings of the 2014 IEEE Vehicle Power and Propulsion
Conference (VPPC), pp. 1–5, Coimbra, Portugal, October 2014.
[20] A. Nordel¨of, M. Messagie, A.-M. Tillman, M. Ljunggren S¨oderman, and J. Van Mierlo, “Environmental impacts of hybrid, plug-in hybrid, and battery electric vehicles—what can we learn from life cycle assessment?”The International Journal
of Life Cycle Assessment, vol. 19, no. 11, pp. 1866–1890, 2014.
[21] E. Costa, J. Seixas, G. Costa, and T. Turrentine, “Interplay between ethanol and electric vehicles as low carbon mobility options for passengers in the municipality of S˜ao Paulo,”
International Journal of Sustainable Transportation, vol. 11, no.
7, pp. 518–525, 2017.
[22] E. Costa, A. Paiva, J. Seixas et al., “The best locations for charging infrastructure of electric vehicles in Belo Horizonte, Brazil,” inProceedings of the Irish Transport Research Network
(ITRN 2017), Dublin, Ireland, 2017.
[23] D. Sperling, “An Innovative Path to Sustainable Transportation,”
inTransportation and the environment: assessments and
sus-tainability, L. Gabriela, Ed., Apple Academic Press, New Jersey,
2014.
[24] C. Thiel, A. Alemanno, G. Scarcella, A. Zubaryeva, and G. Pasaoglu, Attitude of European car drivers towards electric
vehicles: a survey, JRC report, 2012.
[25] Fundac¸˜ao Estadual do Meio Ambiente (FEAM),Invent´ario de
Emiss˜oes de Gases de Efeito Estufa do Estado de Minas Gerais,
Belo Horizonte. 2013 http://www.feam.br/declaracoes-ambi-entais/registro-publico-de-emissoes-de-gases-de-efeito-estufa.
[26] Instituto Brasileiro de Geografia e Estat´ıstica (IBGE), Cidades. Brasilia, Brasil. 2017. http://ibge.gov.br/cidadesat/xtras/perfil .php?lang=&codmun=310620&search=minas-gerais% 7Cbelo-horizonte.
[27] E. H. G. Ara´ujo and H. J. H. Kux, “Identificac¸˜ao de ´areas com propens˜ao `a edificac¸˜ao no bairro. Belvedere em Belo Horizonte utilizando sensoriamento remoto e t´ecnicas de geoprocesa-mento,” inProceedings of the Anais XII Simp´osio Brasileiro de
Sensoriamento Remoto, pp. 16–21, Goiˆania, Brasil, 2005.
[28] P. T. Motta, R. L. R. D. Carvalho, M. E. L. Duarte, and A. D. M. Rocha, “An´alise dos acidentes de trabalho do setor de atividade econˆomica com´ercio no munic´ıpio de Belo Horizonte,”Revista
Mineira de Enfermagem, vol. 15, no. 3, pp. 427–433, 2011.
[29] Empresa de Pesquisa Energ´etica (EPE), Balanc¸o Energ´etico Nacional 2016. Balanc¸o energ´etico nacional, Ano Base 2015,
Bras´ılia, 2015, https://ben.epe.gov.br/BENRelatorioFinal.aspx?
anoColeta=2016&anoFimColeta=2015.
[30] Instituto Brasileiro de Geografia e Estat´ıstica (IBGE),Censo
Demogr´afico 2010, Brasilia, Brasil. 2010. https://www.ibge.gov
.br/.
[31] E. Fernandes and H. D. Pereira, “Legalizac¸˜ao das Favelas: Qual ´e o problema de Belo Horizonte?” Planejamento e Pol´ıticas
p´ublicas, vol. 1, 2010.
[32] J. M. D. Cajazeiro, An´alise da susceptibilidade `a formac¸˜ao de inundac¸˜oes nas bacias e ´areas de contribuic¸˜ao do ribeir˜ao Arrudas e c´orrego da Onc¸a em termos de ´ındices morfom´etricos
e impermeabilizac¸˜ao, UUFMG, Belo Horizonte, Brasil, 2011.
[33] Internation Energy Agency (IEA),Global EV Outlook 2016:
Beyond one million electric cars, Electric Vehicle Iniciative.
Clean Energy Ministerial, Paris, France. 2016. https://www.iea .org/publications/freepublications/publication/Global EV Out-look 2016.pdf.
[34] Canters Raf,Transport White Paper 2011: towards a competitive
and resource efficient transport system, Eltis: The Urban Mobility
Observatory, Brussels, Belgium, 2014.
[35] Associac¸˜ao Nacional dos Fabricantes de Ve´ıculos Automotores (ANFAVEA),Anu´ario da Ind´ustria Automobil´ıstica Brasileira, S˜ao Paulo. 2017. Avalible at: http://www.anfavea.com.br/anu-arios.html.
[36] C. Brand, C. Cluzel, and J. Anable,Modeling the uptake of plug-in vehicles in a heterogeneous car market using a consumer
segmentation approach, 2017, http://www.sciencedirect.com/
science/article/pii/S0965856416302130.
[37] Z. Lin and D. Greene, “Promoting the market for plug-in hybrid and battery electric vehicles: role of recharge availability,”
Transportation Research Record: Journal of the Transportation
Research Board, vol. 2252, pp. 49–56, 2011.
[38] SAE Intenational, “Ground Vehicle Standards SmartGrid,”Level
Terminology, 2017.
[39] D. Hall and N. Lutsey,Emerging best practices for electric vehicle
charging infrastructure, The International Council on Clean
Transportation (ICCT), Washington, DC, USA, 2017.
[40] SAE Intenational, Ground Vehicle Standards Newsletter, vol. 1, no. 1, 2010, http://www.sae.org/standardsdev/news/P100796 .pdf.
[41] U.S.Department of Energy (USDE). All-Electric Vehicle Range Grew from 73 Miles in Model Year 2011 to 114 Miles in Model Year 2017. 2017. https://www.energy.gov.
[42] H. Zhao and N. Li, “Optimal siting of charging stations for electric vehicles based on fuzzy Delphi and hybrid multi-criteria decision making approaches from an extended sustainability perspective,”Energies, vol. 9, no. 4, p. 270, 2016.
[43] Y. Yang, E. Yao, Z. Yang, and R. Zhang, “Modeling the charging and route choice behavior of BEV drivers,” Transportation
Research Part C: Emerging Technologies, vol. 65, pp. 190–204,
2015.
[44] F. Gebauer, R. Vilimek, A. Keinath, and C.-C. Carbon, “Changing attitudes towards e-mobility by actively elaborating fast-charging technology,”Technological Forecasting & Social
Change, vol. 106, pp. 31–36, 2016.
[45] P. Zhang, K. Qian, C. Zhou, B. G. Stewart, and D. M. Hepburn, “A methodology for optimization of power systems demand due to electric vehicle charging load,”IEEE Transactions on Power
Systems, vol. 27, no. 3, pp. 1628–1636, 2012.
[46] I. Rahman, P. M. Vasant, B. S. M. Singh, M. Abdullah-Al-Wadud, and N. Adnan, “Review of recent trends in optimization techniques for plug-in hybrid, and electric vehicle charging infrastructures,”Renewable & Sustainable Energy Reviews, vol. 58, pp. 1039–1047, 2016.
[47] K. Lebeau, J. Van Mierlo, P. Lebeau, O. Mairesse, and C. Macharis, “Consumer attitudes towards battery electric vehi-cles: A large-scale survey,”International Journal of Electric and
Hybrid Vehicles, vol. 5, no. 1, pp. 28–41, 2013.
[48] O. Egbue and S. Long, “Barriers to widespread adoption of electric vehicles: An analysis of consumer attitudes and perceptions,”Energy Policy, vol. 48, pp. 717–729, 2012.
[49] S. Skippon and M. Garwood, “Responses to battery electric vehicles: UK consumer attitudes and attributions of symbolic meaning following direct experience to reduce psychological distance,”Transportation Research Part D: Transport and
Envi-ronment, vol. 16, no. 7, pp. 525–531, 2011.
[50] P. Jankowski and L. Richard, “Integration of GIS-based suit-ability analysis and multicriteria evaluation in a spatial decision support system for route selection,”Environment & Planning B:
Planning & Design, vol. 21, no. 3, pp. 323–340, 1994.
[51] Vermont Enegy Investment Corporation (VEIC). Electric Vehicle Charging Station Guidebook: Planning for Installation
and Operation, Chittenden Country RPC, Winooski, U.S.A.
2014. https://www.ccrpcvt.org/wp-content/uploads/2016/01/ 20140626-EV-Charging-Station-Installation-Guide.pdf. [52] BEAMA,A guide to electric vehicle infrastructure, London, U.K,
2017, http://www.beama.org.uk/.
[53] R. Parker, A. West, and S. Fertig,Electric vehicle charging station
infrastructure community needs assessment, Eugene USA, 2010.
[54] L. Zhang, T. Brown, and S. Samuelsen, “Evaluation of charging infrastructure requirements and operating costs for plug-in electric vehicles,”Journal of Power Sources, vol. 240, pp. 515–524, 2013.
[55] X. Xi, R. Sioshansi, and V. Marano, “Simulation-optimization model for location of a public electric vehicle charging infras-tructure,”Transportation Research Part D: Transport and
Envi-ronment, vol. 22, pp. 60–69, 2013.
[56] D. Efthymiou, C. Antoniou, Y. Tyrinopoylos, and E. Mitsakis, “Spatial Exploration of Effective Electric Vehicle Infrastructure Location,”Procedia - Social and Behavioral Sciences, vol. 48, pp. 765–774, 2012.
[57] S. Wagner, T. Brandt, and D. Neumann,Smart City Planning-Developing An Urban Charging Infrastructure For Electric Vehi-cles, vol. 8, (7), AIS Electronic Library (AISeL), 2014.
[58] J. Chen, S. Yang, H. Li, B. Zhang, and J. Lv, “Research on geographical environment unit division based on the method of natural breaks (Jenks),”International Archives of the Photogram-metry, Remote Sensing and Spatial Information Sciences XL-4 (W3), vol. 47, 2013.
[59] J. Bean, K. Dunn, R. Halbright, and O. Hosteller,Electric vehicle
charging infrastructure in the city of Berkeley, 2011, https://www
.cityofberkeley.info/uploadedFiles/Public Works/Commissions/ Commission for Transportation/B4Presidio%20Report%20on% 20Electric%20Vehicle%20Charging%20in%20Berkeley.pdf [60] Z. Chen, J. C. Xia, B. Irawan, and C. Caulfied, “Development of
location-based services for recommending departure stations to park and ride users,”Transportation Research Part C: Emerging
Technologies, vol. 48, pp. 256–268, 2014.
[61] P. A. Longley, M. F. Goodchild, D. J. Maguire, and D. W. Rhind,
Geographic information systems and science, John Wiley & Sons,
2005.
[62] Empresa Brasileira de Pesquisa Agropecu´aria (EMBRAPA), Brasil em elevo. 2017. https://www.cnpm.embrapa.br/projetos/ relevobr/index.htm.
[63] Instituto Brasileiro de Geografia e Estat´ıstica (IBGE), Censo 2010. Brasilia, Brasil. 2010. http://censo2010.ibge.gov.br/result-ados.html.
[64] Secretaria Municipal Adjunta de Gest˜ao Compartilhada (SMAGC), Portal de Informac¸˜oes e Servic¸os. Prefeitura de Belo Horizonte, Brasil. Transparˆencia e Acesso a Informac¸˜ao. Belo Horizonte, Brasil. 2017. http://portalpbh.pbh.gov.br/pbh/. [65] Servic¸os Geol´ogico do Brasil (CPRM). Informac¸˜ao Geol´ogico
do Brasil. Bras´ılia, Brasil. Superintendˆencia de Desenvolv-imento da Capital (SUDECAP), 2017. http://cprm.gov.br/pub-lique/.
[66] T. L. Saaty, “How to make a decision: the analytic hierarchy process,”European Journal of Operational Research, vol. 48, no. 1, pp. 9–26, 1990.
[67] S. L. Hakimi, “Optimum locations of switching centers and the absolute centers and medians of a graph,”Operations Research, vol. 12, no. 3, pp. 450–459, 1964.
[68] B. H. Massam, “Multi-Criteria Decision Making (MCDM) techniques in planning,”Progress in Planning, vol. 30, no. 1, pp. 1–84, 1988.
[69] N. C. Onat, M. Kucukvar, O. Tatari, and Q. P. Zheng, “Com-bined application of multi-criteria optimization and life-cycle sustainability assessment for optimal distribution of alternative passenger cars in U.S.,”Journal of Cleaner Production, vol. 112, pp. 291–307, 2016.
[70] J. E. Dobson, “A regional screeining procedure for land use suitability analysis.,”Geographical Review, vol. 69, no. 2, pp. 224–234, 1979.
[71] S. J. Carver, “Integrating multi-criteria evaluation with geo-graphical information systems,”International Journal of
Geo-graphical Information Science, vol. 5, no. 3, pp. 321–339, 1991.
[72] A. C. Coelho, J. W. Labadie, and D. G. Fontane, “Multicriteria Decision Support System for Regionalization of Integrated Water Resources Management,”Water Resources Management, vol. 26, no. 5, pp. 1325–1346, 2012.
[73] T. T. Duc, “Using GIS and AHP technique for land-use suit-ability analysis,” inProceedings of the International symposium on geoinformatics for spatial infrastructure development in earth
and allied sciences, pp. 1–6, Citeseer, 2006.
[74] F. Joerin, M. Th´erialult, and A. Musy, “Using GIS and out-ranking multicriteia analysis for land-use suitability assesment,”
International Journal of Geographical Information Science, vol.
15, no. 2, pp. 153–174, 2001.
[75] M. Aruldoss, T. M. Lakshmi, and V. P. Venkatesan, “A survey on multi criteria decision making methods and its applications,”
American Journal of Information Systems, vol. 1, no. 1, pp. 31–43,
[76] E. Triantaphyllou and S. H. Mann, “Using the analytic hierarchy process for decision making in engineering applications: some challenges,” International Journal of Industrial Engineering:
Applications and Practice, vol. 2, no. 1, pp. 35–44, 1995.
[77] T. L. Saaty,The Analytic Network Process: Decision Making with Dependence and Feedback; The Organization and Prioritization
of Complexity, Rws Publications, 2005.
[78] J. Malczewski and C. Rinner, “Introduction to GIS-MCDA,”
in Multicriteria Decision Analysis in Geographic Information
Science, pp. 23–54, Springer, 2015.
[79] T. L. Saaty, “Relative measurement and its generalization in decision making. Why pairwise comparisons are central in mathematics for the measurement of intangible factors. The analytic hierarchy/network process,” Revista de la Real Academia de Ciencias Exactas, Fisicas y Naturales. Serie A.
Matematicas, vol. 102, no. 2, pp. 251–318, 2008.
[80] United Nations Framework Convention on Climate Change (UNFCCC). Paris agreement, Paris. United Nations, USA. 2015. http://unfccc.int/files/essential background/convention/ application/pdf/english paris agreement.pdf.
[81] X. Lin, J. Sun, S. Ai, X. Xiong, Y. Wan, and D. Yang, “Distribution network planning integrating charging stations of electric vehicle with V2G,”International Journal of Electrical Power &
Energy Systems, vol. 63, pp. 507–512, 2014.
[82] M. Aslani and A. A. Alesheikh, “Site selection for small gas stations using GIS,”Scientific Research and Essays, vol. 6, no. 15, pp. 1361–3171, 2011.
[83] F. Moreira, C. Barsosa, G. Cˆamara, and R. Almeida-Filho, Inferˆencia geogr´afica e suporte `a decis˜ao.Introduc¸˜ao `a Ciˆencia da Geoinformac¸˜ao. S˜ao Jos´e dos Campos: livro online, sd
Cap´ıtulo,9. 2001.
[84] E. Roszkowska, “Rank Ordering Criteria Weighting Methods – a Comparative Overview,”Optimum. Studia Ekonomiczne, no. 5(65), pp. 14–33, 2013.
[85] J. Malczewski, “On the use of weighted linear combination method in GIS: Common and best practice approaches,”
Trans-actions in GIS, vol. 4, no. 1, pp. 5–22, 2000.
[86] C. Santos and T. Galv˜ao, Prevenc¸a∼o de Riscos de Desliza-mentos em Encostas: Guia para Elaborac¸a∼o de Politicas Municipais. Minist´erio das Cidades, Cities Alliance, Brasilia, 2006.
[87] S. H. Khahro, A. N. Matori, I. A. Chandio, and M. A. H. Talpur, “Land suitability analysis for installing new petrol filling stations using GIS,” inProceedings of the 4th International Sym-posium on Infrastructure Engineering in Developing Countries,
IEDC 2013, pp. 28–36, Pakistan, December 2013.
[88] H. Hao, Z. Liu, F. Zhao, W. Li, and W. Hang, “Scenario analysis of energy consumption and greenhouse gas emissions from China’s passenger vehicles,”Energy, vol. 91, pp. 151–159, 2015. [89] T. D. Chen, C. J. Hall, and K. M. Kockelman, “Locating Electric
Vehicle Charging Stations: Parking-Based Assignment Method for Seattle, Washington,”Transportation Research Record:
Jour-nal of the Transportation Research Board, vol. 2385, pp. 28–36,
International Journal of
Aerospace
Engineering
Hindawi www.hindawi.com Volume 2018Robotics
Journal of Hindawi www.hindawi.com Volume 2018 Hindawi www.hindawi.com Volume 2018Active and Passive Electronic Components VLSI Design Hindawi www.hindawi.com Volume 2018 Hindawi www.hindawi.com Volume 2018
Shock and Vibration
Hindawi
www.hindawi.com Volume 2018
Civil Engineering
Advances inAcoustics and VibrationAdvances in
Hindawi
www.hindawi.com Volume 2018
Hindawi
www.hindawi.com Volume 2018
Electrical and Computer Engineering Journal of Advances in OptoElectronics Hindawi www.hindawi.com Volume 2018
Hindawi Publishing Corporation
http://www.hindawi.com Volume 2013 Hindawi www.hindawi.com
The Scientific
World Journal
Volume 2018 Control Science and Engineering Journal of Hindawi www.hindawi.com Volume 2018 Hindawi www.hindawi.com Journal ofEngineering
Volume 2018Sensors
Journal of Hindawi www.hindawi.com Volume 2018 Machinery Hindawi www.hindawi.com Volume 2018 Modelling & Simulation in Engineering Hindawi www.hindawi.com Volume 2018 Hindawi www.hindawi.com Volume 2018 Chemical EngineeringInternational Journal of Antennas and
Propagation International Journal of Hindawi www.hindawi.com Volume 2018 Hindawi www.hindawi.com Volume 2018 Navigation and Observation International Journal of Hindawi www.hindawi.com Volume 2018