2001/1 14 February 2001
Statistics on research and development funding
Executive Summary
• $1.1 billion was spent on R&D in 1997/98, a 53% increase on 1990/91.
• Government contributes about half of R&D funding in New Zealand.
• New Zealand’s R&D expenditure is half that of the OECD average as a percent of GDP.
This is mostly due to the very low level of funding from New Zealand’s business sector.
• New Zealand mostly spends its R&D funds on research by industries.
• While R&D spending in agriculture changed little between 1992/93 and 1997/98, spending
increased substantially in service industries.
• New Zealand’s R&D activities in the manufacturing sector is mainly of a low level of
technology.
• Resident patent application numbers grew 98% between 1990 and 1998.
Introduction
The definition of research and development (R&D) used by the OECD, and by the Ministry of Research, Science and Technology in their R&D survey, is as follows:"Research and experimental development comprises creative work undertaken on a systematic basis in order to increase the stock of knowledge, including knowledge of man, culture and society, and
the use of this stock of knowledge to devise new applications."1
This paper considers three aspects of R&D funding: the source of the funding; where the funds are spent; and their effectiveness.
1 This is the OECD definition, as noted in the Ministry of Research, Science and Technology publication, New Zealand
1.
How is R&D funded?
R&D funding
in New
Zealand
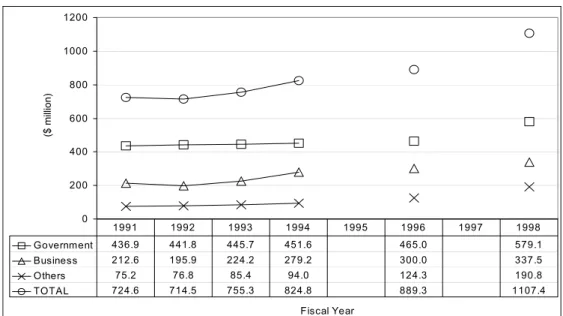
Figure 1 shows expenditure on research and development (R&D) according to the source of funding. These and other R&D data have been collected by survey since 1990/91.
Figure 1: Gross expenditure on R&D – by source of funds
0 200 400 600 800 1000 1200 Fiscal Year ($ m illion) Government 436.9 441.8 445.7 451.6 465.0 579.1 Business 212.6 195.9 224.2 279.2 300.0 337.5 Others 75.2 76.8 85.4 94.0 124.3 190.8 TOTAL 724.6 714.5 755.3 824.8 889.3 1107.4 1991 1992 1993 1994 1995 1996 1997 1998
Source: Ministry of Research, Science & Technology, 1999, p.5
The graph shows Government to be the main source of R&D funding in New Zealand. Its share of total funding is down however, falling from 60% to 52% between 1990/91 and 1997/98. The next largest source of funding is the business sector – at around 30% for both years. The category providing the smallest source of funding – “others” – was also the one which
increased the most. This category includes universities2, non-profit
organisations, and overseas-sourced funding. Its share rose from 10% to 17%.
Overall, R&D funding increased 53% between 1990/91 and 1997/98. Government funding rose 33%, business funding 59%, and other funding 154%.
The public
funding
system
Much of the central government’s R&D funding is given through Vote Research, Science & Technology. This is estimated to have received $370 million in the 1999/2000 year, not including overhead and other funding which does not involve direct investment in science programmes.
Vote Education is the other main source of public R&D funding, receiving an estimated $144 million. This is that part of Government’s Equivalent Full-Time Student funding which universities use on R&D activities.
Other Votes include, for example, Vote Agriculture and Vote Fisheries. In
total, other Votes are estimated to have received $95 million for R&D.3
2 University funding in the “other” category includes R&D activity funded, for example, by student fees. It does not
include research financed by Government’s “Equivalent Full Time Student” funding to universities (which is counted as Government) nor that financed by businesses (which is counted as Business).
Figure 2: Central government funding of R&D – by Vote $95 m (16%) $144 m (24%) $370 m (61%)
Vote Research, Science & Technology
Vote Education O ther Votes
Source: Ministry of Research, Science & Technology , 1999, Briefing for
incoming Minister, p. 7
Vote
Research,
Science &
Technology
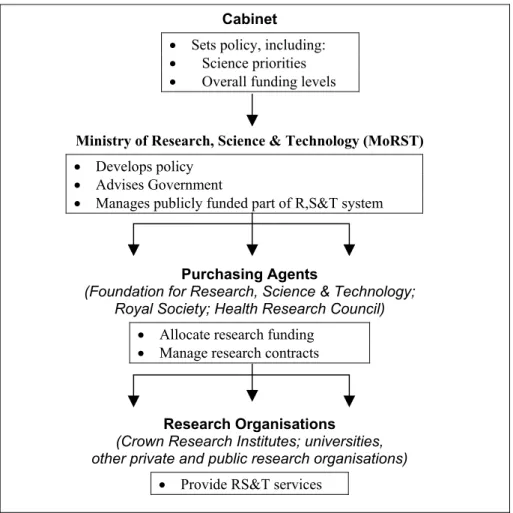
The structure of the funding system through Vote Research, Science & Technology is shown in Figure 3. At the highest level, Cabinet sets the overall policy, including the level of funding to be allocated to each of the
research, science and technology (RS&T)4 programmes. The Ministry of
Research, Science & Technology (MoRST) is then charged with managing the funding system. The funds are passed though MoRST to the purchasing agents, who in turn contract with various research organisations for the provision of RS&T services.
Figure 3. The structure of the Vote Research, Science & Technology funding system
Cabinet
• Sets policy, including:
• Science priorities
• Overall funding levels
Ministry of Research, Science & Technology (MoRST)
• Develops policy
• Advises Government
• Manages publicly funded part of R,S&T system
Purchasing Agents
(Foundation for Research, Science & Technology; Royal Society; Health Research Council)
• Allocate research funding
• Manage research contracts
Research Organisations
(Crown Research Institutes; universities, other private and public research organisations)
• Provide RS&T services
The Government has specified four goals for its RS&T funding, and each has one or several funding instruments associated with it. A total of $474 million has been appropriated to Vote Research, Science & Technology for 2000/2001, including overheads. How this is to be distributed across the four goals is shown in Figure 4. These goals and the associated funding instruments (or outputs/programmes) are described in the appendix. The appendix also states the appropriation for each funding instrument in 2000/01 and the purchasing agent responsible.
Figure 4: 2000/01 appropriations for Vote Research, Science & Technology – by Goal
$ 4 2 m ( 9 % ) $ 8 4 m ( 1 8 % ) $ 8 5 m ( 1 8 % ) $ 2 6 3 m ( 5 5 % ) I n n o v a t i o n G o a l E c o n o m i c G o a l E n v i r o n m e n t G o a l S o c i a l G o a l
Source: Estimates of Appropriation for the Government of New Zealand for the year ending 30 June 2001.
Figure 5 shows the total amount appropriated for Vote Research, Science and Technology through MoRST and the Department of Science and Industrial Research (DSIR) each year since 1987. In inflation-adjusted terms, the level of funding jumped in 1992/93 and 1997/98, and has risen steadily from 1998/99 onwards. As a percentage of total Government spending, these Votes have risen from 0.72% in 1986/87 to an estimated 1.25% in 2000/01. As a percent of GDP, the figures are respectively 0.27%
and 0.43%.5
Figure 5: Appropriations for Vote Research, Science and Technology and Vote Science and Industrial Research
0 1 0 0 , 0 0 0 2 0 0 , 0 0 0 3 0 0 , 0 0 0 4 0 0 , 0 0 0 5 0 0 , 0 0 0 1987 1988 1989 1990 1991 1992 1993 1994 1995 1996 1997 1998 1999 2000 2001 F i s c a l Y e a r ($000) N o m i n a l I n f l a t i o n - a d j u s t e d ( 1 9 9 9 / 2 0 0 0 $ s )
Source: Estimates of Appropriation for the Government of New Zealand
5 Not included in these figures are re-allocations of money from other Votes such as Health and Education. Including
Private
funding of
R&D
Private businesses funded $337.5 million of R&D in 1997/98. Most of this was spent within the business sector (73%), with an additional 21% being spent in the Government sector and 6% on R&D provided by universities. Producer boards and research associations dominated business funding of R&D, being responsible for a quarter of the funding in 1995/96. The top ten firms provided a further 20% of funding, the next top 60 firms a further 29%,
leaving 26% from the remaining firms.6
International
comparisons
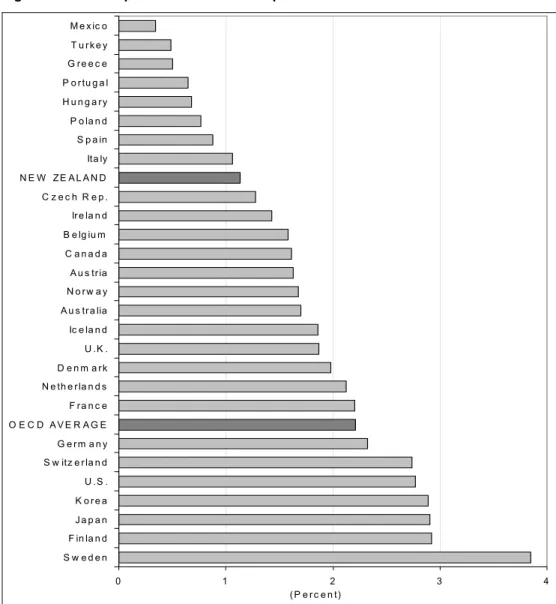
The level of R&D expenditure7 in New Zealand is considerably less than in
most other OECD countries, as can be seen in Figure 6. At 1.1% of GDP, New Zealand has the ninth lowest expenditure of the 28 OECD countries listed. Its level is half the 2.2% OECD country average.
Figure 6: Gross expenditure on R&D as a percent of GDP – OECD countries
0 1 2 3 4 S w e d e n F in la n d J a p a n K o r e a U .S . S w itz e r la n d G e rm a n y O E C D A V E R A G E F ra n c e N e th e r la n d s D e n m a rk U .K . Ic e la n d A u s tr a lia N o r w a y A u s tria C a n a d a B e lg iu m Ir e la n d C z e c h R e p . N E W ZE A L A N D Ita ly S p a in P o la n d H u n g a ry P o r tu g a l G re e c e T u r k e y M e x ic o (P e r c e n t)
Source: OECD, Main Science and Technology Indicators, 1999:2, p. 16
6 MoRST, New Zealand research and development statistics 1995/96 (p. 8).
7 The difference between each country’s R&D funding and R&D expenditure is its net funding from abroad. This section
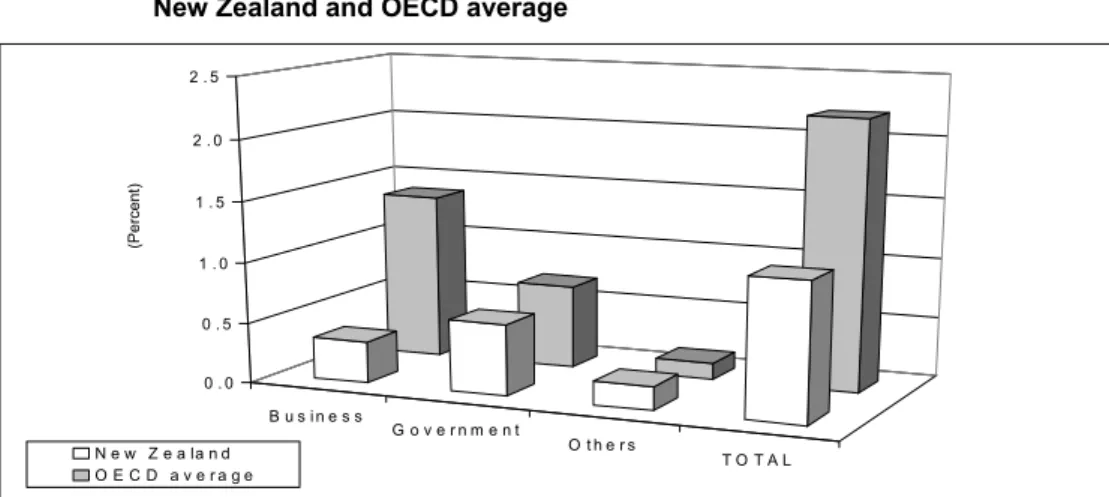
The main factor pulling New Zealand’s ranking down is the short-fall of business funding of R&D, as can be seen clearly in Figure 7. Figure 7 also shows the importance of Government in R&D funding in New Zealand.
Figure 7: Gross expenditure on R&D as a percent of GDP – by sector of funding:
New Zealand and OECD average
B u s i n e s s G o v e r n m e n t O t h e r s T O T A L 0 . 0 0 . 5 1 . 0 1 . 5 2 . 0 2 . 5 (Percent ) N e w Z e a la n d O E C D a v e r a g e Source: OECD, 1999:2, p. 16, 20, 21
Comparing New Zealand with similar countries does not change its relative position. The Ministry of Research, Science and Technology uses six “reference countries” when examining New Zealand’s comparative performance: Australia, Denmark, Finland, Ireland, Norway and Sweden. These countries were chosen “as having a number of similar characteristics to New Zealand regarding population, size of the economy, and stage of
economic development".8 However, the averages9 for the “reference
countries” and the OECD are very similar, both for total R&D expenditure (as a percentage of GDP) and for funding by the different sectors.
In 1997/98, New Zealand’s expenditure on R&D was equivalent to 0.153% of total expenditure in the OECD, up from 0.138% in 1995/96. New Zealand makes up smaller proportion of business funding of R&D in the OECD. Its share of business funding was 0.075% in 1997/98, down slightly from 0.077% in 1995/96.
8 MoRST, 1999, p. 33.
9 The OECD average is a weighted average, with each country being weighted by its size. OECD average figures are
given in the OECD publications. The reference countries average is an unweighted average, with each country contributing an equal share to the combined average.
2. How are the R&D funds spent?
R&D funds
and
expenditure
compared
Figure 8 compares the source of R&D funding with where the funds are actually spent. It shows a net transfer of R&D funds from the other sectors to the universities. While universities provide 23.9% of R&D funding, they receive 36.4% of the funding (see footnote to Figure 8).
Figure 8: Gross expenditure on R&D in 1997/98 – by performer and source of funds
G o v e r n m e n t B u s in e s s U n iv e r s it ie s 0 5 0 1 0 0 1 5 0 2 0 0 2 5 0 3 0 0 3 5 0 4 0 0 4 5 0 ($ m illio n ) b y P e r f o r m e r b y S o u r c e o f F u n d s
Note: Adjustments have been made from the funding data shown in Figure 1. First, the $144.2 m Equivalent Full Time Student funding spent on R&D has been transferred from Government to Universities. Second, the non-universities funding ($70.0 m) has been removed from the “Universities & Others category”. As a result of the latter adjustment, the sum of the dark columns is $70 m less than the sum of the white columns.
Source: OECD, 1999:1, p. 317
Spending –
by output
class
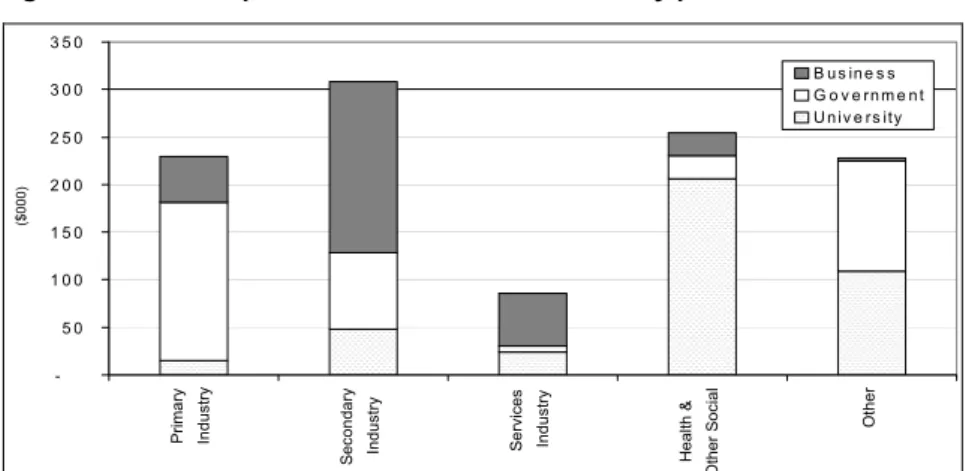
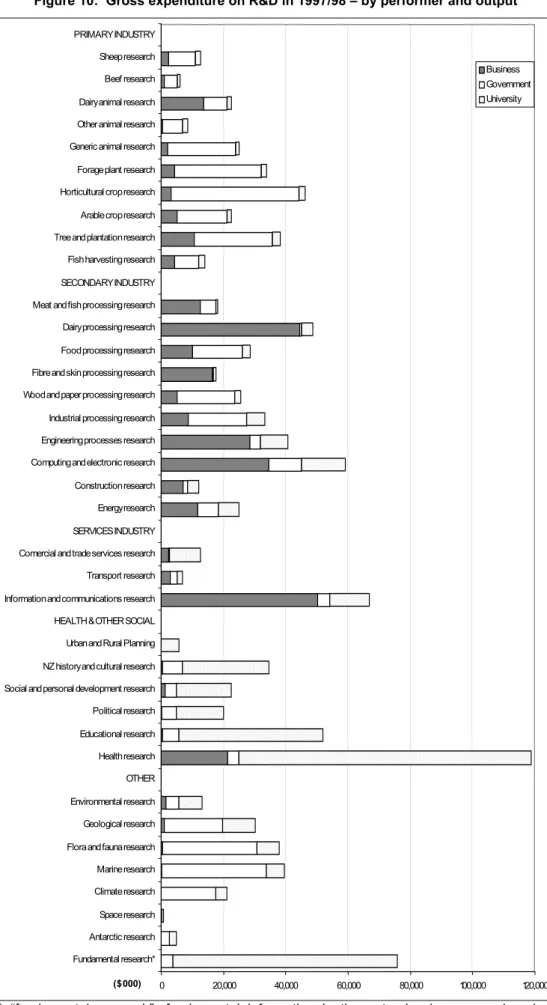
Most R&D expenditure in New Zealand is spent on research by industries. Of total expenditure in 1997/98, 56% went to industrial R&D, 23% to “health and other social” areas, and 21% to “other” areas such as fundamental, climate, and earth resources research. A detailed breakdown within each sector is given in Figure 10.
As Figures 9 and 10 show, the universities were dominant R&D providers in the area of “health and other social” R&D; business was dominant in the secondary and services industries; and government in primary industry.
Figure 9: Gross expenditure on R&D in 1997/98 – by performer and sector10
-5 0 1 0 0 1 5 0 2 0 0 2 5 0 3 0 0 3 5 0 Pr im a ry Industry S econdary Industry Se rvices Industry H ealth & O ther S ocial Other ($000) B u s in e s s G o v e rn m e n t
Source: Ministry of Research, Science & Technology, e-mailed data
U n iv e rs ity
Figure 10: Gross expenditure on R&D in 1997/98 – by performer and output 0 20,000 40,000 60,000 80,000 100,000 120,000 Fundamental research* Antarctic research Space research Climate research Marine research Flora and fauna research Geological research Environmental research OTHER Health research Educational research Political research Social and personal development research NZ history and cultural research Urban and Rural Planning HEALTH & OTHER SOCIAL Information and communications research Transport research Comercial and trade services research SERVICES INDUSTRY Energy research Construction research Computing and electronic research Engineering processes research Industrial processing research Wood and paper processing research Fibre and skin processing research Food processing research Dairy processing research Meat and fish processing research SECONDARY INDUSTRY Fish harvesting research Tree and plantation research Arable crop research Horticultural crop research Forage plant research Generic animal research Other animal research Dairy animal research Beef research Sheep research PRIMARY INDUSTRY ($000) Business Government
* “fundamental research”: fundamental information in the natural sciences, engineering, social sciences and humanities (where no end use has been identified).
Source: Ministry of Research, Science & Technology, e-mailed data
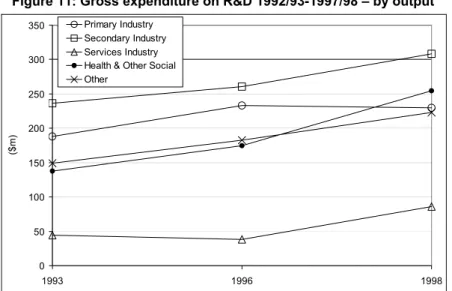
Figure 11 shows that R&D expenditure rose in all sectors of the economy between 1995/96 and 1997/98, with one notable exception – primary industries.
• Primary industries research fell 1.4%, with fisheries R&D dropping 49%,
sheep R&D dropping 44%, and forestry R&D rising 24%. Agriculture as a whole rose 1.5%.
• The highest percentage growth was for services industry research (up
127%). This was driven by the 162% ($41 million) increase in “information and communications” R&D.
• Health and other social research rose 45%, with “education, knowledge
and training” R&D rising 187% ($34 million) and health R&D rising 22% ($21 million).
• “Other” research rose 22%, with “land use, flora & fauna” R&D rising
83% ($17 million), fundamental R&D rising 42% ($22 million), and “environmental protection R&D falling 44% ($10 million).
• Secondary industry research rose 18%, with energy R&D rising 81%
($11 million), “electronics & instruments” R&D rising 55% ($21 million), and “fibre, textiles & skin processing” R&D falling 34% ($9 million).
Figure 11: Gross expenditure on R&D 1992/93-1997/98 – by output
0 50 100 150 200 250 300 350 1993 1996 1998 ($m) Primary Industry Secondary Industry Services Industry Health & Other Social Other
Source: Ministry of Research, Science & Technology, New Zealand research & experimental development statistics (for 1993 and 1996) and e-mailed data (for 1998)
Spending –
by level of
technology
R&D in New Zealand’s manufacturing sector is of a low level of technology compared with other OECD countries. New Zealand’s ratio between R&D expenditure on high and medium-high technology and low and medium-low technology was 0.6 : 1 in 1994/95. This compares with an OECD average 6.8 : 1 and an average for the “reference countries” 2.8 : 1. These differences are seen clearly in Figure 12.
The situation has since improved, with 1997/98 figures showing the share of high tech in New Zealand to have almost doubled (from 12% to 22%) and the share of low tech to have fallen (from 59% to 49%).
Figure 12: The percent of manufacturing R&D expenditure in each level of technology in 1994/95 H ig h M e d iu m h ig h M e d iu m lo w L o w N e w Z e a la n d R e fe r e n c e c o u n tr ie s O E C D a v e r a g e 0 1 0 2 0 3 0 4 0 5 0 6 0 (Percent )
Source: Ministry of Research, Science & Technology, 1999, p. 14
Spending –
by industry
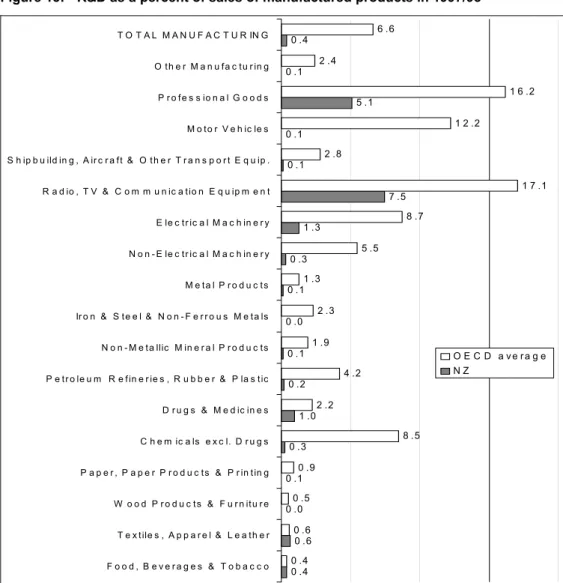
Figure 13: R&D as a percent of sales of manufactured products in 1997/98
0 .4 0 .6 0 .0 0 .1 0 .3 1 .0 0 .2 0 .1 0 .0 0 .1 0 .3 1 .3 7 .5 0 .1 0 .1 5 .1 0 .1 0 .4 0 .4 0 .6 0 .5 0 .9 8 .5 2 .2 4 .2 1 .9 2 .3 1 .3 5 .5 8 .7 1 7 .1 2 .8 1 2 .2 1 6 .2 2 .4 6 .6 F o o d , B e v e r a g e s & T o b a c c o T e x tile s , A p p a r e l & L e a th e r W o o d P r o d u c t s & F u r n itu r e P a p e r , P a p e r P r o d u c ts & P r in tin g C h e m ic a ls e x c l. D r u g s D r u g s & M e d ic in e s P e tr o le u m R e f in e r ie s , R u b b e r & P la s tic N o n - M e ta llic M in e r a l P r o d u c ts Ir o n & S te e l & N o n - F e r r o u s M e ta ls M e ta l P r o d u c t s N o n - E le c tr ic a l M a c h in e r y E le c tr ic a l M a c h in e r y R a d io , T V & C o m m u n ic a tio n E q u ip m e n t S h ip b u ild in g , A ir c r a ft & O t h e r T r a n s p o r t E q u ip . M o to r V e h ic le s P r o f e s s io n a l G o o d s O th e r M a n u fa c tu r in g T O T A L M A N U F A C T U R IN G O E C D a v e r a g e N Z
Source: Ministry of Research, Science & Technology, 1999, p. 17
The picture of New Zealand’s low level of R&D technology is reinforced when the R&D intensity of each industry in the manufacturing sector is examined. Figure 13 shows that, in manufacturing overall, New Zealand’s R&D expenditure was equivalent to only 0.4% of sales in 1997/98. This is well below the OECD average of 6.6%. What is more, the only two industries where New Zealand’s R&D intensity is equivalent to the OECD
average’s – “food, beverages, tobacco” and “textiles, apparel, leather” are low tech industries with very low levels of R&D intensity. Furthermore, these two low R&D industries make up a far higher proportion of New Zealand’s manufacturing added value than is the case overseas: 38% in New Zealand, 22% in the “reference countries” and even less for the OECD
average11.
R&D staff
levels
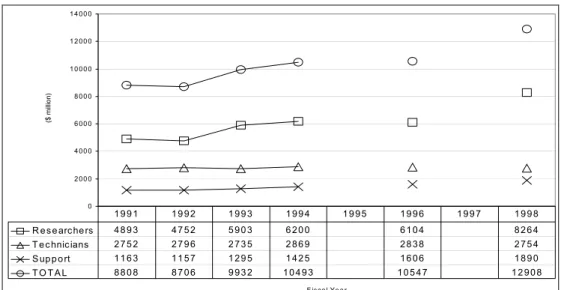
As with overall funding in New Zealand, the number of people involved in R&D work has risen over the last decade. This is especially the case with the number of researchers. Researchers made up 64% of all people involved with R&D in New Zealand in 1997/98, and their number grew 69% from 1990/91. The number of technicians, however, remained fairly constant over the period.
Figure 14: Full-time-equivalent R&D personnel
0 2 00 0 4 00 0 6 00 0 8 00 0 1 0 00 0 1 2 00 0 1 4 00 0 F iscal Ye a r ($ m illion) R e se archers 4 8 9 3 4 7 5 2 5 9 0 3 6 2 0 0 6 1 0 4 8 2 6 4 T e c hnicians 2 7 5 2 2 7 9 6 2 7 3 5 2 8 6 9 2 8 3 8 2 7 5 4 S up p o rt 1 1 6 3 1 1 5 7 1 2 9 5 1 4 2 5 1 6 0 6 1 8 9 0 T O T A L 8 8 0 8 8 7 0 6 9 9 3 2 1 0 4 9 3 1 0 5 4 7 1 2 9 0 8 1 9 9 1 1 9 9 2 1 9 9 3 1 9 9 4 1 9 9 5 1 9 9 6 1 9 9 7 1 9 9 8
Source: Ministry of Research, Science & Technology, 1999, p. 9
International data shows that, in the case of researchers, New Zealand is far closer to the OECD average than in the case with R&D expenditure. New Zealand had 4.5 researchers per thousand people in the labour force in 1997/98. This compares with an OECD average of 5.5 and an average for
the reference countries of 7.1.12 This partially reflects the fact that New
Zealand has a larger proportion of its R&D undertaken by universities than is the case with the OECD average, and universities tend to have both a greater proportion of their R&D expenses as wages and salaries and a greater proportion of their R&D staff as researchers.
11 The OECD unweighted average is 26%. However, with the values of the world’s two biggest economies (US and
Japan) being 15% and 14% respectively, the weighted average is likely to be a lot less.
3. How effective is the R&D spending?
Measuring
effectiveness
There is a growing body of evidence linking R&D to economic performance. This has led the OECD to state in a recent report that “innovation and technological change are without doubt the main drivers of economic
growth”.13 Studies show that there is typically a 10% to 20% rate of return to
the individual people and organisations making the R&D investment. The return to society as a whole from such investment is even higher, often
ranging between 20% and 50%.14
Unfortunately, it is very difficult to accurately measure the effectiveness of R&D, especially at a national level. At a micro level, R&D in a particular business may result in new products or processes, the net benefits of which can be estimated in terms of increased productivity or higher sales revenue. However, at a national level, it is impossible to specify useful measures that are not also affected by other factors. For example, R&D spending by businesses may result in increased productivity of the business sector, but other factors are also likely to impact on productivity (such as Government policy, the economic cycle, marketing efforts, and so on). There may also be long lag-times before the fruits of any R&D expenditure are obvious. R&D effectiveness cannot be measured by only one or a few indicators. The most appropriate approach is to use both qualitative measures (such as case studies and tracking the careers of scientists) and quantitative measures, and even this will only produce an indicative rather than exact measure. MoRST use a large array of indicators when measuring effectiveness.
Some
quantitative
indicators
Unsurprisingly, the few quantitative indicators that are publicly available give an incomplete and mixed picture.
Some of these partial measures show limited R&D success compared with other countries, in keeping with the low level of expenditure on R&D in New Zealand.
• New Zealand’s technology exports (such as industrial R&D services,
patents, and franchises) were equivalent to only 0.03% of GDP in 1995. This is well under the OECD average of 0.32% and ranks New Zealand
second lowest.15
• Industries classified by the OECD as being of high or medium-high
technology made up only 16% of New Zealand’s exports in 1996. This is below the OECD average of 63% and ranks New Zealand third lowest. However, these exports grew 18.2% between 1990 and 1996 in
New Zealand, compared with a 7.0% growth of the OECD average.16
Other partial indicators are more optimistic.
• The number of resident patent applications per 10,000 population was
4.2 in New Zealand in 1997. This compares with an OECD average of 5.3 and ranks New Zealand seventh highest. This figure grew 50% between 1991 and 1997 in New Zealand, compared with a fall of 4% for
the OECD average.17
13 OECD, 2000, p. 98. 14 OECD, 2000, p. 120.
15 OECD, 1999, OECD Science, Technology and Industry Scoreboard 1999, Paris, p. 171. 16 OECD, 1999, OECD Science, Technology and Industry Scoreboard 1999, Paris, p. 172 & 174. 17 OECD, 1999:2. p. 52.
• The number of scientific publications per 100,000 population was 80 in New Zealand in 1995. This is higher than the OECD average of 52 and ranks New Zealand tenth highest. The number grew 2.3% between 1990 and 1995 in New Zealand, compared with 4.1% growth of the
OECD average.18
Selected
references
Department of Industry, Science and Resources (Australia), 1999,
Measuring the knowledge-based economy: how does Australia compare?,
Canberra.
Ministry of Research, Science and Technology (New Zealand), 1999, New
Zealand research and development statistics 1997/98, Wellington.
Ministry of Research, Science and Technology (New Zealand) website:
www.morst.govt.nz
OECD, 1999, Basic science and technology indicators, OECD, Paris.
OECD, 1999:2, Main science and technology indicators, OECD, Paris.
OECD, 2000, Science, technology and industry outlook 2000, OECD, Paris
(especially chapter 3 “Innovation and economic performance”).
Statistics New Zealand, 2000, “Ch.15 Science and Technology”, New
Zealand Official Yearbook 2000, Wellington.
Andrew Morrison, Economist Research & Analysis Group Parliamentary Library For further information, contact Andrew (ext.9202)
Copyright NZ Parliamentary Library.
Except for educational purposes permitted under the Copyright Act 1994, no part of this document may be reproduced or transmitted in any form or by any means, including information storage and retrieval systems, other than by Members of Parliament in the course of their official duties, without the consent of the Parliamentary
Librarian, Parliament Buildings, Wellington, New Zealand.
APPENDIX: Vote Research, Science and Technolog y ap propriations for 2000/01 Output Class Appr opr iation ($000) Per cen t of Vote Pu rch as e Agent De sc ription Innov ation Goal: Accelerate kno w ledge creation
and the devel
op
ment of human capital, socia
l ca
pital,
learning systems and netwo
rks in order
to
enhance N
ew Zea
land’s capacity to innova
te.
Non-Specific Output Funding
(O2)
27,438
5.8
FRST
Funds the Crow
n Re sear ch Institutes as specif ied in th e r elev ant Ministerial instr uction . Marsden Fund ( O 1) 25,839 5.5 RSNZ Research out pu ts which bro aden and deepen the r esear ch skill bas e and s upport ex cellent resea rch in NZ, regardless of wh ether the res earch contr ibutes to the Government' s so cio-economic priorities. Research Contr act Man agement ( O 5) 11,211 2.4 HRCNZ FRST RSNZ Supports the cap ability of th e Cr own' s purch ase agents to negotiate, man age and m on itor r esear ch contracts, and provid e advice to the Min ister.
Supporting Promising Individuals (O3)
10,736 2.3 FRST HRCNZ MoRST RSNZ Supports the d ev elopment of hu man resources in re
search, science and
technolog y through award s and fellows hips . Th e re cipi ents incl ude pos t-doc tora l res earch ers , te ac hers and M aori res earch ers and techno logists. RS&T Policy A dvice (D1) 5,788 1.2 Provides policy advice on resear ch, scien ce and tec hnolog y. This includes inv estment strate gi es , t he performance and integration of th e i nnov ation s ystem, scientif ic technica l adv ice an d ministerial ser vices. Promotion of In novation Cultur e (O4) 3,060 0.6 CO MoRST RSNZ Prom otes values and at titud es supportive of an in novation cul ture in NZ. In tern ati onal links wil l b e develop ed to a cc es s the b es t inter nation al r es ear ch and r es ear chers , and to prom ote NZ res earch ov er seas . RS&T S
ystem Contract Man
agement (D2)
573
0.1
Negotiates, manages and
monito rs the Crown 's fu nding of scien ce and technolog y pu rchas e agen ts and negotiates and m onitors con
tracts with specif
ic s
cience and
technolog
y service prov
iders.
Science & Innov
ation Advisor y Council (D3) 550 0.1 Supports the SI AC, which cons ults with interest ed groups in th e community on scien ce and innov ation issues, and provides advice on po licies fo r scien ce and innovation to the governmen t. Economic Goal: Incr ease th e co ntribution o f kno w ledge to enhan cing the competitiveness of New Zealand en terprises. Research for In du str y (O7) 171,112 36.1 FRST Public good science and techno lo gy that im proves the com pet itiv
eness of the indus
trial s ec tor. New Econom y Research Fund I ndustr y (O6) 50 ,7 81 10 .7 F R S T Investigator-initiated re search that stimulates th e emergence and gr owth of new kno wledge-in tensiv e en te rprise s. Techno log y NZ (O8) 24,694 5.2 FRST Enhanc es th e t echnological cap ab ilit y of busin esses to grow throug h the dev elopm ent and adop tion of new techno logies. Gra nts for Priva te Se
ctor R&D (O9)
11, 800 2. 5 FRST Outputs will be co -funde d to stimula te priva te s ec tor inve stme nt in R&D in N Z, parti cular ly wi th in sm all to medium-sized firms. National Measur ement Stand ards (O10) 4,557 1.0 Provides specif ied stand ards to satisf y the needs f or traceable ph ysical measur em en t in NZ. 14
En vir on m en tal Goal: In crease knowledg e of th e environment an d of the biolog ical, ph ysical, so cial, economic an d cult ural fa ctor s that a ffect it i n order to estab lis h and mainta in a healthy
environment that sust
ains nature and people. Environmental Research (O14) 84,004 17.7 FRST Public good science and techno lo gy that
enhances the unders
tanding and man
agement of our environment. Social Goal: In crease know ledg e of th e socia l, b iol ogica l, en viro nmental, cu ltural, economic and physical determinants of w ell-b eing in or der to bu ild a society in w hich a ll N ew Zea landers enjo y health and ind ep endence and have a sens e of belo nging, identity a nd partnership. Health Research (O12) 33,434 7.1 HRCNZ FRST Public good science and techno lo gy that impr oves the health status of New Zealand ers. Social Resear ch (O13) 4,337 0.9 FRST Public good scien ce and techno lo gy that improves societal well b eing. Maori Knowled ge and Deve lop m ent Res earch (O11) 3, 99 0 0. 8 H R C N Z Public good science and techno lo gy that enhances Maori knowled ge and capability and contr ibutes to th e positive future d evelopm ent of Maori. FRST Convention Du Metre 86 0.0 Pay m ent of New Zealand 's
assessed subscription to the Conve
ntio n du Metr e in accordance with C abine t direc tives. TO T A L 47 3, 99 0 10 0. 0 Vote Resear ch, S cien ce and Tech nology has se pa
rate but compleme
ntary objectives of Maori ad vancement and Maori knowledge and development . Maori kno w ledge and development is about
ensuring the positive d
evelopmen t of Maori p eopl e and has a special pla ce in the s ocial goal. Mao ri advancement addresses the si gnifican t d isadv antage o f Maori compared to non -Maori in man y areas and is con cerned w ith
all four science goa
ls. Legend : FRST: Foundation for Research Science and Technolog y R S N Z : Ro ya l Societ y of New Zealand HRCNZ: Health Research Council of New Zealand C O : Carter Observator y Source: The Estimates of Appro priations for the Governmen t of New Zealand for
the year ending
30 June 2001
.