arXiv:1007.4101v1 [astro-ph.CO] 23 Jul 2010
UltraDeep HI observations with MeerKAT
Benne Willem Holwerda∗
Astrophysics, Cosmology and Gravity Centre (ACGC), Astronomy Department, University of Cape Town E-mail:holwerda@ast.uct.ac.za
Sarah-Louise Blyth
Astrophysics, Cosmology and Gravity Centre (ACGC), Astronomy Department, University of Cape Town E-mail:sarblyth@ast.uct.ac.za
The MeerKAT UltraDeep HI Survey aims to observe the 21 cm emission line of neutral hydrogen gas out to a redshift of z=1 and beyond. From both direct detections and stacked signal, we
will address the HI mass function, the cosmic neutral gas density of the Universe (ΩHI) and
their evolution over cosmic times, as well as galaxy evolution via e.g., the Tully-Fisher relation,
the relation between HImass and Hubble Type or stellar mass, and the Schmidt-Kennicutt
star-formation law. We propose to observe two fields, the COSMOS and Chandra Deep Field South (CDF-S) for 1000 hours each, adding an additional 4000 hours to one of these fields in 2015 when the full instantaneous bandwidth of MeerKAT (0.58-2.5 GHz) will be realised.
ISKAF2010 Science Meeting June 10 -14 2010
Assen, the Netherlands
The MeerKAT radio telescope (Karoo Array Telescope Jonas, 2007; de Blok et al., 2009; Booth et al., 2009), a precursor instrument for the Square Kilometer Array (SKA, Carilli & Rawl-ings, 2004) is currently under construction in the Karoo, South Africa The planned large bandwidth and high sensitivity will make MeerKAT the ideal instrument for high-redshift HIobservations
un-til SKA is built. The proposed MeerKAT Ultradeep HISurvey is designed to make optimum use of MeerKAT at each construction phase, in combination with existing surveys and a dedicated spectroscopic redshift survey with the Southern African Large Telescope.
Redshift 0.2 0.4 0.6 0.8 1.0 1.2 1.4 Right Ascention 1.0 0.5 0.0 0.5 1.0 Declination 1.0 0.5 0.0 0.5 1.0
Figure 1: A three dimensional representation of the Tier II datacube (5000 hours total). The field-of-view widens with redshift (z) resulting in the characteristic vuvuzela shape (D=0.8◦at z=0). MeerKAT LSST GOODS-S COSMOS Moon 30’ GEMS
Figure 2: The field-of-fiew of the MeerKAT (at z=0) with those of the Large Synoptic Synthesis Telescope
(LSST), approximately that of MeerKAT at z∼1, and
the Hubble Space Telescope deep fields of GEMS and GOODS on the CDF-S and COSMOS.
1. Observations: the Vuvuzela
The primary beam width of the 12m MeerKAT dishes increases with frequency and hence with redshift. As a result, a single pointing observation will cover a wider field-of-view at higher redshift, leading to a characteristic trumpet-like shape of the three-dimensional data volume, similar to a “Vuvuzela”1. Figure 1 gives an indication of the number and distribution of well-detected sources in the final 5000 hour combined observation.
We propose to do science with both direct detections and stacked spectra of objects. In the latter case, galaxy HI spectra are shifted to the same reference frame using the known positions and redshifts of these objects and then co-added (similar to Verheijen et al., 2007; Lah et al., 2007, 2009). Combined, the signal-to-noise can be increased to yield an average line strength and width for these objects (Figure 4). Different science questions can be explored this way but an existing spectroscopic redshift database is essential for successful stacking analysis.
The observational strategy is dictated by the proposed science case and the roll-out of the MeerKAT construction (Table 1), notably the expansion of available bandwidth after 2015. The choice of fields is guided predominantly by the availability of spectroscopic redshifts as well
as high-quality multi-wavelength data (Figure 6). Because of the much larger field-of-view of MeerKAT compared to other wavelength deep surveys, these observations are effectively an HI
component to a wealth of multi-wavelength observations at the center, surrounded by a blind, ul-tradeep HIsurvey (Figure 2).
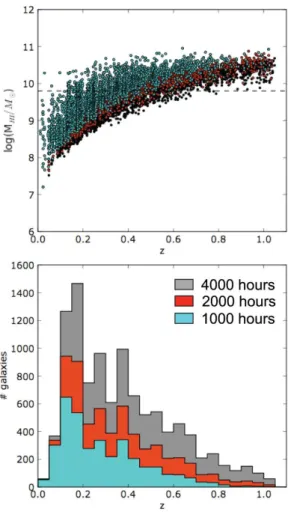
Figure 3: The 5σ detections for three different
in-tegration times as a function of redshift. Top panel
shows HImass versus redshift. The dashed line is
M∗
HI, our target for direct detections with the
ultra-deep observations (Tier II),
4000 2000 0 2000 4000 0.000 0.005 0.010 0.015 flux (mJy) z = 0.5 1000 hours 1000 coadded spectra 4000 2000 0 2000 4000 Velocity (km/s) 0.000 0.005 0.010 0.015 flux (mJy) 4000 hours z = 1.0 500 coadded spectra
Figure 4: Simulated stacking results (black lines)
for z=0.5 (top panel) and z=1.0 (bottom panel), (∆z=0.1). The grey lines are reference spectra created
by stacking the input spectra after shifting them by random redshifts. Galaxies were simulated
accord-ing to the Oxford S3 database (Obreschkow et al.,
2009b). For each redshift bin, the number of stacked spectra corresponds approximately to the currently available numbers of spectroscopic redshifts for the zCOSMOS survey.
2. Science
Our Proposed key topic of investigation is galaxy evolution over cosmic time. OUr headline goals are therefore to measure the distriution of neutral hydrogen in galaxies, the HImass function (HIMF) and the cosmic neutral gas density (ΩHI) as a function of redshift. The HIMF has to date
only been determined for z=0 (Zwaan et al., 2005), while the relation betweenΩHI and redshift is
Table 1: The goals of both observation phases of the MeerKAT Ultra-Deep HIField.
Survey Phases Tier I Tier II
(2013-2015) (2016 - ) MeerKAT specs: Bandwidth (GHz) 0.9 - 1.75 0.58 - 2.5 Redshift range (z) 0.0 - 0.58 0.0 - 1.4 Survey Parameters Fields 2 1
Observing time (hours) 2×1000 h +4000 h Spectroscopic redshifts
currently available:
full redshift range ∼10000 ∼1000 highest redshift bin ∼1000 (at z=0.6) ∼500 (at z=1) redshift limits for:
Direct Detection of M∗
HI z=0.4 z=0.6
ΩHI using stacking z=0.6 z=1.0
With the Tier I observations, we expect to observe galaxies with masses down to M∗ HI out to
redshift z=0.4 and to measureΩHI, using stacking, out to z=0.6, the limit of the initial bandwidth.
In Tier II, we aim to observe M∗
HI galaxies out to z=0.6 and anticipate that stacking will allow us
to get an estimate ofΩHIout to z∼1, depending on size of the spectroscopic redshift catalog and
noise characteristics of the MeerKAT.
Our secondary goal is to explore the evolution of galaxies though the HIline, aside from the
HIMF. The relation between stellar mass, Hubble type or stellar bar, and the HIcontent of galaxies as a function of look-back time can all be explored using both direct detections and stacked results. The wealth of multi-wavelength data, as well as the radio continuum, provide us with an estimate of the formation rate in these galaxies. The relation between gas-density and star-formation, the Schmidt-Kennicutt law, would need additional information on the molecular gas component in these galaxies. Atacama Large Millimetre Array (ALMA) observations would con-stitute an ideal complement for individual detections. Star-formation changes dramatically from z=1 to the present time (Madau et al., 1998; Hopkins, 2007), and the balance between and atomic and molecular hydrogen is the missing component to understanding the physics of the forma-tion and evoluforma-tion of disks over this time (Obreschkow & Rawlings, 2009b,a; Obreschkow et al., 2009a).
The Tully-Fischer relation between line width and luminosity (or stellar mass), can be explored using directly detected galaxies (Figure 5). The slope, scatter and normalization of this relation all depends on how rotationally supported disk galaxies assemble over the age of the Universe. We expect to dramatically increase the accuracy and the kind of T-F measurement at high redshift. The benefit of an HIlinewidth is that the atomic hydrogen disk probes the rotation curve well out to the point at which it flattens; the dynamics probe the whole halo mass for these galaxies.
1.0 1.5 2.0 2.5 3.0 7 8 9 10 11 12 M* log(Msun) 0<z<0.2 1.0 1.5 2.0 2.5 3.0 W50 log(km/s) 7 8 9 10 11 12 0.2<z<0.4 1.0 1.5 2.0 2.5 3.0 7 8 9 10 11 12 0.4<z<0.6
Figure 5: The Tully-Fisher relation: line width (w50) vs. stellar luminosity (mass), in three redshift intervals for solid detections (peak s/n>5σ) for three integra-tion times; 1000 (green), 2000 (red), and 5000 (black)
hours, based on the S3SAX catalogue (Obreschkow
et al., 2009b). The MeerKAT UltraDeep HI
obser-vations will be able to study the slope, scatter, and normalization of the Tully-Fisher relation over a wide redshift range in great detail.
Additional science are the serendipitous detection of neutral gas in the cosmic web or “dark", HI-only galaxies, an accurate count of OH megamasers, and a comparison between the distribution of HIemission and absorption.
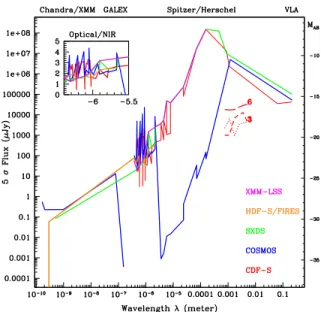
3. Complementary Data
The COSMOS and CDF-S fields have been observed across a broad range of wavelengths in great detail2. Figure 6 shows the limiting depth of observations as a function of wavelength. Both fields have ongoing spectroscopic redshift campaigns (Lilly et al., 2007; Balestra et al., 2010). Yet, because the multi-wavelength data does not cover the entire MeerKAT field-of-view, additional preparatory and follow-up observations will be necessary. Spectroscopic confirmation of the most distant and massive HIlines will be paramount to removing contamination from OH megamasers. The stacking results from the Tier II field will also improve with a larger accurate redshift catalogue. CO observations by ALMA will be needed to provide the molecular component of these distant galaxies.
Therefore, we anticipate a substantial observational effort (∼300 hours), with the Southern African Large Telescope (SALT) to generate a redshift catalogue in advance of Tier II observa-tions, as well as follow-up observations with ALMA, and a deep optical field with SkyMapper and subsequently LSST.
4. Concluding remarks
The MeerKAT UltraDeep HI survey (MUDHI3), will revolutionalise HI astronomy. For the
very first time, the atomic gas component of distant galaxies, individual and per population, will be accurately known since z∼1. The balance of MeerKAT capabilities, and the significant investment in observing time, will make this deepest HIfield a first instance of real SKA-type science before
the SKA is constructed.
2see e.g.,http://www.strw.leidenuniv.nl/~jarle/Surveys/DeepFields/index.html
Figure 6: The depth (5σflux level or limiting magni-tude) as a function of wavelength for five deep fields accessible in the Southern Hemisphere. The COS-MOS field stands out because of the low detection lim-its in the far-infrared but the Herschel Space Observa-tory is expected to obtain the deepest images on the CDF-S (dashed red lines, three different tiers of ob-servations, 1, 3 and 6). These new observations will have better resolution, bringing them in line with the MeerKAT resolution, as well as reach several mag-nitudes deeper than the COSMOS FIR observations. The Large Synoptic Survey Telescope will improve limits in the optical SDSS filters by several magni-tudes in its deep fields.
References
Balestra, I. et al. 2010, A&A, 512, A12+ Booth, R. S. et al. 2009, ArXiv e-prints Carilli, C. L., & Rawlings, S. 2004, New
As-tronomy Review, 48, 979
de Blok, W. J. G. et al. 2009, in Confer-ence Proceedings of the "Panoramic Radio Astronomy: Wide-field 1-2 GHz research on galaxy evolution", June 02 - 05, 2009 Groningen, the Netherlands
Hopkins, A. M. 2007, in Astronomical Soci-ety of the Pacific Conference Series, Vol. 380, Deepest Astronomical Surveys, ed. J. Afonso, H. C. Ferguson, B. Mobasher, & R. Norris, 423–+
Jonas, J. 2007, in From Planets to Dark En-ergy: the Modern Radio Universe. Octo-ber 1-5 2007, The University of Manchester,
UK. Published online at SISSA, Proceedings of Science, p.7
Lah, P. 2010, PhD thesis, ANU
Lah, P. et al. 2007, MNRAS, 376, 1357 —. 2009, MNRAS, 399, 1447
Lilly, S. J. et al. 2007, ApJ Suppl., 172, 70 Madau, P. et al. 1998, ApJ, 498, 106
Obreschkow, D. et al. 2009a, ApJ, 698, 1467 —. 2009b, ApJ, 703, 1890
Obreschkow, D., & Rawlings, S. 2009a, ApJ, 696, L129
—. 2009b, MNRAS, 394, 1857
Verheijen, M. et al. 2007, ApJ, 668, L9 Zwaan, M. A. et al. 2005, MNRAS, 359, L30