comScore ISP Speed Test Accuracy
by Peter SevcikMarch 2010
As part of a suite of tests tracking many aspects of users’ experiences on the Internet, comScore performs Internet service speed tests. The results of these speed tests are sold in the form of reports that document the relative rankings of ISP performance within markets. Recently, the FCC has used comScore speed test results as an absolute indicator of specific ISPs’ performance. This study analyzes the accuracy of the comScore speed test methodology, and assess the appropriateness of using the data to reach conclusions about the actual performance ISPs deliver to their subscribers. To fully understand the comScore speed test methodology and assess whether or not it accurately reflects the service delivered by broadband ISPs, the National Cable & Telecommunications Association (NCTA) retained NetForecast to perform an independent examination of comScore’s technical and statistical methodology, and to analyze the comScore data to assess whether it accurately reflects the performance of broadband ISPs. This report describes the comScore testing methodology and the findings of NetForecast’s investigation.
Executive Summary of Findings
NetForecast’s investigation of comScore’s ISP speed test methodology uncovered the following data gathering and data interpretation errors:
Data gathering errors
Only one TCP connection is used Client-server delay is variable
Participants’ computers may be resource constrained Test traffic may conflict with home traffic
Decimal math is incorrect
Protocol overhead is unaccounted for Data interpretation errors
Purchased speed tiers are incorrectly identified
All of the data gathering errors result in an underreporting of the actual speed delivered by an ISP on its network, and the individual errors create a compounding effect when aggregated in an individual subscriber's speed measurement. The result is that the actual speed delivered by each ISP tested is higher than the comScore reported speed for each result of every test. Although this report specifically addresses comScore’s testing methodology and data analysis, with a few exceptions noted in the report, other broadband user speed tests are also prone to the same data gathering errors.
The data interpretation errors discovered are important because they cause the test results to overstate the disparity between the median actual and maximum advertised speeds. The problem stems from a flaw in the method for determining the advertised speed that often incorrectly bumps subscribers to a higher speed tier than they actually purchased, and effectively penalizes the ISP for having surpassed its advertised speed. ComScore calculates the “average actual speed relative to the advertised speed” by dividing the consistently underreported speed delivered by a frequently inflated purchased speed. The combination of an inaccurately low numerator and inaccurately high denominator leads to a ratio that incorrectly shows ISPs delivering dramatically low performance relative to what they sold to their subscribers. The actual/advertised effective performance ratio based on this methodology is incorrect to such an extent that it is of extremely limited utility for determining the absolute value of a specific ISP’s speed performance.
NetForecast Report NFR5103
©2010
This report describes each source of inaccuracy in the context of how broadband Internet access services and the Internet in general operate. Broadband ISP technologies operate independent upstream and downstream channels; however, comScore only tests downstream speeds so this report focuses only on the downstream services.
comScore Speed Test Methodology
The architecture of the comScore speed test is shown in Figure 1. The test is
automatically initiated by the comScore client software on the comScore panelist’s PC every 18 hours. When the communications protocol stack is inactive, the client software connects to Akamai’s content delivery network which discovers the test PC’s location and assigns a server on the Akamai network for that test.
Figure 1 - comScore Speed Test Elements
ISP Identification
ComScore collects the IP address of each panelist machine, conducts a reverse DNS look-up to identify the domain associated with the IP address, and maps the domain to an ISP.
ISP Speed Test
ComScore’s client software performs a speed test with the goal of one test every 18 hours that a machine is connected to the Internet. The measurement is taken during a time when the machine has an active connection and the network stack indicates that the machine is idle. A single download speed test measurement consists of at most four steps, depending on the type of connection for the panelist’s machine.
Step 1
Two zero-byte tests are conducted to measure round-trip time and control for latency (delay).
Step 2
A 20KB file is sent to test if the machine is a narrow band or broadband machine. If the speed is less than 80Kbps, suggesting a narrow band connection, then no further testing is performed and the value for this preliminary test is registered as the speed test value.
Step 3
If the speed for this preliminary test is greater than 80Kbps, suggesting a broadband connection, a 512KB file is downloaded. If the speed for this second-tier test registers less than 500Kbps, then no further testing is
performed, and the value for this second-tier test is registered as the speed test value. Home WiFi net Internet ISP Modem Router Panelist PC Test Server HTTP File Transfer Akamai comScore Client Software
Step 4
If the speed for the second-tier test is greater than 500Kbps, a larger file is downloaded based on the following table, and the value for this third-tier test is registered as the speed test value:
Speed Range Detected Step 4 Test (rounded to nearest 100Kbps) File Size
500Kbps-1Mbps 1MB 1.1Mbps-2Mbps 2MB 2.1Mbps-3Mbps 3MB 3.1Mbps-4Mbps 4MB 4.1Mbps-5Mbps 5MB 5.1Mbps-6Mbps 6MB 6.1Mbps-7Mbps 7MB 7.1Mbps-8Mbps 8MB 8.1Mbps-10Mbps 9MB >10Mbps 15MB
Speed Read Formula
The following formula is used to calculate the speed read (i.e., test result) value.
Where:
SR = Speed Read (Mbps) TFS = Test File Size (MB) End = Test end time (seconds) Start = Test start time (seconds)
D1 = First zero byte delay test to Akamai server (seconds)
D2 = Second zero byte delay test to Akamai server (seconds)
Example
If a 15MB file (from above list in step 4) took 3.5 seconds to download (End - Start), and the minimum initial latency result is 0.5 seconds, then the results would be:
SR = (8*15,000,000)/(3.5 - 0.5) = 40,000,000 = 40.0 Mbps Statistical Trimming
Speed measurements can be grouped by ISP, region, weekday, day part and a variety of other dimensions for any period of time (month, quarter, 6 months, etc.). A speed test indicates the effective speed achieved by the machine in downloading a file of known size. It does not indicate the maximum or minimum speed achieved during the download session.
Speed test results within +/- 6 standard deviations of the group average are used for calculating measures. Any speed test results falling outside of that range are discarded. Advertised Speed Tier Identification
The advertised tier associated with any particular panelist is assigned based on advertised tiers for the relevant ISP. For ISPs that do not have power boost, comScore assigns a machine an advertised ISP tier based on the maximum speed read for the machine and publicly advertised tiers plus 10%. For example if an ISP had 5Mbps, 10Mbps and 15Mbps tiers, a machine with a 10.8Mbps maximum download speed would be assigned to the 10Mbps tier since it was within 10% of the maximum speed of the 10Mbps tier.
For Cox, Comcast, and Time Warner—ISPs which offer power boost—machines are assigned to an advertised tier based on the maximum power boost download speed
)
,
min(
8
SR
2 1D
D
Start
End
TFS
L
D
8MSS
,
L
1
BD
8W
1,
Bmin
min
ET
achieved during testing. For example, if an ISP had an advertised tier of 12Mbps with an advertised power boost download speed of 15Mbps, then machines with an
observed maximum speed up to 15Mbps would be put in the 12Mbps advertised tier. If that observed speed was higher than the advertised power boost download speed, then machines would be put into a higher speed tier.
Average Drop Off
ComScore defines the average drop off as the average speed measured divided by the advertised speed for each tier shown as a percentage. For buckets with multiple tiers, the drop off is a weighted average based on the number of speed reads in each tier. The comScore term "drop-off" does not reflect the percentage that measured speed was lower than advertized but rather reflects effective performance delivered. A "drop off" of 20% actually means that the service delivered 80% of the advertised rate.
Note: We have modified the comScore description to use unambiguous terminology: MB is Mega Byte (data size), Mbps is million bits per second (data transfer speed). ComScore uses MB to indicate both.
Only One TCP Connection is Used
The comScore testing methodology uses only one TCP connection between the Akamai server and the comScore client. A single TCP connection by nature has limited performance. This limitation exists at high, but not at low (e.g., dialup), speeds; however, the limitation becomes significant as broadband access rates increase. Distance, TCP window size, and packet loss make effective throughput lower than the bandwidth of the slowest link along the path. The reason for this hinges on the Automatic Repeat Request (ARQ) mechanism within TCP.
ARQ uses a sliding window to enable the sender to transmit multiple packets before waiting for an acknowledgement from the receiver. The idea behind the sliding window is to move more data at a time over the network to minimize network idle time.
The effective throughput for a single flow traversing a WAN is calculated using the following formula:
Where:
ET= Effective Throughput (bits/sec) B = Bandwidth (slowest link) (bits/sec) W = TCP Window size (bytes)
D = Round trip delay (RTT) (sec) L = Packet loss (>0) (fraction)
MSS = Maximum Segment Size (1460 bytes)
For a detailed description of this effect, see “Improving Effective WAN Throughput for Large Data Flows” [2].
Bandwidth: The bandwidth value in the effective throughput formula is for the slowest link in the path between the Akamai server and the panelist's PC. We assume that the subscriber's broadband access line is the slowest link; however, it's not always the case. TCP Window Size: The TCP window size range in most operating systems is 8KB to 64KB, and most servers support 64KB. The maximum window size in the original TCP protocol specification is 64KB—a number set in the 1970s when T1 circuits were the fastest available option. RFC 1323 describes a method for supporting larger receive window sizes. However, there has been limited adoption of RFC 1323 in the majority
of typical consumer Internet traffic flows due to the inertia of older implementations and inconsistent support at web servers and data centers.
While the commonly used 64KB TCP window size works well to synchronize data transmission with less than 5 Mbps capacity, it does not work well for higher capacity WAN connections. As circuit capacity increases, the time it takes to transmit the return ACK becomes increasingly important because the circuit remains idle while the source TCP waits for the ACK before it can send more data.
A faster circuit puts a window’s worth of data in flight faster and then must wait before sending more, so the percentage of idle time increases compared to a slower circuit. The faster the circuit, the more dramatically the ACK wait time lowers WAN
effectiveness because no data can be transmitted while the data and ACK are in flight. Delay: Round trip time (also known as latency) can have a tremendous range. This is because round trip is distance-related, and WAN distances over the Internet can sometimes be as great as 18,000 miles—two thirds of the way around the world. TCP Performance over Typical Service Tiers
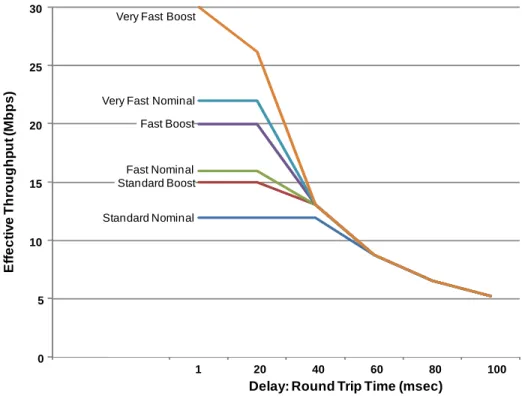
NetForecast modeled the effective performance of a single TCP connection using the bandwidth specified by typical cable ISP service tiers at an extremely low packet loss rate of 0.0001%. The TCP window size used in the calculations is 64KB, which is the default setting on most current Windows machines. The results are shown in Figure 2.
Figure 2 – Effective Throughput for One TCP Flow - 64KB TCP Window
Figure 2 shows that the delay-bandwidth product effect is very evident at high speeds. The important point is that comScore’s approach introduces delay variability from test to test because different Akamai servers may be assigned to each test. The slopes of the lines show that a small change in delay results in a large change in recorded
performance just at the “network near” 20 to 40msec range. It is difficult for Akamai to position a server to introduce less than 20msec of latency
0 5 10 15 20 25 30 1 20 40 60 80 100 Standard Nominal Standard Boost Fast Nominal Fast Boost Very Fast Nominal Very Fast Boost
Ef fe c ti v e Th ro u ghp ut ( M bp s)
How Power Boost Works
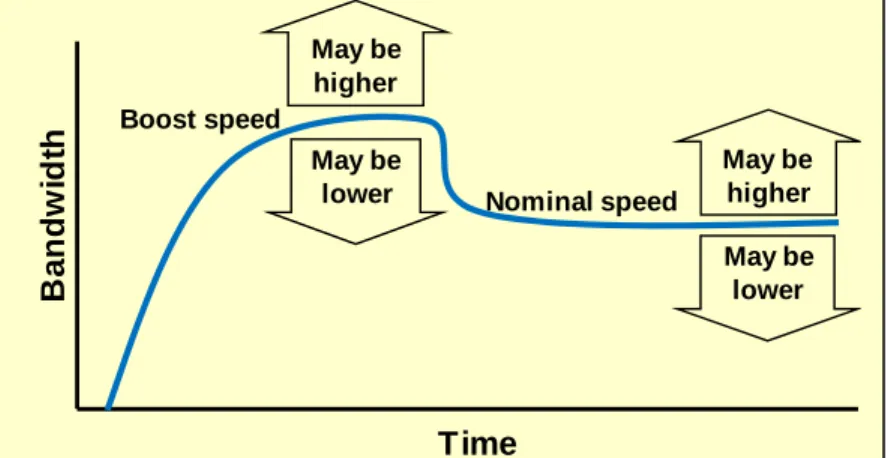
Boost service is a popular DOCSIS standard mechanism that provides higher performance than the nominal rate for a short duration. It is particularly helpful to the user at the start of the interaction with a media-rich website.
Boost technology provides all of the available bandwidth to a subscriber if: a) that subscriber has not exhausted his boost token bucket; and b) there is no traffic destined to another subscriber on that particular HFC interface (neighborhood) that consumes available bandwidth.
The token bucket is refreshed at the nominal rate whenever the subscriber is not using the downstream service. Each DOCSIS network leverages quadrature amplitude modulation (QAM) on a downstream RF channel of the cable plant. The maximum digital speed of a QAM is 38.8Mbps. This means that boost is sometimes capable of delivering nearly 38.8Mbps. Some cable-based ISPs offer very high speed downstream services achieved by bonding multiple QAMs.
The actual boost performance is a probabilistic distribution strongly driven by how much competing traffic exists in a neighborhood at any given time. The performance profile from boost to nominal speed is shown below. Time B a nd w idt h Boost speed Nominal speed May be higher May be lower May be lower May be higher
Why Buy More Bandwidth?
Figure 2 would appear to indicate that subscribers need not purchase high-speed service since they will rarely be able to take full advantage of the service if a server is distant. There are three important advantages to high-speed service. First, many applications open and operate multiple TCP connections in parallel so that they can sum the performance of each TCP connection. It is now standard practice that most new browsers open 4 to 6 connections per web page. Using multiple threads counteracts the negative effect of delay shown in Figure 2. Thus comScore’s use of a single thread is not only inconsistent with standard practice associated with newer web browsers, but it also disproportionately amplifies the effects of delay.
Second, there are applications and services that do not use TCP. For example,
streaming video can be delivered without the encumbrance of the TCP window mechanism.
Third, subscribers often have more than one user in their homes. Many U.S. households have several users as well as unattended machines that all access the Internet. Higher bandwidth supports the aggregate needs of these simultaneous users.
The Takeaway
The fact that comScore uses only one TCP connection for its speed test severely limits the accuracy of its results. Many speed test services operate multiple parallel TCP connections to more accurately and realistically measure ISP performance.
Client-Server Delay Is Variable
The speed test is initiated by a connection from the comScore client to Akamai. Akamai uses reverse DNS lookup to identify the ISP network the client is using. Akamai then assigns the “best” server to the client test. The best server may be the one closest to the client, resulting in the lowest network latency—or, it may be one that is relatively close, with spare capacity for the assignment. In general, Akamai’s service chooses a server that is close to the user's ISP network—but is not necessarily closest. The peering relationship with the panelist's ISP may be so complex that the test path introduces high delay. As discussed in the previous section, effective performance degrades when delay increases. There is no guarantee that the Akamai-client path is optimal for the speed test. In addition, variability is inherent in comScore’s testing because the test path changes over time as Akamai’s resources, Akamai’s traffic, Internet loads, and ISP peering arrangements change.
Participants’ Computers May Be Resource-Constrained
The speed test is performed by the same software used in all comScore measurements. It is installed by comScore panelists and operates without the panelist's intervention. There is no minimum requirement for a panelist computer (anyone can join), other than it must be a Windows machine.
The panelist's computer may have other software running during the test. In fact, comScore recruits panelists by providing them software such as screen savers that operate when the panelist is not actively using the network. The other software can reduce the computing resources available for the speed test.
Furthermore, accurately testing the high data rates now available from broadband ISPs requires a high-performance computer that is dedicated to the speed test task in order to properly take advantage of the bandwidth.
Test Traffic May Conflict with Home Traffic
Like most other speed tests, comScore’s tests are performed by software operating on a consumer's PC in a home setting. The typical home has a local network that often includes a Wi-Fi wireless LAN. This test configuration opens potential speed test errors.
The Wi-Fi network adds substantial delay to the client-server path. As explained above, additional delay degrades the TCP connection’s effective throughput.
Other PCs or machines may be directly connected or using the Wi-Fi network to access the Internet, and this competing traffic reduces the bandwidth available to the speed test. In the case of ISPs that provide boost rate services, the competing traffic can consume the speed boost token bucket, thus forcing the speed test into the nominal speed rate. (See box for speed boost
description.)
If the client is using a Wi-Fi network, the wireless path may be degraded by interference from adjacent Wi-Fi networks, cordless phones operating on the same unlicensed frequency, distance to the access point (and resulting signal strength), and other interference.
Decimal Math Is Incorrect
The comScore test files are defined in megabytes. Mega is a unit used in computers which count in binary. This is different than counting in decimal. One million bytes equals 1,000,000 while one megabyte equals 1,048,576. NetForecast was supplied with a copy of the 15MB file and found it to be 15,728,640 bytes which is 15 times the “mega” number and not the “million” number. Plugging the mega number into the speed read formula example described on page 3 yields an answer of 41.9Mbps. Although it may not sound like much, the difference between 40.0Mbps and 41.9Mbps is an error of -4.5%. A negative error indicates that comScore is underreporting true performance by that percentage. This decimal versus binary method of calculation introduces the -4.5% error consistently for all of the files in step 4.
Protocol Overhead Is Unaccounted for
Most PC-based speed tests use software that sits above the protocol stack. This software places files onto the stack or takes files from the stack. The protocol stack adds bytes to the traffic that must be transported by the ISP. This activity is, however, invisible to the software itself, so the application does not see what occurs in the transport and network layers to move the file.
To illustrate, let’s say you give a 1kg object to a shipping company to deliver. The object arrives safely at its destination, and you receive the shipping invoice. The invoice shows that you have been charged for a box, packing material and the additional weight they both add. The additional material that assured the object’s safe delivery was important and no one disputes its need or its cost.
The comScore speed test fails to account for the overhead that TCP/IP/Ethernet protocols add to the size of test files by the test PC and server. If the test executes perfectly under ideal conditions and none of the conditions described in this report occur, then the speed measured is approximately 4% lower than the speed of the ISP infrastructure delivering the content because of the bytes added by the protocol stack. A consumer PC-based testing organization such as comScore should know the protocols used in its test approach. For accuracy’s sake, a correction factor should be added to account for protocol overhead. The byte count should match what the ISP counts in its service definition.
Purchased Speed Tiers Are Incorrectly Identified
ComScore goes a step further than most speed testing services because it attempts to determine the advertised speed tier purchased by the subscriber for each panelist’s machine. All broadband access services supply a range of speeds known as service tiers. ComScore uses the advertised speed tiers for each ISP in each service footprint to determine the available options. The process assigns a tier to each panelist machine from the table of offered service tiers.
Table 1 shows typical cable-based ISP service tiers. It is important to note that since comScore only tests the downlink speed, only the two down columns are used. However, if a service footprint has enabled boost capability, the process uses only the boost column in the table.
Table 1
Typical Cable ISP Speed Tiers (Mbps)
Down Up Nominal Rate Boost Rate Nominal Rate Boost Rate Standard 12 15 2 3 Fast 16 20 2 4 Very Fast 22 30 5 7
ComScore’s speed test methodology assigns each panelist machine to the ISP service tier that they are believed to have purchased (although comScore has no direct knowledge of the speed tier to which the customer is actually subscribed). ComScore then calculates the effective speed delivered to a sample population based on the average speed measured across all samples divided by the assigned advertised tier speed. ComScore refers to this measure of how much less than the advertised speed is delivered as “drop off.” Determining the correct purchased speed tier is extremely important because it defines the denominator in the “drop off” formula.
Let us use the following example of the Standard tier that has the advertised down rates of 12Mbps nominal (base) and 15 Mbps boost. Assume there are five Standard
subscribers sharing the 38.8Mbps QAM channel. Subscriber 1 is a comScore panelist who has not used the service for a while (and no other user in his home has either). Subscribers 2 through 5 each use 4Mbps down, which is within their nominal Standard tier. The boost algorithm permits subscriber 1 to receive the remaining available bandwidth, which is 22.8Mbps during the boost period (38.8 - 4x4).
The comScore speed test will record a result that is lower than 22.8Mbps due to the errors in the methodology described in this report. However, it is likely that it will record a speed that is higher than 15Mbps.As a result comScore will incorrectly mark this panelist as having purchased the next highest tier of service, and then incorrectly report that such panelist did not meet his applicable advertised speeds.
Speed Tier Identification Flaws
ComScore’s speed tier identification has two major flaws. First, if any test within a reporting period is above the boost rate, the panelist’s PC will be marked with the next higher speed tier. Note that there is no margin for error at boost rate as there is at the nominal rate. However, as discussed earlier, the boost speed delivered by ISPs is not an exact value. This is not the ISP’s fault but rather a byproduct of the DOCSIS
specification.
Second, assignment into a service tier is made dynamically by comScore at the time the report is generated. Since reports often cover a long period, the odds of seeing higher-than-the-advertised boost speed only once are high. The panelist’s PC will execute a speed test every 18 hours. In a one-week reporting period, the PC will have performed 9 speed tests. However, in a month-long reporting period, the same PC will have performed 40 speed tests. Chances are high that one of the 9 tests in the week will be above the purchased speed tier. However, there is a much higher probability that at least one out of the 40 tests will incorrectly bump the user up to a higher speed tier. NetForecast estimates that it is highly likely that comScore incorrectly places many panelists' PCs into higher tiers than the subscribers purchased.
Subscriber Tier Inflation Evidence
Figure 4 illustrates the subscriber assignment shift to higher tiers using the comScore report [3] supplied to NetForecast. The report describes seven speed-tier buckets for the major US cable-based ISPs (Comcast, TWC, Charter, Cox, Cablevision, Bright House). There are two reports of this user population in the document. The first is for the six-month period of the first half of 2009 (240 tests per PC). The second is for the week ending September 15, 2009 (9 tests per PC).
Figure 4 - comScore Speed Tier Assignments for Cable ISPs
Figure 4 shows the distribution of observations (tests) for each of the tiers comScore used. The first stacked distribution bar is for the six-month period. It shows many users in high-performance tiers. The second stacked distribution bar is the one-week report. Note the dramatic increase in lower-speed tiers. The percentage arrows show the population shift for each tier. It is striking that all of the lower-speed tiers gained subscribers, while all higher-speed tiers lost subscribers. The overall shift is 17%. Clearly, the six-month report assigned too many subscribers to higher speed tiers because the probability that the ISP provided service faster than the advertised speed increased when the sample size increased.
Improper Service Identification Affects All Broadband Technologies
The comScore report incorrectly places subscribers into higher-than-purchased tiers for all broadband technologies, not just for cable. ComScore’s report shows that all high-speed tiers lost subscribers to lower-high-speed services when the sample size changed. Table 2 shows high-to-low-tier shifts of 17% for cable, 12% for DSL, and 16% for fiber between the six-month and the one-week views. Note that the one-week results also have subscribers assigned to the wrong tier, although not as many subscribers are incorrectly identified. 0% 10% 20% 30% 40% 50% 60% 70% 80% 90% 100%
Six Months +0.4% One Week
+3.6% +13.2% -2.9% -6.4% -4.8% -3.0% >20 Mbps 16-20 Mbps 12-15 Mbps 8-10 Mbps 3-7 Mbps 1-1.5 Mbps <1 Mbps
Table 2
comScore Shifts in Service Tier Assignments Cable
Comcast, TWC, Charter, Cox, Cablevision, BH
DSL
ATT, Verizon, Qwest,
Embarq Fiber ATT, Verizon comScore Tier Group Shift 6 mo. to 1 wk. comScore Tier Group Shift 6 mo. to 1 wk. comScore Tier Group Shift 6 mo. to 1 wk. < 1 Mbps 0% < 1 Mbps 5% 1.5-10 Mbps 16% 1-1.5 Mbps 4% 1-1.5 Mbps 7% 12-15 Mbps -7% 3-7 Mbps 13% 3-7 Mbps -9% 16-20 Mbps -8% 8-10 Mbps -3% 8-10 Mbps -3% >20 Mbps -1% 12-15 Mbps -6% >10 Mbps 0% 16-20 Mbps -5% >20 Mbps -3%
In 2009, broadband ISPs vigorously promoted triple-play bundles, most of which included higher-speed service to encourage adoption. NetForecast believes that as a result of these promotions, the percentage of customers buying higher-speed services grew rather than declined as the comScore data indicates. NetForecast believes that the decline reflected in the comScore data is due not to a market trend, but rather to errors in the comScore tier assignment process.
In each case showing 12% to 17% more subscribers in lower tiers in September relative to January through June, comScore’s reporting error is understated. The true error cannot be determined based on available information, but certainly a significantly higher number of subscribers are incorrectly identified by the drop off calculation. Statistical Nature of Packet Switching
comScore also incorrectly identifies subscriber-purchased service tiers because it fails to account for the fundamental way in which packet switching works. Packet
switching, on which the Internet is based, is a statistical technology that does not reserve capacity for a specific user. This permits highly efficient sharing of a scarce resource—bandwidth—across a large user population (neighborhood).
To understand how packet switching works, it is helpful to compare it to circuit switching, which underlies the telephone network. Circuit switching uses a call set-up process to reserve defined bandwidth for the duration of a call. If bandwidth between the two endpoints is insufficient, the call is blocked, and the caller receives an “all circuits are busy” message.
Unlike circuit switching, a packet-switched service does not use a call set-up process to establish a dedicated path between endpoints. Rather, it provides some bandwidth and statistically reshuffles the momentarily available bandwidth to all currently
communicating endpoints. Often an end-to-end connection is established using TCP as described above. The TCP connection is controlled by the endpoints, not the service provider. This control is a key feature of the “Internet end-to-end principle”—i.e., that endpoints (e.g., the consumer and website) play a significant role in how the
Since packet switching is a dynamic statistical service, an ISP must carefully engineer its systems to provide the advertised service at a capacity “design point.” This is the point at which shared resources can adequately accommodate expected traffic loads. Circuit-switched systems have an equivalent design point for call volume.
Any network (packet or circuit) is constantly operating within three performance zones: a) below the design point (more capacity than is currently being used); b) at the design point; or c) above the design point (the system is stressed and some subscribers will receive degraded performance). Table 3 illustrates the difference in performance delivered for a speed test machine (PC) under these three traffic conditions.
Table 3
Performance Delivered to the Next Subscriber Asking for Service (The speed test machine)
Traffic Condition Packet Switching Delivers
Circuit Switching Delivers
Below Design Point More than advertised
bandwidth Advertised bandwidth At Design Point Advertised bandwidth Advertised bandwidth Above Design Point Less than advertised
bandwidth
No bandwidth (new calls are blocked)
As this analysis shows, comScore’s methodology is well-suited to circuit-switched networks, but ill-suited to packet-switched networks like the Internet because it incorrectly assigns a substantial percentage of subscribers to higher-than-purchased speed tiers.
Conclusions
The effective service speeds comScore reports are low by a large margin because in its data calculations the numerator is too low (many errors result in under-reported performance) and the denominator is too high (many subscribers are placed in a performance tier higher than they purchased). The comScore speed test was originally designed for ISPs to compare their performance to one another in specific markets. NetForecast believes that although appropriate for its original use, it is inappropriate to use the inconsistent speed results in a non-relativistic way as an absolute value for the average drop off calculation because the combination of an improper numerator and often incorrect speed tier identification renders average drop off values questionable. How to Improve Speed Tests
Most speed test services share a common problem
—t
hey use a variant of the architecture shown in Figure 1. This architecture creates a long path between the tester's machine (his/her PC) and a test server somewhere on the Internet. The maximum speed that can be observed depends on the aggregate performance of all elements in the path. The list of elements is long, including: the PC, home network, ISP service, DNS services, backbone Internet service providers, content delivery networks, server access network, test server. In many cases the path includes more than one service provider for each category. The local broadband ISP under test is one of approximately ten suppliers in the path. Measurements that include 10 players and focus the result on only one of the 10 are ill-advised.Most speed tests are actually a measure of the “Internet experience” as seen when a user connects to a website. The comScore speed test aims to track the user experience. The client software is present on all Internet sessions. By design it must be a light-weight and unobtrusive monitor of Internet activity. Many of the design choices in the speed test reflect this light-touch approach. The resulting design, although useful for constantly tracking user behavior, is not effective for testing local broadband service. Proper broadband access services speed testing requires eliminating elements in the path that are not germane. The focus must be the ISP access line. Furthermore, the test design must account for how the specific access technology operates, and the test equipment must be sufficiently powerful to properly and reliably stress the speed of the access line. Consistently and reliably pumping 50Mbps even for a few seconds is not a light-touch event. It is an infrequent but effective and non-destructive “hammer blow” to the system under test.
It is essential that ISP speed tests be thoroughly understood and that their results are truly representative and accurate. The industry should define standardized and transparent targeted methodologies for ISP speed testing and foster their widespread adoption.
About the Author
Peter Sevcik is a Principal of NetForecast and is a leading authority on Internet traffic, performance and technology. Peter has contributed to the design of more than 100 networks, holds the patent on application response-time prediction, and pioneered many performance management techniques including Apdex. At BBN Peter played a pivotal role in the development of the Internet. He can be reached at
peter@netforecast.com.
Sources and References
The description of the comScore methodology is based on: documentation [1] received from comScore; a November 30, 2009 meeting with Brian Jurutka at comScore headquarters in Reston, Virginia; and subsequent email exchanges in which comScore answered NetForecast’s questions.
1. “ISP Speed Test Methodology – October 2009,” Methodology tab in an Excel spreadsheet from comScore.
2. “Improving Effective WAN Throughput for Large Data Flows,” by Peter Sevcik and Rebecca Wetzel, November 2008, NetForecast Report 5095.
3. “comScore_Comcast_Speed_FCC_data_20091112 Option B,” name of Excel spreadsheet file from comScore.
NetForecast helps enterprises and vendors understand and improve the performance of networked applications.
Additional information is available at:
www.netforecast.com
NetForecast and the curve-on-grid logo are registered trademarks of NetForecast, Inc.
NetForecast helps enterprises and vendors understand and improve the performance of networked applications.
Additional information is available at:
www.netforecast.com
NetForecast and the curve-on-grid logo are registered trademarks of NetForecast, Inc.