9HSTFM
G*agdah
c+
ISBN 978-952-60-6307-2 (printed) ISBN 978-952-60-6308-9 (pdf) ISSN-L 1799-4934 ISSN 1799-4934 (printed) ISSN 1799-4942 (pdf) Aalto UniversitySchool of Electrical Engineering
Department of Electrical Engineering and Automation www.aalto.fi BUSINESS + ECONOMY ART + DESIGN + ARCHITECTURE SCIENCE + TECHNOLOGY CROSSOVER DOCTORAL DISSERTATIONS A a lto -D D 1 0 4 /2 0 1 5
The implementation of price and network based demand response programs, the pervasiveness of electric vehicles, the increasing installation of DGs, the rising customer load base of urban areas and other emerging factors are creating a distribution network loading curve which is stochastic in nature and previously unseen in shape. This thesis unravels the real-time dependencies among active distribution network
component thermal states, customer loads and distributed generation on their common environmental variables such as wind speed and solar irradiation. Through the dynamic thermal modeling of network components, the work has unlocked their real-time capacities. The introduction of real-time thermal rating in an active distribution network management system enhances the loading capacity significantly compared to static rating. This has been revealed through an increased utilization of installed DGs and through better integration potential of additional DGs. M er k eb u Z en eb e D eg ef a R ea l-tim e t h er m al s ta te a n d c o m p o n en t l o ad in g e st im at io n in a ct iv e d is tr ib u tio n n et w o rk s A a lt o U n iv e rs it y
Department of Electrical Engineering and Automation
Real-time thermal state and
component loading
estimation in active
distribution networks
Merkebu Zenebe Degefa
DOCTORAL DISSERTATIONS
Aalto University publication series DOCTORAL DISSERTATIONS 104/2015
Real-time thermal state and
component loading estimation in active
distribution networks
Merkebu Zenebe Degefa
A doctoral dissertation completed for the degree of Doctor of Science (Technology) to be defended, with the permission of the Aalto University School of Electrical Engineering, at a public examination held at the lecture hall S4 of the school on the 7th of September 2015 at 12:00.
Aalto University
School of Electrical Engineering
Supervising professor Professor Matti Lehtonen Thesis advisor
Professor Matti Lehtonen Preliminary examiners
Assoc. Prof. Sami Repo, Tampere University, Finland Dr. Sasa Djokic, The University of Edinburgh, UK Opponents
Prof. George J. Anders, Lodz University of Technology, Poland Dr. Sasa Djokic, The University of Edinburgh, UK
Aalto University publication series DOCTORAL DISSERTATIONS 104/2015 © Merkebu Zenebe Degefa
ISBN 978-952-60-6307-2 (printed) ISBN 978-952-60-6308-9 (pdf) ISSN-L 1799-4934 ISSN 1799-4934 (printed) ISSN 1799-4942 (pdf) http://urn.fi/URN:ISBN:978-952-60-6308-9 Unigrafia Oy Helsinki 2015
Abstract
Aalto University, P.O. Box 11000, FI-00076 Aalto www.aalto.fi AuthorMerkebu Zenebe Degefa
Name of the doctoral dissertation
Real-time thermal state and component loading estimation in active distribution networks Publisher School of Electrical Engineering
Unit Department of Electrical Engineering and Automation
Series Aalto University publication series DOCTORAL DISSERTATIONS 104/2015 Field of research Power Systems and High Voltage Engineering
Manuscript submitted 7 April 2015 Date of the defence 7 September 2015 Permission to publish granted (date) 22 July 2015 Language English
Monograph Article dissertation (summary + original articles)
Abstract
Highly stochastic loading and distributed generation in the emerging active distribution networks means that electric utilities need to deploy intelligent network management tools in order to use their assets to the fullest. Real-Time Thermal Rating (RTTR) provides the possibility for short term and even real-time active distribution network management, enabling the network to run closer to an overload state without damage. In this dissertation, pertinent developments and proposals are presented in three stages on the path towards the development of a real-time monitoring and operation system for active distribution networks.
The first stage is the development of distribution network component thermal models for real time implementation. In this dissertation, a numerical model of the air-gap convective heat transfer for underground cable installations inside unfilled conduit is developed. In addition, a dynamic thermal model is developed for prefabricated secondary substation cabins. The most dominant but difficult to solve heat transfer mechanism, natural convection, is modelled by introducing the stack effect principle into the problem. Measurements from a scaled model of prefabricated substations, measurements from actual cabins and 3D Finite Element Method (FEM) simulations are used to validate the numerical model.
In the second stage, this dissertation explores the usability of customer level automatic meter reading (AMR) measurements for distribution network state estimation and for load forecasting applications. A method to forecast substation level loads with their respective confidence intervals using hourly AMR metered customer level consumptions is presented. The forecasting and monitoring of a distribution network in real-time can be met with the modeling of classified type load classes. However, it requires careful incorporation of the necessary factors, such as within-group and between-group correlations of customer classes.
Binding the aforementioned findings, in the third stage, a framework for day-ahead hour-by-hour thermal state forecasting and thermal ratings of distribution network components is proposed and studied. This work has demonstrated that up to three hours ahead thermal state forecasting of an active distribution network can be achieved with an acceptable level of accuracy. In this dissertation, the benefits and practical implications of the real-time thermal rating are investigated. The introduction of real-time thermal rating in an active distribution network management system enhances the loading capacity significantly compared to static rating. This has been revealed through an increased utilization of installed DGs and through better integration potential of additional DGs.
Keywords Active Network Management, Demand Response, Distributed Generation, Load Forecasting, Natural Convection, Prefabricated Substation, Real-time Thermal Rating, State Estimation, Smart Meters
ISBN (printed) 978-952-60-6307-2 ISBN (pdf) 978-952-60-6308-9
ISSN-L 1799-4934 ISSN (printed) 1799-4934 ISSN (pdf) 1799-4942 Location of publisher Helsinki Location of printing Helsinki Year 2015
v
Acknowledgements
First and foremost, I thank God, he who knows the worthy in life and he who led me beside the still waters.
My supervisor, Prof. Matti Lehtonen, has been guiding me academically and consulting me as dear friend throughout the major developments in life, which in my case coincided with the doctoral study period. He believed in me perhaps more than the doubts I have in myself. He gave me the opportunities to flourish professionally. Simply, he is a good person I shall thank dearly.
I would like to thank the diligent and enthusiastic pre-examiners, Prof. Sami Repo from Tampere University and Dr. Sasa Djokic from The University of Edinburgh, for giving insightful, honest and constructive feedback on my doctoral thesis.
During my doctoral study at Aalto University’s power systems and high voltage engineering laboratory, I was privileged to get to know and work with esteemed colleagues. Dr. John Millar is a person to whom I am greatly indebted for. I would especially like to thank Dr. John for proofreading most of my publications and the doctoral thesis. Professionally, he has been co-author in most of my publications in which he generously passed the torch of ‘dynamic thermal modelling of cables’. As a friend, he taught me the wisdom in humility through the candid discussions on issues ranging from ‘climate change’ to the question ‘why is the British Parliament always so rowdy?’
My collogue, Matti Koivisto, used to whip my forecasting and estimation figures and methods to get them in line with standard statistical principles. I am benefited from the discussions we had on the smart meter data as we were among the first who laid hand on hourly metered consumption data. I am grateful to work with Humayun Muhammed (former officemate and friend), Dr. Amir Safdarian and Ali Mubbashir with whom I had quality technical discussions in the coffee room. I would like also to thank my current officemate Antti Alahäivälä for the nice discussions we had on social and technical issues. I owe a debt of gratitude to the former and current members of High Voltage Engineering Laboratory at Aalto University. Dr. Petri Hyvönen, Tatu Nieminen, Veli-Matti Niiranen, Jouni Mäkinen and Ari Haavisto are the colleagues I am hugely indebted for. Especially, Tatu Nieminen, took my experiment plan as his own and helped me to build the scale down model of prefabricated secondary substations.
My stay at power systems and high voltage engineering laboratory was made memorable with current and former members. I would not pass this opportunity without mentioning some of their names. Dr. Shafiq Muhammad, Dr. Muzamir Isa, Dr. Michael Omidiora, Dr. Eero Saarijarvi, Dr. Rafi Adzman, Dr. Zoko Ble, Dr. Kutt Lauri, Dr. Kluss Joni, Hussain Amjad, Bruno Sousa, Mahmood Farhan and Malik Farhan have been integral part of my professional and private life.
We humans are highly dependent and positively influenced by our families. One cannot just thank his parents and settle, one has to love and care them back. Nevertheless, the only way one can declare what he owes his families on paper is by writing about it. I would like to thank my diligent and big hearted mother, Tsige Demese and principled
father, Zenebe Degefa. I would like to extend appreciations to my big brother Aynalem Zenebe and two little sisters Beza Zenebe and Meron Zenebe.
Most importantly, the gracious God have blessed me with a kind hearted wife, Yordanos Tibebu, without whom my life would have been complicated and less bearable. With me, she have been equally ridding through the stresses with paper submission deadlines and pre-examination processes. Yordiye, I love you and I shall not stop admiring your persistence, forgiving heart and sheer purity. The merciful God filled my life with joy when he gave us our son, Noah Merkebu. Noah, you are my joy and you made me love life itself more. Grow up in wisdom and stature and in favour with God and men!
Merkebu Zenebe Degefa Espoo, Finland
vii This work is dedicated to the soul of my grandmother Yeshihareg Birke Woldemeskel (Emaye).
Contents
Abstract ... iv Acknowledgements ... v Contents ...viii List of Publications ... x Author’s Contribution ... xiList of Abbreviations ...xiii
List of Symbols ... xv
1 Introduction ... 1
1.1 Background ... 3
1.2 Contributions of the thesis ... 5
1.3 Structure of the thesis ... 7
2 Dynamic thermal modelling ... 8
2.1 Thermal-electric analogy ... 9
2.2 Overhead lines ... 11
2.3 Underground cables ... 11
2.3.1 Horizontal circular concentric cylinders ... 13
2.3.2 Horizontal circular eccentric cylinders ... 13
2.3.3 Tilted cylinder (Raithby and Hollands) ... 14
2.3.4 Air-gap heat transfer: Natural convection ... 15
2.3.5 Concentric vs eccentric approximation ... 15
2.3.6 Simulation and measurement results ... 17
2.4 Transformers and prefabricated substations ... 22
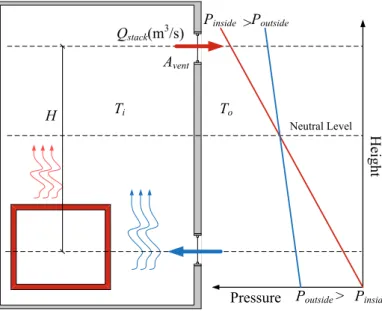
2.4.1 Stack effect ... 24
2.4.2 Simulation and measurement results ... 25
3 Load and distributed generation forecasting ... 32
3.1 Smart meter data for load modelling ... 33
3.2 Inter- and Intra-class correlations and standard deviations ... 35
3.3 The test distribution network (NTK#1) ... 40
3.4 Composite load deviations for aggregated loads ... 42
3.5 Day-ahead load forecasting ... 45
3.6 Weather variable forecasting ... 48
3.7 Wind turbine model ... 51
ix
3.9 Network component thermal state estimation and forecasting ... 53
4 Formulating the RTTR algorithms ... 58
4.1 Real-time thermal rating ... 58
4.2 The RTTR framework for increased utilization of DGs ... 62
4.2.1 OPF plus RTTR formulation ... 66
4.3 The RTTR framework for CVC involving DGs ... 68
4.3.1 Distribution system voltage regulation devices ... 70
4.3.2 Optimal Day-Ahead CVC Formulation ... 72
4.3.3 Objective functions ... 74
4.3.3.1 Loss minimization ... 74
4.3.3.2 Voltage penalty function objective ... 74
4.3.3.3 The equality constraints: ... 75
4.3.3.4 Inequality constraints: ... 75
4.4 The test distribution network (NTK#2) ... 77
5 Results and discussions ... 78
5.1 Role of RTTR in increasing the utilization of DGs ... 78
5.2 Role of RTTR for CVC ... 83
5.2.1 Simulation results ... 85
5.2.2 Discussions on Practical Implementations ... 88
6 Summary and Future Prospects ... 90
6.1 Summary ... 90
6.2 Future Prospects ... 92
List of Publications
This thesis consists of an overview of the following seven publications, which from here on are referred to as Roman numerals in the text:
I Degefa, M. Z., Lehtonen, M. and Millar, R. (2012). Comparison of
Air-Gap Thermal Models for MV Power Cables Inside Unfilled Conduit. IEEE Trans. Power Delivery, 27(3), pp.1662-1669.
II Degefa, M. Z., Millar, R., Lehtonen, M. and Hyvonen, P. (2014). Dynamic Thermal Modeling of MV/LV Prefabricated Substations. IEEE Trans. Power Delivery, 29(2), pp.786-793.
III Degefa, M. Z., Millar, R., Koivisto, M., Humayun, M. and Lehtonen, M.
(2013). Load Flow Analysis Framework for Active Distribution Networks Based on Smart Meter Reading System. Engineering, 05(10), pp.1-8.
IV Degefa, M. Z., & Lehtonen, M. (2013). Stochastic Characteristics of Load Profiling in Distribution Systems Based on AMR Measurements. International Review of Electrical Engineering, 8(6), pp.1833-1842
V Degefa, M. Z., Koivisto, M., Millar, R. J. and Lehtonen, M. (2014).
Dynamic thermal state forecasting of distribution network components: For enhanced active distribution network capacity, 13th International Conference on Probabilistic Methods Applied to Power Systems (PMAPS 2014), Durham, UK, 7 - 10 July, 2014.
VI Degefa, M. Z., Humayun, M., Safdarian, A., Koivisto, M., Millar, R. J.,
and Lehtonen, M. (2014). Unlocking distribution network capacity through real-time thermal rating for high penetration of DGs, Electric Power Systems Research, 117(C), pp. 36-46.
VII Degefa, M. Z., Lehtonen, M., Millar, R. J., Alahäivälä A., and Saarijärvi, E. (2015) Optimal Voltage Control Strategies for Day-Ahead Active Distribution Network Operation, Electric Power Systems Research, 127, pp. 41-52.
xi
Author’s Contribution
I The author Merkebu Degefa had the main responsibility for planning the work, interpretation of the results and writing the publication under the supervision of Prof. Matti Lehtonen and D. Sc. (Tech.) John Millar.
II The author Merkebu Degefa had the main responsibility for planning the work, interpretation of the results and writing the publication under the supervision of Prof. Matti Lehtonen and D. Sc. (Tech.) John Millar. The laboratory measurement was planned together with D. Sc. (Tech.) Petri Hyvonen and he has also assisted in the interpretation of the IEC standards.
III The author Merkebu Degefa had the main responsibility for planning the work, interpretation of the results and writing the publication under the supervision of Prof. Matti Lehtonen. D. Sc. (Tech.) John Millar provided the Greenfield test distribution network utilized in the paper and Matti Koivisto assisted in the autoregressive model for load forecasting. Muhammad Humayun has contributed through discussions and comments throughout the analysis.
IV The main idea is developed by Merkebu Degefa and Prof. Matti Lehtonen. Merkebu Degefa had the main responsibility for writing the publication under the supervision of Prof. Matti Lehtonen.
V Merkebu Degefa had the main responsibility for planning the work, interpretation of the results and writing the publication. D. Sc. (Tech.) John Millar has provided the Greenfield network plan and also contributed through comments and discussions throughout the study. Matti Koivisto developed the statistical method for wind speed, solar irradiation, ambient temperature and soil temperature forecasting using the ARIMA model. Prof. Matti Lehtonen has supervised the work and contributed through comments and suggestions.
VI The author Merkebu Degefa had the main responsibility for planning the work, interpretation of the results and writing the publication under the supervision of Prof. Matti Lehtonen. Dr. Amir Safdarian has contributed with the development of the Optimal Power Flow formulation. Dr. Amir Safdarian and Muhammad Humayun have strongly contributed through discussions and comments during the work. Matti Koivisto has contributed in the wind turbine and solar panel models. D. Sc. (Tech.) John Millar provided the Greenfield test active distribution network and has also contributed through discussions, comments and proof reading of the final draft paper.
VII The main idea is developed by Merkebu Degefa and Prof. Matti Lehtonen. The author Merkebu Degefa had the main responsibility for planning the work, interpretation of the results and writing the publication under the supervision of Prof. Matti Lehtonen. D. Sc. (Tech.) John Millar and Eero Saarijärvi developed a typical active distribution network utilizing a network planning algorithm and GIS interface. Anti Alahäivälä has contributed through comments and discussions during the analysis.
xiii
List of Abbreviations
ACF autocorrelation function
AMR automatic meter reading
ARIMAX auto regressive moving average with exogenous variable
CDA conditional demand analysis
CDF cumulative distribution function
CVC coordinated voltage control
DE direct electric heating system
DG distributed generation
DIST district heating system
DMS distribution management system
DR demand response
DTR dynamic thermal rating
EMS energy management system
FEM finite element method
GAMS general algebraic modeling system GSHP ground source heat pump heating system
HDPE high-density polyethylene
LDPE low-density polyethylene
LV low voltage
MACT maximum allowable conductor temperature MAPE mean absolute percentage error
MAS multi-agent system
MV medium voltage
NAE normal absolute error
OLTC on-load-tap-changer
OPF optimal power flow
PV photovoltaic
RRMSE relative root mean squared error
RTTR real-time thermal rating
STORE electric storage heating system
SVC static VAR compensator
VAR volt ampere reactive
xv
List of Symbols
Symbols
Description
Ǧ ሺʹሻ
ܥ݀
ܿ௨ௗ Specific heat of the fluid ሺ Ǥ Τ ሻ
ሺ Τ ଷǤ ሻ
ሺሻ
ܨ Ambient view factor
ܨܨ
ܨ௧ ሺ ሻ
݃ Gravitational constant ሺ Τ ሻଶ
ܩ ሺȀʹሻ
ܩ Mutual irradiation going to other boundaries
ܩ Grashof number
ܩ ሺȀʹሻ
݄௩ Convection heat transfer coefficient ሺ Τ ଶሻ
݄ Radiation heat transfer coefficient
ܫ௦ ሺሻ
݇ Fluid thermal conductivity ሺ Ǥ Τ ሻ
ܮ Characteristic dimension, length, width or diameter ሺሻ
ܰݑ Nusselt number ܰ ܰீ ܰை் ǮǦǦǯ
Symbols
Description
ܲ௧൫ܳ ௧൯ ሺ ሻ ܲ௧൫ܳ ௧൯ ሺ ሻ ܲ௦௧൫ܳ ௦௧൯ ሺ ሻ ܲ Prandtle number ܳ௦௧ ሺ͵Ȁሻ Ra Rayleigh number ܵ ሺȀ ʹሻ ܶ ሺᤪሻ ܶ ሺሻ ܶ ሺሻ ܸ௧ ܸ ሺሻ ¢ Thermal diffusivityȾ Fluid thermal expansion coefficient ሺͳ Τ ሻ
Ɂ୲୧
Ʌ
Ԃ
Ʌ୧୨
Ɋ Dynamic fluid viscosity
ɏ୪୳୧ୢ Fluid density ሺ Τ ଷሻ ɏത୧୧ Ǧ ߩ ɏത୧୨ Ǧ ߪ Stefan-Boltzmann constant ( Τ ଶସ) ߪ ߪଶ
1
1 Introduction
An increasing number of renewable energy resources are being installed in distribution systems. Larger units, usually above 10MW, are installed by commercial power producers and are connected to transmission facilities. Smaller units, which are no larger than 1 or 2 MW are, however, installed in distribution systems and are referred to as ‘Distributed Generation’ (DG) [1]. It is anticipated that with the proliferation of DG some distribution networks will face power flow congestion due to the thermally vulnerable components restricting the connection capacity and active energy yield of DG [2]. In conjunction with aging infrastructure and limited financial budgets for network reinforcement, the rapid growth of DGs is pressuring network operators to turn to real-time monitoring and operation solutions for distribution systems which potentially unleash the hidden capacities. Also, due to the increasing installation of DGs, switching operations reconfiguring feeders will be common in distribution systems, making the real-time thermal state monitoring of network components more expedient [3].
In general, to increase DG connectivity and to harness the generated renewable energy efficiently, there is a need for active dynamic distribution management systems (DMS). It is also in the interest of distribution network operators (DNO) to increase asset utilization in a safe manner, potentially allowing latent capacity to be used under strictly controlled conditions [2]. Traditionally, the main task of distribution system analysis tools has been to solve the power flow for one specific point in time, which is the predicted peak demand. Also, as a common practice, the thermal limits applied by DNOs tend to be based on fixed or assumed meteorological conditions that are not always accurate representations of the actual operating conditions [4], the result of which is potentially a conservative constraint on power flows. In place of the rigid capacity planning rules, the network operation planning process needs to incorporate more detailed and real-time simulations of capacity constraints. Hence, dynamic thermal models are expected to be a strong component in an active distribution network management system.
In this regard, the application of continuously changing (rather than seasonal) ratings, which can be updated in real-time, could enable generators to enhance their energy export, defer network reinforcement and also allow increased access to distribution networks for weather dependent forms of generation. Integrating real-time thermal rating in active power flow management schemes has been a research topic among the power systems
research community for a long time. EPRI’s dynamic thermal circuit rating system released in early 1999, was among the first efforts which attempted to realize the higher equipment utilization offered by dynamic thermal rating [5]. Another methodology to forecast the real-time thermal rating of overhead lines, presented in [6], promises enhanced network operator decision making capabilities regarding network power flow management.
In [7], in addition to investment options such as substation or feeder expansions, installations of new DGs are presented as alternatives for utilities to solve network capacity limits. Nevertheless, it is also mentioned in [7] that on shorter feeders the ampacity limits could prohibit the utilization of economically beneficial DG installations. In [8], it is demonstrated that without careful engineering assessments, increased DG installations may have adverse system effects, such as exposing system and customer equipment to potential damage. The optimization of power output from DGs within a distribution network while maintaining thermal limits is proposed in [9]. In [10], a day-ahead scheduler which considers capacity limits, in the form of a specific upper bound to the current amplitude, is proposed. The scheduling procedure in [10] solves a non-linear multi-objective problem for the optimization of distributed resource production during the following day. A thermal state estimation based DG output control algorithm for a wide area network power flow control is proposed in [11]. The study in [11] verifies that the real-time rating system is able to estimate conductor temperature with an average error in the range of -2.2ºC to +1.4ºC.
Despite the numerous studies, the relationship between thermal states and stochastic DG generation has not been studied or quantified adequately in active distribution systems. Due to the variations in thermal time constants among overhead lines, underground cables and transformers, the thermal responses also differ accordingly. Hence, a look into the entire distribution network is necessary to identify potential bottlenecks with increased installations of DG. Up to day-ahead hour-by-hour thermal capacity limit forecasting and real-time thermal rating frameworks entirely based on thermal, DG and load models are presented in this thesis. The contribution extends also to the quantification of the benefits of real-time thermal rating (RTTR) for the efficient utilization and increased integration of DGs. The RTTR technique is simulated on two typical Finnish medium voltage (MV) test networks: NTK#1 in Section 3.3 and NTK#2 in Section 4.4.
The implementation of price and network based demand response programs, the pervasiveness of electric vehicles, the increasing installation of DGs, the rising customer load base of urban areas and other emerging factors are creating a distribution network loading curve which is stochastic in nature and previously unseen in shape. Hence, static distribution network rating is no longer a good enough network management tool. Rather, utilities need to adapt to the dynamism of load and generation behavior by applying programs such as RTTR for efficient and secure network operation.
3 The contribution of this thesis is in the improved analysis required for the development of RTTR systems for active distribution networks. The first research problem is the absence of non-conservative and accurate dynamic thermal models of distribution network components. In addition, with the improved measurement points in today’s active distribution network, there has never been such a high degree of visibility and forecasting potential for distribution network component states and customer loads. The smart meter measurements are used in this dissertation to address the need for the understanding and forecasting of load profiles closer to customer connection points, which is also the second research contribution. As a third contribution, this dissertation untangles the complex interdependencies of weather and load variables in affecting the states of network components. Frameworks which enable the thermal state estimations and alleviate network capacity and voltage problems associated with high DG integration are proposed and simulated.
1.1 Background
Customarily, electricity distribution networks have so far been designed and operated as passive networks according to a design philosophy that requires them to handle all probable loading conditions. The network planning in a passive distribution network is based on worst case planning principles resulting in sub-optimal network efficiency. In active distribution networks, however, statistical network planning is envisioned with the consideration of the probabilistic nature of loadings and generation. Usually, in passive distribution network operation, congestions are managed by load curtailment and voltage problems associated with DGs are managed by curtailing DG output. These costly ways of operating network operations are destined to be past ways, with the development of ICT enabling monitoring and controlling technologies that create active distribution networks [2].
According to [12], the common global definition of active distribution network (ADN) is as follows:
‘Active distribution networks (ADNs) are distribution networks that have systems in place to control a combination of distributed energy resources (generators, loads and storage). Distribution system operators (DSOs) have the possibility of managing the electricity flows using a flexible network topology. Distributed energy resources (DERs) take some degree of responsibility for system support, which will depend on a suitable regulatory, environment and connection agreement. ’
Active networks not only connect DERs, but they also exploit them to optimize network asset investments and operational costs. This is the most fundamental difference between passive and active networks [13]. ADNs require active network management (ANM), aiming to add more flexibility to network management in order to utilize existing network
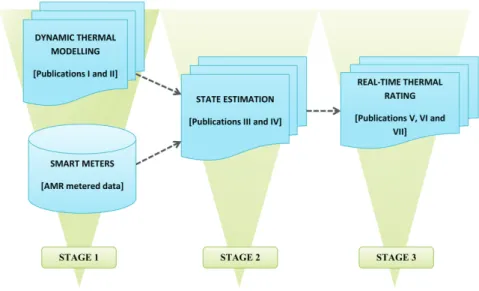
assets more efficiently [14]. In these regards, the real-time thermal rating (RTTR) system enables the utilization of the full capacity of the distribution network infrastructure. In this thesis, the fundamental components of the RTTR system, such as dynamic thermal models and load forecasting methods, are developed and discussed (see Fig. 1).
In active distribution networks, the RTTR system enables real-time monitoring and control activities by integrating with operational planning tools. Operational planning refers to short-term planning which organizes the network operation in the near future. The thesis comprehensively models and simulates the dependency of demand and network states on the common environmental variables such as wind speed, ambient temperature, solar irradiation and humidity in active distribution networks. Consequently, the potential of RTTR systems in increasing the integration potential of DGs and in enabling real-time coordinated voltage controls is demonstrated.
Distribution system analysis tools are expected to continue to play an important role in the real-time operation planning and analysis of the future smart grid [3]. The introduction of dynamic thermal rating to these tools is also becoming common practice, especially in transmission systems. The use of thermo-electric equivalent lumped parameter models for the dynamic estimation of the temperature in transmission cables is discussed in [15]. In [6], the application of dynamic thermal rating for forecasting the real-time rating of an active distribution network is discussed. However, the study in [6] presents only the overhead line ratings, also without the involvement of forecasted local generation. The study in [11] presents the integrated implementation of thermal state estimation and DG output control algorithms based on locally measured electrical and environmental parameters. Nevertheless, there has not been a comprehensive study looking into the possibilities of thermal state forecasting and real-time thermal rating of the main active distribution network components, such as distribution transformers, underground cables and overhead lines, in a one hour or longer period, such as 24 hours ahead. Since distribution system rating depends on the critically loaded component rating, there is a need for understanding the thermal response of the component types to their respective loading, especially in the presence of local generation such as wind turbines. Distribution network components, such as underground cables, secondary substation transformers and overhead lines, have ratings set by manufactures under standard test conditions. However, it is customary for system operators to increase or decrease the ratings of the components based on the actual operating environmental conditions. The static rating is usually based on the standard loading guides provided by organizations such as IEC or IEEE. The wide applications of demand response programs and advent of distributed generation (DG) facilities are, however, imposing a more stochastic and increased loading scenario on distribution network components. Hence, a real-time thermal monitoring and rating capability is required, especially at the weak points of the network. Most static thermal models are suitable for practical approximations and hands
5 on computation, but the simplifications in such models inhibit their application for the dynamic thermal response of a stochastic loading scenario. The ambient temperature, wind speed and solar irradiation effect on local generation and component thermal rating at the time of loading has to be reflected in the hotspot temperature of transformers or conductor temperature of underground cables. The installation parts, such as the air-gap inside buried conduit carrying MV cables and vented prefabricated substation compartments, where natural convection is the dominant heat transfer component, are required to be modelled carefully in order to be suitable for real-time thermal state knowledge acquisition.
Fig. 1 Requirements for real-time operation and management of an active distribution network
1.2 Contributions of the thesis
In this work, relevant improvements and proposals have been presented in three stages on the path towards the development of a real-time operation and management system for active distribution networks. The principal topics that have been investigated are highlighted in Fig. 1. Besides the presentation of component level dynamic thermal models, this work has proved some of the advantages of real-time thermal rating, specifically in increasing the utilization and integration potential of DGs and in enabling a coordinated voltage control (CVC) with the involvement of DGs.
In this thesis, a real-time convection correlation has been developed for the air-gap heat transfer of underground cable installations inside unfilled conduit [Publication I]. The motivation for this contribution is the fact that, for dynamic thermal rating, the available simplified standard models are significantly conservative. For example, the IEC 60287 air-gap thermal resistance differs by 3-4 degrees on the safe side from the measured maximum conductor-insulation junction temperatures. Hence, the inclusion of realistic
installation set-ups in formulating real-time convection correlations is among the improvement measures. In this dissertation, it has also been shown that the use of the Raithby and Hollands Nusselt number correlation in the air-gap thermal resistance calculations of the inclined cylinders resulted in closer match with the measured conductor temperature than the IEC 60287 methods.
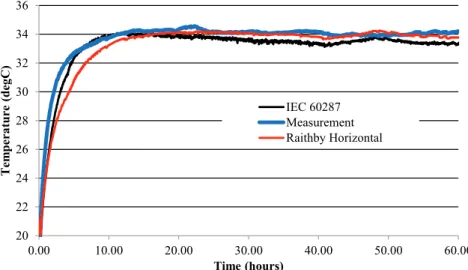
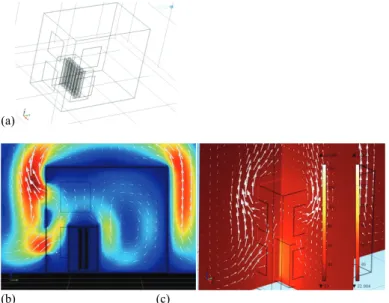
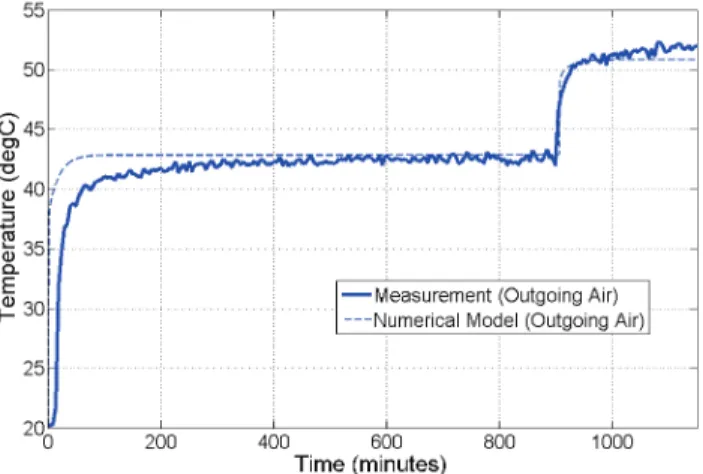
Another contribution of this work is the development of a working dynamic thermal model for prefabricated secondary substations [Publication II]. The most dominant but difficult to solve heat transfer mechanism, natural convection, is modeled through the introduction of the stack effect principle. In the work, a clear and expandable first principle approach is used to quantify heat transfer through ventilation openings. Besides measurements from a scaled model of a prefabricated substation, measurements from actual cabins and 3D Finite Element Method (FEM) simulations are used to validate the numerical model.
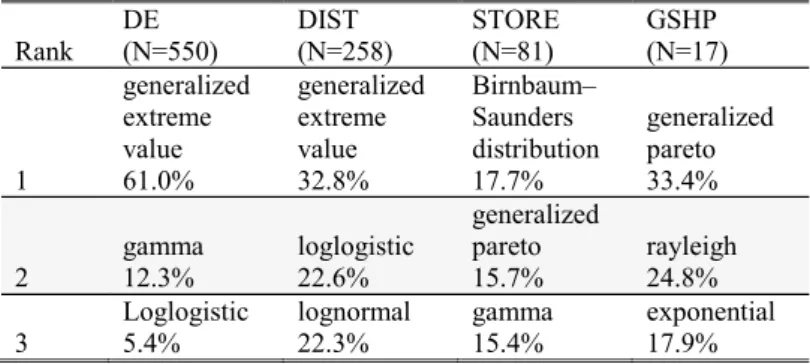
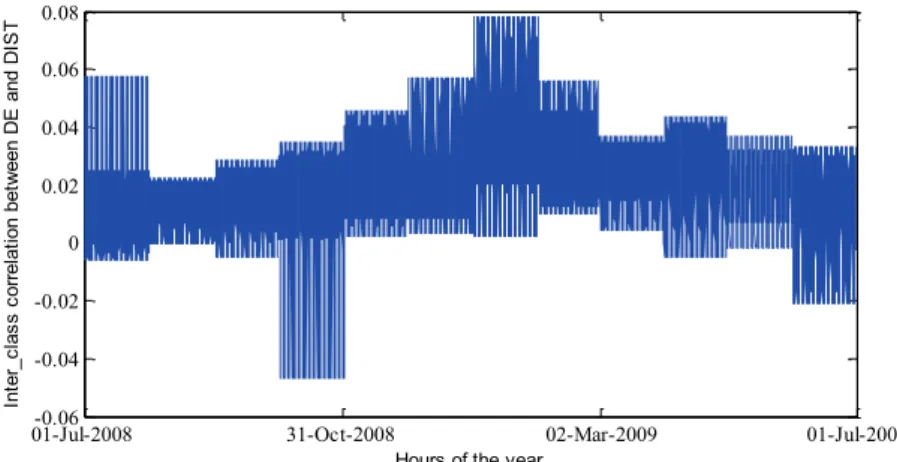
The thesis also investigates the potential for a bottom up load flow analysis based on customer level AMR measurements to compute the short time forecasts of demands and distribution network system states [Publications III and IV]. The main contribution in [Publication III] is the formulation and proposal of a distribution system load modeling framework based on AMR metered consumption data. In this dissertation it has been shown that AMR based load forecasts of individual customers can be used to forecast voltage profiles in distribution systems. A method to model and forecast secondary substation level loads based on classified customer group hourly consumption models is also presented [Publication IV]. It has been shown that the need to perform forecasting and monitoring of a distribution network in real-time can be met with the modeling of classified load type classes.
Tying up the preceding findings, the consequent work in this thesis has proposed and investigated a framework for day-ahead hour-by-hour thermal state forecasting of distribution network components [Publication V]. More importantly, the study has explored how well the thermal states of distribution network components can be forecasted based on smart meter measurements.
After the necessary components for the real-time thermal ratings are in place, the thesis moves further to showcase the benefits and practicalities of the method. In this regard, the proposal of an RTTR based active distribution network management framework with the inclusion of DG generation and load forecasts made the study in [Publication VI] among the first. In the study the potential for increased DG utilization and increased potential for new DG installations have been quantified. The study attempts to achieve better understanding of the real-time active distribution network management in its entirety with the inclusion of the emerging stochasticities and dynamics.
7 In this thesis, the deployment of the RTTR system for day-ahead operation planning of active distribution network with the objective of optimal voltage control is developed and simulated [Publication VII]. A framework comprising a synergy of the RTTR and CVC is proposed for solving the voltage variation and thermal limit problems that are associated with a high penetration level of DGs in an active distribution network. The benefit of incorporating RTTR with CVC has been proved to be two-pronged. On the one hand, the generated DG active power can be utilized better, due to an increased utilization of distribution network component load carrying capacity. On the other hand, the required reactive power for voltage regulation can be transferred without violating network component thermal limits if dynamic thermal rating (DTR) is applied in a real-time basis.
1.3 Structure of the thesis
This thesis is organized as follows:
Chapter 2 introduces the dynamic thermal modeling of three distribution network
components: the overhead lines, the underground cables and the distribution transformers. The chapter mainly presents the two thermal models developed by the author. The first is for MV underground cables installed inside unfilled conduit and the second is the model developed for prefabricated secondary substations.
Chapter 3 presents the different ways the data from smart meters can be utilized in distribution systems for load modelling and load forecasting. In addition, the framework developed by the author for estimating and forecasting the thermal state of distribution network components is presented and explained in this chapter. The chapter further explores the impact of uncertainties in weather variable forecasts on distributed generation output and load forecasts.
Chapter 4 primarily presents the method to couple thermal and electrical models for the purpose of real-time thermal rating of the distribution system. Thermal and electrical state estimation utilizing smart meter measurements is also discussed. The chapter also presents the RTTR framework and algorithms for the investigation of the role of RTTR for both enhanced utilization of DGs and CVC involving DGs.
Chapter 5 The practical implication of the methods and frameworks developed in this dissertation is demonstrated, first, while trying to estimate more accurately the actual real-time capacity of distribution network components and, second, while attempting to involve DGs in the distribution system CVC. The benefits of RTTR are quantified and presented in this chapter.
Chapter 6 reiterates the main findings of this work and their implications. Furthermore this chapter points towards future research topics.
2 Dynamic thermal modelling
The absolute maximum loading capacities of underground cables, overhead lines and transformers are generally dependent on the thermal limits of their insulation. Hence, it is quite apparent that if one wants to know the true load carrying capacity of these power system components then the maximum loading without violating the hottest allowable temperature has to be known. The dynamic thermal models of the components are less conservative for tasks such as knowing the real-time carrying capacity and thermal states of the components.
Thermal modelling is the mathematical or numerical representation of every available heat transfer means, such as convection, conduction and radiation, from a material. With dynamic thermal modelling, the modelled heat transfer must be capable of representing a changing load and ambient weather conditions. In static thermal models only the thermal resistances of components and their immediate environment are considered; also, the calculated hotspot temperatures or ratings are steady state values. With dynamic thermal rating (DTR), however, the ratings of shorter time spans are computed taking into account the time constants of transient responses. Time constants are functions of the products of thermal resistances and thermal capacitances. As RTTR is the computation of the dynamic thermal rating of power system components in real-time; at each time step, the initial temperature, the ambient environmental variables and the loading of the component are variable.
Contrary to RTTR, a static line rating (SLR) matches the steady state maximum line current for which the line conductor temperature is less than the maximum allowable conductor temperature (MACT), under suitably conservative weather assumptions that are fixed or varying seasonally. The dynamic thermal ratings (DTR), however, match the line current for which the conductor temperature is less than the MACT for the existing weather situation. Nevertheless, due to the weather variability, DTRs are only valid for a limited time into the future, called the thermal rating period (e.g. the next hour) [16]. Regarding overload protection in a DTR regime, self-adaptive protection devices can be used. As the dynamic thermal models are capable of giving the next time step rating for the hottest conductor, the models can also give the ampere limit corresponding to the maximum allowable conductor temperature based on the standards. When a current limit is used for protection, as in static rating, the ampere level is fixed. However, when
9 temperature is used as a limit for protection the ampere value varies, following time-current curves which are dependent on historical loading and ambient weather conditions.
2.1 Thermal-electric
analogy
The thermal-electric analogy network is a widely used and accepted way of modeling dynamic heat transfer from a heat source to the heat sink. Many heat transfer problems can be reduced to an equivalent RC circuit, where the distributed parameters can be lumped to a suitable combination of thermal capacitances and resistances. In some cases these elements must be nonlinear, such as the thermal resistance shown in Fig. 2. In general, most transformer top-oil or hot-spot, underground cables and overhead lines thermal models go through the following steps:
1. Identify all heat transfer components (i.e., convection, conduction and radiation) 2. Formulate the thermal resistances and capacitances of each medium between the
heat source and the heat sink (Fig. 2).
3. Establish a simplified RC network, and from the respective first order linear differential equation, solve the temperature at the required node.
q
totC
mediumR
mediumϴ
mediumϴ
ambFig. 2 An RC thermal circuit
ݍ௧௧ൌ ܥௗ௨݀ߠௗ௨݀ݐ ሺߠௗ௨ܴ െ ߠሻ
ௗ௨ (2.1)
The thermal resistance ܴௗ௨ሺௐሻ, analogous to electric resistance, obstructs the flow
of heat ݍ௧௧ሺܹሻ, which itself is the analogy of electric current in electrical circuits.
ܴௗ௨ൌ ଵ
ೠൈೠ (2.2)
where ݄ௗ௨is the heat transfer coefficient in ሺ ௐ
మሻ and ܣௗ௨is the area in ሺ݉ଶሻ. ݍ௧ሺܹሻ ൌ ܫଶܴ
, are the joule losses, where I is the current and Racis the ac resistance per length of conductor. In the case of transformers, ݍ௧௧ሺܹሻare the total losses,
including the load and no load losses.
The presence of thermal resistances and capacitances ሺሺ ܭΤ ሻin the network requires iterative numerical methods such as the Euler and Runge-Kutta methods to solve differential equations such as (2.1). This approach is used in almost all reviewed literature; for example, the IEEE guide for loading mineral-oil-immersed transformers [17].
The heat transfer coefficient in (2.2) depends on the physical parameters of the medium, which in turn might depend on temperature, hence giving nonlinearity to the thermal resistance. The coefficient may include both convection and radiation when the medium is air.
Natural, or free, convection results from the motion of fluid due to density changes arising from the heating process. Self-sustained natural convection might be initiated and continued either when there is an inclination from horizontal of the conduit, duct, tunnel, or other air-gapped cable container, or when deliberate height-differentiated vents are installed in horizontal installations [18]. The strength of natural convection is highly dependent on the installation setup. Hence, the respective convective heat transfer coefficients of different installation setups are detailed in Sections 2.3.1, 2.3.2 and 2.3.3. The heat transfer coefficient for natural convection is given in (2.3)-(2.6) [19].
݄௩ൌ ܰ௨ൈ ݇ ܮ (2.3) ܰ௨ൌ ܥ ൈ ሾܩൈ ܲሿ (2.4) ܲൌ ܿ௨ௗൈ ߤ ݇ (2.5) ܩൌ ܮଷൈ ߩ ௨ௗଶൈ ݃ ൈ ߚ ൈ οߠ௨ௗ ߤଶ (2.6)
where ܰ௨ is the Nusselt number, ܲ is the Prandtle number, ܩ is the Grashof number, ܮ
is the characteristic dimension, length, width or diameter ሺ݉ሻ, ݃ is the gravitational constant ሺ݉ ݏΤ ሻଶ , ݇ is the fluid thermal conductivity ሺܹ ݉Ǥ ܭΤ ሻ, ߩ
௨ௗ is the fluid
density ሺ݇݃ ݉Τ ଷሻ, ܥ and ݊ are empirical constants, ߚ is the fluid thermal expansion
coefficient ሺͳ ܭΤ ሻ, ܿ௨ௗ is the specific heat of the fluid ሺܬ ݇݃Ǥ ܭΤ ሻ, ߤ is the dynamic fluid
viscosity ܲܽݏ ൌ ሺܰݏሻ ݉Τ ଶ, οߠ
௨ௗ is the fluid temperature gradient, ሺܭሻ and ݄௩ is
the convection heat transfer coefficient ሺܹ ݉Τ ଶܭሻ
Radiative heat transfer is the transfer of heat by electromagnetic waves, or photons, without interaction with the medium. The radiative heat transfer from a hot surface in air could be surface_to_ambient and/or surface_to_surface radiation, where the radiation heat transfer coefficient (݄) is calculated as in (2.7) and (2.8), respectively.
a) Surface_To_Ambient: The ambient surrounding behaves as a blackbody. This means that the emissivity and absorptivity are equal to 1, and there is zero reflectivity.
݄ൌ ߝߪ൫ߠ௦௨ ߠ൯൫ߠ௦௨ଶ ߠଶ൯ (2.7)
where ߝ is the surface emissivity and ߪ is the Stefan-Boltzmann constant (ܹ ݉Τ ଶܭସ).
b) Surface_To_Surface (from both ambient and surrounding surfaces)
݄ൌఌሺఙఏೞೠೝ రିீ
ିிೌ್ఙఏೌ್రሻ
ఏೞೠೝିఏೌ್ (2.8)
where ܩis the mutual irradiation, going to other boundaries, ܨis an ambient view factor whose value is equal to the fraction of the field of view that is not covered by other boundaries, and ߠis the assumed far-away temperature in the directions included in ܨ.
11 given by:
݄ௗ௨ൌ ݄௩ ݄ (2.9)
Although various combinations of empirical correlations and modified solution mechanisms could be implemented, the general heat transfer theories explained above are the basis of the modeling in this thesis.
2.2 Overhead
lines
Overhead bare lines have relatively low time constants, which makes them suitable for accommodating intermittent generation, such as wind generation, which is associated with high wind speed. Nevertheless, they also heat up rather quickly in the face of sudden increase in loading. The thermal characteristics of overhead lines are well understood compared to underground cables and transformer prefabricated substations. Hence, in this thesis the IEEE Std C57.91-2011 standard is used. The contribution of this thesis in regard to thermal modelling is limited to underground cables and prefabricated secondary substations, as discussed in the coming sections.
2.3 Underground
cables
The underground cables commonly have a thick layer of insulation, grounded sheath, and a protective cover, and they are buried in the ground directly or within a duct or tube. The thermal modelling of underground cables has had a firm ground in the scientific community since the model presented by Neher-McGrath in the 1950s [20]. However, modelling the immediate environment has proved to be challenging inhibiting the utilization of the developed dynamic thermal models. In this section, the dynamic thermal model developed by the author for underground MV cables inside unfilled corrugated conduits and ducts or tunnels is presented.
The thermal states of cables placed in air-filled conduits, troughs and tunnels heavily depend on the heat transfer in the air-gap. Thermal radiation heat transfer from the cable surface to the surrounding duct or tunnel surfaces is significant, especially when the temperature difference increases and the cooling is natural ventilation. In [21], it has been reported that about 60% of the heat generated in cables (transmission network) is transferred to the retaining duct by radiation. Natural and forced convection is the other major heat transfer in the air-gap. As the air velocity increases the share of convective heat transfer grows, and in forced ventilated tunnels it may reach up to 90% of all heat transfer from cables [22].
Fig. 3 Heat transfer in the air-gap
As shown in Fig. 3, the heat transfer in the air-gap has four components that can be represented by thermal resistances [23]:
x Convection from the cable surface to the air inside the tunnel (Rca).
x Convection from the air inside the tunnel to the tunnel wall (Rat).
x Longitudinal convection due to either forced or natural flow of air along the tunnel (Rf).
x Surface-to-surface radiation from cable surface to inside conduit wall (Rr). The installation in Fig. 3 can be represented by its analogous thermal-electric circuit using the principles explained in Section 2.1, as shown in Fig. 4. However the correct heat transfer coefficients have to be used for the respective installation setup. The horizontal circular concentric cylinders and the eccentric circle representations of tube installations, in this thesis, are defined by employing the Raithby and Hollands natural convection correlations. It has been shown that the simulation of the developed model and physical measurements are in agreement, as presented in [Publication I] and the later Section 2.3.4.
Fig. 4 Air-gap equivalent thermal network.
The strength of natural convection is exceedingly dependent on the installation set-up. In the next sections (Section 2.3.1 to Section 2.3.3) the installation setup dependent natural convection heat transfer coefficients are discussed. The Raithby and Hollands formulations of natural convection for the different installation setups are adopted from the studies in [24] and [25]. The Rayleigh and Nusselt number formulations in equations (2.10) to (2.21) embody the geometric factors and installation setup parameters dependencies.
13 2.3.1 Horizontal circular concentric cylinders
For horizontal concentric circular cylinders, the natural convection heat transfer from the inner to the outer cylinder is given in equations (2.10)-(2.14), [24].
(a) (b)
Fig. 5 Geometry of the eccentric and concentric installations, (a) concentric horizontal annulus, (b)
eccentric circular cylinders The characteristic length:
2 i o c D D L (2.10)
The effective thermal conductivity is:
1/4 4 / 1 Pr 861 . 0 Pr 386 . 0 cyl c eff k F Ra k ¸ ¹ · ¨ © § (2.11)where the Rayleigh number is given as 3 (i o) c c g T T L Ra v E D (2.12)
and the geometric factor of concentric cylinders is
3/5 3/55 3 4 ln »¼ º «¬ ª ¸ ¹ · ¨ © § o i c i o cyl D D L D D F (2.13)Natural convection heat transfer per unit length (Qconv) is then obtained as:
/
(
)
ln
2
o i i o eff convT
T
D
D
k
Q
S
(2.14)where Do and Di are the outer and inner cylinder diameters respectively, Lc is the characteristics length, keff is the effective thermal conductivity, k is the thermal conductivity, Fcylis the geometric factor of concentric cylinders and Rac is the Rayleigh number of cylinders. In (2.12), g is acceleration due to gravity, v is kinematic viscocity, α
is thermal diffusivity and β is the thermal expansion coefficient. In case of multiple core cables, E is the distance between the center of the conduit and the center of the circle drawn around the cables. Di represents the effective diameter of the three cables.
2.3.2 Horizontal circular eccentric cylinders
Raithby and Hollands were able to develop laminar and conduction layer heat transfer Nusselt number empirical correlations for non-overlapping eccentric cylinders [24]. The
overall Nusselt number will be then the maximum of the two Nusselt numbers as shown in (2.18). 3 3 5 5 1 4 5 4 ln 0.603 o i l l c c i o D Ra D Nu C L L D D § · ¨ ¸ © ¹ ª§ · § · º «¨ ¸ ¨ ¸ » «© ¹ © ¹ » ¬ ¼ (2.15)
» ¼ º « ¬ ª ¸¸ ¹ · ¨¨ © § i o i o i o COND D D E D D D D Nu 2 4 cosh ln 2 2 2 1 (2.16) 9 / 4 16 / 9 Pr 492 . 0 1 671 . 0 » » ¼ º « « ¬ ª ¸ ¹ · ¨ © § l C (2.17) For E≠0:>
Nul,NuCOND@
max Nu (2.18)where Nul and NuCOND are Nusselt numbers for conduction and laminar flow regimes respectively and they are formulated in (2.15) and (2.16). Diand Do are inner and outer cylinder diameters, as shown in Fig. 5b. Clis an approximately universal function of Prandtl number (Pr).
2.3.3 Tilted cylinder (Raithby and Hollands)
For a long circular cylinder inclined θ degrees from the horizontal, the laminar flow Nusselt number correlation has been developed by Raithby and Hollands [25]. The flow, in this case, is considered to be directed along the length of the tube. For our concentric cylinder case, incorporating the longitudinal natural convection with the surface-to-surface radiation, we can use the formulation to calculate the air-gap heat transfer at a certain angle from horizontal.
Fig. 6 A tilted cylinder
4 / 1 4 / 1 23 . 1 cos sin 676 . 0 1 228 . 0 772 . 0 CRa L D P Nu l T ¸ ¹ · ¨ © § ¿ ¾ ½ ¯ ® T T (2.20) 1.8 1.8 ln 1 l T Nu Nu § · ¨ ¸ © ¹ (2.19)
15 3 , 2 cot g TD L Ra P v D E T D ' (2.21)
where NuT is the average ‘thin-layer-solution’ Nusselt number for laminar flow, Nu l is the average Nusselt number taken over the entire body, assuming laminar heat transfer prevails over the whole body, and Clis expressed in (2.17). The parameters L, D and T are shown in Fig. 6 and P is the perimeter. The Nusselt number for laminar flow computed in (2.19) is used in the air-gap thermal resistance formulated in (2.23).
2.3.4 Air-gap heat transfer: Natural convection
According to the classical Neher-McGrath method, the thermal resistance of the air-gap between the cables and the retaining duct is computed on the basis of empirical relationships [18]. The method not only reduces the three dimensional heat flow to one dimension, it also combines the radiation, convection and conduction heat fluxes together. The two main perspectives of the Neher-McGrath based models requiring review are the mathematical simplifications and temperature dependency avoidance of thermal resistance calculations. The simultaneous availability of unprecedented computational power and better convection correlations provides favorable ground for reviews and investigations. With the installation dependent correlations presented in Sections 2.3.1 to 2.3.3, it is possible to review the air-gap thermal resistance dependency on radial convection and the longitudinal convection dependency on installation set-ups.
We are thermally modelling a distribution system under various thermal challenges, such as riser-shafts, road crossings, inclinations and long horizontal alignment. It is evident that the ampacity of a cable passing through various thermal conditions is limited by the worst thermal scenario. Using the correlations in equations (2.10)-(2.21), cable surface to air-gap convective thermal resistances can be calculated as in (2.22) and (2.23).
_ ln( ) 2 e i convec horizontal eff D D T k S (2.22) _ 1 . . convec inclined air l T k Nu
S
(2.23)The cable surface to air convective thermal resistances in (2.22) and (2.23) are for horizontal and inclined installations, respectively. Keff is given in (2.11) and Nul is given in (2.12). The radiation and conduction heat transfer formulations are adopted from [26]. In this thesis, the proposed Raithby and Hollands correlations based model of air-gap thermal resistance is compared with Electra 143 method (see [Publication I] and [23]) and the Dorison-Anders method [27].
2.3.5 Concentric vs eccentric approximation
Tube installations of underground cables are usually eccentric. In [28] it has been stated that a concentric approximation of an eccentric installation has minimal effect on the accuracy of the thermal model. However, finite element method (FEM) simulation results show otherwise. The finite element analysis software used in this dissertation was
COMSOL 4.2 [29]. Conjugate heat transfer and surface-to-surface radiation physics models were coupled to simulate the transient response. The physics model consists of a single phase flow interface, using a compressible formulation, in combination with a heat transfer interface. The default mode is solid with conduction heat transfer, and the fluid pre-defined domain uses the general (conduction and convection) heat balance equation. In addition, surface-to-ambient and surface-to-surface radiation boundary conditions are set with the hemicube method. The hemicube method calculates the view factors from one surface to all other surfaces and proceeds row-by-row through the view factor matrix. It is very accurate for geometries with a shadowing effect and small gaps. The simulation results in Fig. 7 show that an assumption of concentric rather than eccentric alignment will be overly conservative. Without transposing, for a trefoil arrangement of cables inside unfilled conduit, the top cable will get significantly hotter than the bottom two, as the time dependent solution in Fig. 7a and Fig. 7b show. Hence, in this thesis the eccentric representation presented in Section 2.3.3 is used. The FEM simulation of the cradle formation is presented in Fig. 7c for comparison.
(a) (b)
(c) (d)
Fig. 7 Time dependent solution of load 400A for eccentric (a) , concentric (b) and cradle (c)
configuration. (temperature bar is in degree centigrade, while the x and y axis have dimensions in meters). Average of the three transposed cables’ conductor-insulation junction temperature of the three cases (d).
(a) (b)
Fig. 8 The AHXAMK-W 3 x 240 Al + 70Cu 20kV cables used in the experiment (a) trefoil
17 2.3.6 Simulation and measurement results
Laboratory measurements were conducted in the high voltage laboratory of Aalto University in March, 2010. Two 6 m long corrugated conduits containing AHXAMK-W 3 x 240 Al + 70Cu 20kV cables were measured for different installation set-ups. The temperature measurements were taken using thermocouples (T- and K- type). The thermocouples were installed in the aluminum conductor (by drilling), on the surface of the aluminum conductor, on the cross-linked polyethylene (XLPE) insulation outer and inner edges, on the PE jacket outer surface, between the cables, in the middle of the air-gap middle air, on the inside, and outside surface of the conduit. The ambient temperature was also measured. The cable and tube specifications are provided in Tables 1 and 2. The specific cable tested in the experiment is pictured in Fig. 8.
Table 1 Cable specification
Name Unit Value
Number of cores x cross-section of
conductor mm
2 3x240Al+70Cu
Diameter over insulation mm 31.3 Single cable diameter (aprox.) mm 39 Complete cable diameter (approx.) mm 88 Weight (approx.) kg/100 m 530 Standard delivery length m 500
Standard drum size K K28
Resistance of conductor Ω/km 0,125 Resistance of earthing conductor Ω/km 0,268
Inductance mH/km 0,35
Reactance Ω/km 0,11
Capacitance μF/km 0,29
Charging current A/km 1,1
Emissivity of cable surface - 0.91
Insulation XLPE
Conductor Stranded, round and compacted aluminum
Screen Aluminum foil bonded tightly to sheath
Sheath PE, black
Highest permissible conductor temperature in continuous operation
ºC 90
Highest permissible conductor temperature in short circuit (duration up to 5 sec)
ºC 250
Table 2 Tube specification
Name Unit Value
Length of tube (each) m 6 Inside diameter mm 140 Outside diameter (max) mm 150 Emissivity (HDPE and
LDPE)
- 0.9 HDPE and LDPE wall
thicknesses
In the case of corrugated conduit installations, we studied four cases of each, with various inclinations and opening arrangements. For instance, Fig. 9a shows the measurement for a 10 degree inclined conduit. We also measured cables directly exposed to the ambient air for reference. There is a clear dependency of natural convection on the physical orientation of the installation, as is illustrated in Fig. 10. Natural convection increases as the degree of inclination from horizontal increases, where the best alignment would be vertical, for which there is a steady state temperature decrease of 12.5% compared with a 10 degree inclination from horizontal.
Another observation worth mentioning here from Fig. 10 is the absence of significant difference among the various degrees of inclination if either or both end openings are sealed. In a real life installation the scenario is comparable with a long tunnel or trough without forced convection. This in turn implies the importance of close enough openings to the outside air to provide a benefit from natural convection for thermally challenged short sections.
(a) (b)
Fig. 9 Conduit measurements: 10 degree inclination (a) and concrete (trough) measurement with
blocked openings (b).
Fig. 10 An equal 400A step load was supplied for different set-ups: 10 degree inclined conduit
from horizontal where both ends are sealed as well as where both ends are open, horizontally positioned conduit with both ends sealed, and vertically positioned with both ends are open. Cables in air outside the conduit are also measured.
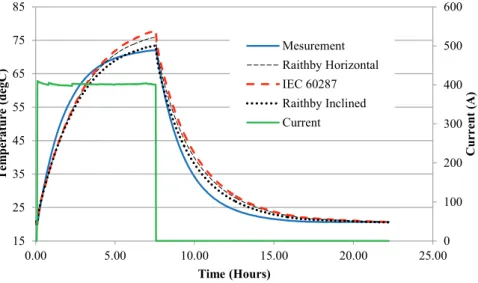
19 For a horizontal setup with both ends of the conduit open, the trefoil MV cables were loaded with a step current of 250A, which was then increased to 450A, to compare the numerical solution with the measurement, as shown in Fig. 11. It should be noted that the correlations in equations (2.10)-(2.21) are used for the real time air-gap thermal resistance computation, which is part of the lumped 5-loop model shown in Fig. 12. The real time numerical algorithm is adopted from [30] and its formulation is presented in [Publication I]. For the horizontal installation, as can be seen in Figs. 11 and 13, with the presence of longitudinal natural convection, the equations in (2.10)-(2.21) are satisfactory.
In Fig. 12, Rinsis the insulation thermal resistance, Rj is thermal resistance of the cable jacket, Rair_gap is the thermal resistance of the air inside the conduit, Rtube is the corrugated tube wall thermal resistance and Rextis the external thermal resistance representing the burial environment in real-life and the ambient environment in the laboratory measurements. In this thesis, the air-gap thermal resistance (Rair_gap) is formulated, to be installiation set-up dependent and less conservative (see (2.22) and (2.23)). For the detailed calculation procedures for the thermal capacitances in Fig. 12, please refer to [26] and [30].
Fig. 11 Conductor surface temperature measurement and numerical simulations for 12 m
horizontal corrugated conduit with both ends opened
-100 0 100 200 300 400 500 600 700 800 15 25 35 45 55 65 75 85 95 0.00 5.00 10.00 15.00 20.00 Current (A) Tem p era ture (degC) Time (Hours) Mesurement Raithby Horizontal IEC 60287 Raithby Inclined Ambient Temperature Current
(a)
(b)
Fig. 12 5-loop lumped thermal model of cables inside conduit (a) and the simplified circuit (b).
The IEC 60287 air-gap thermal resistance is conservative, in that it differed by 3-4 degrees on the safe side from the measured maximum conductor-insulation junction temperatures. The Raithby and Hollands correlation for horizontal concentric cylinders is less conservative due to its inclusion of natural convection phenomena; but it didn’t reflect angle inclination dependencies. The Raithby and Hollands Nusselt number correlation for inclined cylinders was very close to the measured values. Its reflection of inclination angle variations is visible in Fig. 13.
Fig. 13 Conductor surface temperature measurement and numerical simulations for containing
conduit inclined 10 degree, from horizontal with both ends opened.
0 100 200 300 400 500 600 15 25 35 45 55 65 75 85 0.00 5.00 10.00 15.00 20.00 25.00 Current (A) Tem p era ture (degC) Time (Hours) Mesurement Raithby Horizontal IEC 60287 Raithby Inclined Current