51:4 Part II (Winter 2012) pp. 51:4, 79–96
External Debt Accumulation and Its Impact on
Economic Growth in Pakistan
RIFAQAT ALI and USMAN MUSTAFA*
1. INTRODUCTION
The accumulation of external debt is common phenomenon of the developing countries and it has become a common feature of the fiscal sectors of most of the economies. A country with lower saving rate needs to borrow more to finance the given rate of economic growth. So external debt is obtained to sustain the growth rate of the economy, which is otherwise not feasible with the given domestic resources. Pakistan is one of the developing countries and faces serious debt problems, according to World Bank Report 2000-2001, Pakistan is among the Highly Indebted Countries (HICs); because Pakistan’s present and future debt situation is very grim.
According to the World Bank total external debt may be defined as debt owed to non-resident repayable in terms of foreign currency, goods or services. External debt is the composition of long term debt (public and publicly guaranteed debt plus private non guaranteed debt), short term commercial debt and International Monetary Fund (IMF) loans. Prior to early 1970s the external debt of developing countries was primarily small and official phenomenon, the majority of creditors being foreign governments and international financial institutions offer loan for development project [Todaro (1988)]. At the same time current account deficit was common which increased the external indebtedness of the developing countries, until when Mexico, despite an oil exporter, declared in august, 1992 that it could not services its debt ever since, the issue of external debt and its servicing has assumed critical importance and introduced the debt crises debate [Were (2001)].
Several factors have contributed to high rate of debt accumulation in developing countries. These factors are wide-ranging and interconnected. The major factor was the 1973-74 oil price increased by Organisation of Petroleum Exporting Countries (OPEC) led to general deterioration in the external payments position of the oil importing developing countries and forced many of them to borrow heavily. Like other oil importing countries, Pakistan also suffered from these international events of exceptional nature. These events which imposed severe strains on its Balance of Payments (BOP) position hampered its development efforts and led to a marked increase in the volume of international indebtedness as well as its debt servicing liabilities. While improper implementation of macro economic policies, political instability, corruption and poor law and order situation are the main internal factors for rapid growth of external debt.
Rifaqat Ali <rifaqatss786@gmail.com> is Subject Specialist (Economics), Education Department, Punjab. Usman Mustafa <usman@pide.org.pk> is Chief Training Programme/Head, Department of Business Studies, Pakistan Institute of Development Economics, Islamabad.
Effects of external debt accumulation on investment and economic growth of the country are always remaining questionable for policy-makers and academicians alike. There is no consensus on the role of external debt on growth. It has both positive and negative aspect, different experts are in view that external debt will have favourable effect on economic growth because external debt will increase capital inflow and when used for growth related expenditures can accelerates the pace of economic growth. It will not only provide foreign capital for industrial development but will also give managerial know how, technology, technical expertise as well as access to foreign markets for the mobilisation of a nation’s human and material resources for economic growth. On the other hand when external debt accumulated beyond a certain limit, it will contract the economic growth by hampering investment. A leading explanation for this negative relationship is the so-called debt overhang hypothesis, which states that high level of indebtedness discourage investment and negatively affect growth as future higher taxes are expected to repay the debt.
Pakistan faces serious debt problem, which threaten the economic future of the country. Burden of external debt and debt servicing have continued to grow over time. According to the World Bank report 2000-2001, Pakistan is among the HICs; because Pakistan’s present and future debt situation is quite dismal. In 1970 the value of external debt in absolute term was $ 3.4 billion which went to $ 9.93 billion in 1980. The external debt approximately doubled over from 1981 to 1990 and reached to $ 20.66 billion. External debt showed rising trend during 1990-99 as it increased from $ 20.66 billion to $ 33.89 billion. It declined to $ 32.78 billion in 2000 due to debt rescheduling. Then external debt was $ 35.74 billion in 2003, in the last few years external debt increased at an unprecedented rate and reached to $ 54.60 billion in 2010 [Pakistan (2010) and World Bank (2007)].
Comparison of indicators of indebtedness to geographically and income related countries signify that Pakistan is severely indebted as compare to South Asian and Low Income Countries (LICs) during the last four decades. External debt as a percentage of Gross National Product (GNP) was 45.20 percent in Pakistan as compared to 24.17 percent of South Asian countries and 36.78 percent in LICs. Total reserves as percentage of external debt was 13.93 percent in Pakistan as compared to 30.94 percent of South Asian countries and 24.67 percent in LICs. Foreign debt has been a major disbursement item in Pakistan’s exports earnings budget. External debt to export of goods and services was 356.83 percent in Pakistan as compared to 256.80 percent of South Asian countries and 243.72 percent in LICs (these figures are the average of study period i.e. 1970–2010). All these indicators signify the severity of debt crises that Pakistan is facing.
The study is organised as follows, chapter one is introduction of the study. Chapter two gives a review of the theoretical and empirical literatures related to the study. Chapter three presents methodology where methods and techniques to test the hypothesis have been discussed, chapter four is econometric analysis of the study, last chapter is conclusions. References are given at the end of the study.
2. LITERATURE REVIEW
Traditional studies on the external debt problem have focused mainly on the development of the magnitude and trends of the external debt in the LICs and then
followed by other studies which have examined the debt burden indicators and severity of the debt problem [Ahmed (2008)]. Academic research on external debt and its impact on economic growth have only exploded after the debt crises that hit many developing countries in the early 1980’s. However, recently many empirical studies have been conducted to assess the impact of external debt on economic growth but the results are ambiguous.
Oleksandr (2003), divided the existing literature on the related topic into three groups. A first group of theories suggest that because poor countries are far away from steady states any investment injection in form of foreign debt could lead them to have accelerated economic growth through capital accumulation and productivity growth [Pattillo, et al. (2004)]. Therefore foreign debt has a positive impact on growth up to certain threshold level. Second group of theories, stress that high accumulated debt stock have negative impact on growth. A leading explanation for this negative relationship is the so called debt overhang hypothesis of Krugman (1988), and Sach (1989), then advocated by Cohen (1993). Third group of theories combines these two effects and argued that the impact of debt on growth is nonlinear.
The relationship between foreign debt and economic growth has mainly focused on the negative effect of “debt overhang”. Krguman (1988), defined the debt overhang as a situation in which the expected repayment on foreign debt falls short of the contractual value of the debt. Likewise, Borensztein (1990), defined the debt overhang as a situation in which the debtor country benefits very little from the return to any additional investment because of the debt service obligations.
The review of existing empirical studies of external debt and economic growth relationship indicated that it an inadequate to make any generalisation of the relationship between economic growth and external debt. Therefore, it is necessary to consider the case of each country or group separately.
Shabbir (2009) investigated the impact of external debt on economic growth in 24 developing countries from 1976 to 2003. The study applied random effect and fixed effect estimation. The results showed that debt servicing to GDP negatively affect the economic growth and may leave less funds available to finance private investment in these countries leading to a crowding out effect.
Adosla (2009) examined the effect of external debt service payments on the economic growth in Nigeria by using ordinary least square multiple regression method for his analysis. It was found out that debt service payments have negative impact on economic growth.
Abu Baker and Hassan (2008), focused to analyse the impact of external debt on economic growth in Malaysia. The analysis was conducted both at aggregate and disaggregate level. The empirical results indicated that total external debt positively affect the economic growth at aggregate and disaggregate level. In the short run, total external debt had positive effects on economic growth. It also revealed that Malaysia had not suffered from debt overhang problem.
On a Similar line Cholifihani (2008), analysed the short run and long run relationship between external debt and income in Indonesia from 1980 to 2005. The findings showed that GDP, DSR, capital stock, labour force and human capital inputs have a long run equilibrium relationship. External debt servicing showed a significant
negative relationship with GDP, which indicated that debt overhang phenomenon, has occurred in Indonesia in the long run. While labour force and human capital was main supporting variables of GDP in the long run; however capital stock is significant variable in boosting economic growth.
Hasan and Butt (2008) explored the association between external debt and economic growth in Pakistan for the period of 1975-2005 using Auto Regressive Distributed Lag (ARDL) approach to cointegration. Results indicated that labour force and trade both in the long run and the short run mainly determined economic growth in Pakistan. Total debt was not to be an important determinant of economic growth either in the short-run or the long run mainly due to inefficient use of external debt.
Boopen, et al. (2007), investigated the relationship between external public debt and the economic performance for state of Mauritius over the period 1960–2004. The results suggested that external debt have been negatively associated with the output level of the economy in both short and long run. Bicausality between public debt and economic development was also reported. Moreover, there were also evidences that public debt have negative impact on both private and public capital stock of the country thus confirming the debt overhang and crowding out hypotheses.
Patenio and Tan-Curz (2007), studied the relationship between external debt servicing payments and economic growth in Philippines for period 1981 to 2005. Results showed that economic growth was not very much affected by external debt servicing. This was probably because external debt servicing in Philippines was not yet a threat in economic growth and thus, Philippines should not fear of experiencing debt overhang in the near future.
Clements, et al. (2003), examined the channels through which external debt affect economic growth in 55 LICs over the time 1970-1999. The study suggested that beyond a certain threshold, higher external debt is associated with lower rates of growth of per capita income. The results indicated a threshold level of around 30–37 percent of GDP or around 115–120 percent of exports. The study observed that the negative effect of debt on growth works not only through its impact on the stock of debt, but also through the flow of service payments on debt, which are likely to ‘crowd out’ public investment. This is so because service payments and repayments on external debt soak up resources and reduce public investments. The damaging impact of debt servicing on economic growth is attributable to the reduction of government expenditure resulting from debt induced liquidity constraints.
It is worth mentioning that the majority of existing empirical literature report that external debt adversely affects economic growth. Cunningham (1993), Afxentiou (1993), Deshpande (1997), Were (2001), Karagol (2002), Cholifihani (2008), Hameed, et al.
(2008), reported that the external debt negatively affect the economic growth. Whereas Warner (1992), Cohen (1993), Afxentiou and Serletis (1996) and Patenio and Tan-Curz (2007), concluded that external debt did not affect the economic growth. While Omet and Kalaji (2003), and Abu Baker (2008), report the positive impact of external debt on economic growth. The theoretical literature has summarised the following channels namely debt overhang, liquidity constraint, fiscal effect, productivity suppression and reduction in human capital accumulation along which external debts affects negatively growth [see Krugman (1988) and Savvides (1992)].
Table 1
Summary of Literature Review of External Debt and Economic Growth Relationship
Date Author Time Period Sample Findings
2008 Abu Baker 1970-2005 Malaysia External debt positively affect economic growth 2008 Ayadi and Ayadi 1970-2007 Nigeria and
South Africa
Confirm the negative impact of external debt on economic growth.
2008 Hameed, et al. 1970-2003 Pakistan Debt service burden inversely affect economic growth.
2008 Colifihani 1980-2005 Indonesia External debt payment has significant negative relationship to GDP.
2007 Patenio and Tan-Curz
1981-2005 Philippines Economic growth was not affected by external debt servicing.
2005 Mohamad 1978-2001 Sudan External debt works against economic growth 2003 Clements 1970-1999 55 low income
countries
Beyond certain threshold levels external debt negatively affect economic growth. 2003 Omet and Kalaji 1970-2000 Jordan External debt positively affect economic growth
below optimal debt level i.e. 53 percent of GDP 2002 Wijeweera,
et al.
1952-2000 Sri Lanka Debt overhang had not exist in Sri Lanka. 2002 Karagol 1956-1996 Turkey Debt service is negatively correlated to economic
growth. 1997 Deshpande 1971-1991 13 Severely
Indebted Countries
The relationship between external debt and investment is negative. 1992 Warner 1960-1981 and 1982- 1989 13 Less Developed Countries
External debt does not reduce investment.
3. MODEL SPECIFICATION AND EMPIRICAL STRATEGY
This study employed the extended model of production function originally applied by Cunningham (1993), to investigate the effect of debt burden on economic growth in sixteen heavily indebted nations. Cunningham (1993), presumed that the production function only consist of physical capital, labour and debt service.
The model assumed that there is no human capital. Romer (1986), investigated that physical capital is important for the production function but the human capital is vital. Therefore, Karagol (2002), extended the Cunningham model to incorporate Romer’s conceptualisation of human capital. Human capital consists of skill, abilities and knowledge of particular workers therefore, to investigate the relationship between external debt burden and economic growth the study insert variable of human capital that can be proxied by annual government education expenditures.
Karagol (2002), covered data of Turkey and Wijeweera, et al. (2005), used data of Sri Lanka employed education expenditures representing human capital in the model. Karagol suggested that education expenditures may not be a suitable proxy for human capital in case of Turkey. In contrast, in case of Sri Lanka, the results suggested that education expenditures may have been an appropriate proxy for human capital.
This study used external debt as a percentage of GDP to capture the effect of external debt because external debt as a percentage of GDP signifies the indebtness relative to economic strength of the country.
The model of this study was:
Y= f (HK, K, L, EDY)
The production function used the following specification:
Yt= β0+ β1HK +β2K+ β3LF+ β4EDY + εo … … … … (1)
Yt = Gross National Product (GNP)
HK = Human capital, It consists of the skills and knowledge of particular workers (Annual education expenditures of Pakistan used as a proxy of human capital)
K = Capital stock (Capital formation)
LF = Total labour force
EDY = External debt as a percentage of GDP εo = White noise error term
By applying natural logs, the model was
LYt= β0+ β1LHK + β2LK+ β3LLF + β4LEDY + εo … … … (2) It has now become a standard practice to check the univariate time series of variable by using a unit root test in each series before estimating any equation. If there is a unit root, then the particular series is considered to be non-stationary. Moreover, estimation based on non stationary variables may lead to spurious results which produce high R2 and t-statistics, but without any coherent economic meaning [Granger and Newbold (1974)]. In accordance with standard practice it was checked whether the variables are stationary or not.
In this study Augmented Dicky Fuller (ADF) test was carried out for checking unit roots. ADF has three different specifications, the first excludes both the trend and the intercept, second specification includes the intercept but excludes the trend term and the third specification includes both the trend and the constant term. The study used the third specification. The purpose to use the ADF to testing the null hypothesis that a series does contain a unit root (i.e., it is non stationary) against the alternative hypothesis of stationarity.
ΔYt= β1+ β2t+ δYt–1+ α Σi=1ΔYt–i +εt … … … (3)
Where Yt is relevant time series, t is time trend and εt is white noise error term.
It is also important to select an appropriate lag length; too few lags may result in rejecting the null hypothesis when it is true (i.e., adversely affecting the size of the test), while too many lags may reduce the power of test [Harris and Sollis (2003)]. The study used the Schwarz criterion (SC) and Hannan-Quinn information criterion (HQ) to choose the appropriate lag length.
3.1. Cointegration Analysis
After checking univariate of all time series variables, the study test cointegration among the variables of the model (GNP, human capital, capital, labour force and external debt). The reason of the cointegration test was to determine whether a group of non stationary series is cointegrated or not.
With the aim of determining long run relationship between variables cointegration technique is adopted. Two main cointegration techniques are generally used; Engle and Granger (1987), technique and Johansen (1988), approach. In order to test cointegration among variable the study applied the Johansen cointegration technique. This technique depends on direct investigation of cointegrating Vector Auto Regressive (VAR) representation.
Yt = α1Yt-1 + α2Yt-2 + ………. + αkYt-k + εt
Where, Yt is n 1vector of I (1) endogenous variables (GNP and its determinants) in the VAR system εt is a vector of white noise error terms.
The Johansen procedure is designed to statistically determine the number of cointegrating vectors in the VAR. In order to determine the number of cointegrating vector Johansen (1988), provides two different likelihood ratios tests to determine the value of cointegrating vector. These are the Trace test:
LR= TΣ ni=r+1ln( 1–λi)
And the Maximum Eigenvalue test statistics:
LR= T ln(1–λr+1)
Trace statistic is a joint test where the null is that the number of cointegrating vectors is less than or equal to r against an alternative that there are more than r. Maximum Eigenvalue test conducts separate tests on each Eigenvalue and has its null that the number of cointegrating vectors is r against an alternative of r+1. The null hypothesis was tested sequentially from low to high values of r. The testing procedure ends when a null hypothesis fails to be rejected for the first time [Rusike (2007)].
3.2. Short Run Dynamics
The final step of the analysis involved the estimation of short run relationship between external debt and GNP. The short run model was used to identify whether the effect of external debt is permanent or transitory. If the responses are significant in the short run only, then the impacts of change in external debt is transitory. On the other hand, if the impacts are significant in both short and long run, then there will be temporary and permanent effect. If there is an equilibrium or cointegration relationship among non stationary variables there has to be an error correction representation [Engle and Granger (1987)]. Relationship between Yt and Xt with an error correction specification as;
∆Yt= β0+ β1∆Xt – π êt-1 + εt
β1 will have the short run effect, that measure the immediate impact that a change in Xt will have on change in Yt. On the other hand is the adjustment effect and shows how much of disequilibrium is being corrected, i.e. the extent to which any disequilibrium in the previous period effects any adjustment in the Yt period.
The error correction mechanism integrates the short run dynamics with the long run equilibrium without losing long run information. This term captures the short run relationship. It attempts to correct deviations from the long run equilibrium path and its coefficient can be interpreted as the speed of adjustment or the amount of disequilibrium transmitted each period to economic growth [Ndung’u (1993)].
3.3. Data Collection and Data Definitions
The empirical analysis of this study used the time series data coverd the period from 1970 to 2010. All the data obtained from Government publication, Annual
Economic Surveys of Pakistan (various issues), World Development Indicators [CD (2007)], Federal Bureau of Statistics and State Bank of Pakistan. Besides this,
International Financial Statistics (IFS) of IMF has also been used to supplement the information.
Table 2
Variables Names and Description
Variable Name Variable Description
LY Log of GNP
LHK Log of human capital
LK Log of capital
LLF Log of labour force
LEDY Log of external debt as a percentage of GDP
4. ESTIMATIONS AND ANALYSIS OF RESULTS
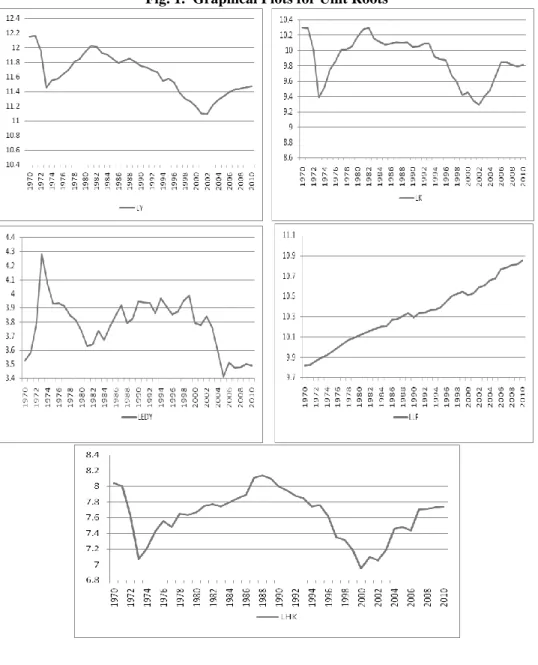
This section provides graphical analysis and test the existence of unit roots of each series using the Augmented Dickey Fuller (ADF) test. The optimal lag length for the unit root and Johansen’s cointegration tests are decided by the Schwartz Criterion (SC) and Hannan-Quinn information criterion (HQ). Then the study detects the number of cointegrating vectors by employing Trace statistics and Max Eigenvalue test. After that the cointegration analysis was employed using the Johansen (1988), cointegration technique and calculate the normalised long run equilibrium equations. Finally the study estimated the Vector Error Correction Modeling (VECM) for short run dynamics.
4.1. Results for Unit Root Test
Non-stationarity of time series data has often been considered as a proble m in empirical analysis. Working with non-stationary variables leads to spurious regression results, from which further inference is meaningless. Therefore, it is important to test the stationarity of all series entering in the model. The ADF test was used to test the stationarity of the series. The null hypothesis was that the variable under investigation has a unit root, against the alternative that it does not. The results of the test for the variables are presented in Table 3. In addition to the ADF test, the
study also attempted to examine the trend of the variables graphically. The graphical
illustration of the variables demonstrates the similar characteristic of the variables as the ADF test.
Fig. 1. Graphical Plots for Unit Roots
Table 3
Results of ADF Test for Non Stationarity
Variables
ADF Test in Level ADF Test in First Difference
Calculated Lags Calculated Lags
LY –2.50 1 –4.52** 1
LHK –2.29 1 –4.46** 1
LK –2.73 1 –4.20* 1
LLF –2.06 1 –6.92** 1
LEDY –2.75 1 –5.67** 1
Note: The asterisks (*) and (**) indicates statistical significance at the 5 percent and 1 percent significance level.
The results reported in Table 3 are carried out with trend and intercept. Results indicated that all series exhibit non stationary in levels. In other words, the null hypothesis that each of the time series has a unit root cannot be rejected. However, there is no evidence of a unit root when the series are first differenced. The no stationary hypothesis was dismissed in all cases. It means that all the variables under investigation are stationary at first difference at 1 percent level of significance except LK which was stationary at 5 percent level of significance, as can be inferred from Table 3.
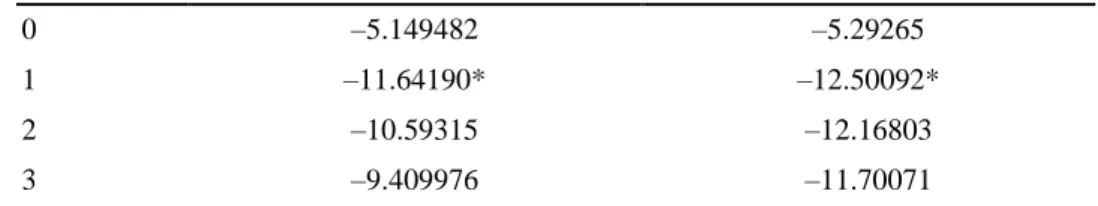
4.2. Optimal Lag Selection
After analysing the result of unit root test next step is to find out the lag order for cointegration. One must determine the optimal lag structure of the model, i.e. the number of lags that will capture the dynamics of the series. Results of two different criterions for optimal lag selection are presented in Table 4. Both SC and HQ statistics suggested one lag as optimal lag.
Table 4
Optimal Lag Selection
Lag SC HQ
0 –5.149482 –5.29265
1 –11.64190* –12.50092*
2 –10.59315 –12.16803
3 –9.409976 –11.70071
* Indicates lag order selected by the criterion SC: Schwarz criterion
HQ: Hannan-Quinn information criterion
4.3. Results from the Conitegration Analysis
The results from the unit root test indicated that the entire variables entered in the model are non-stationary at level and became stationary at first difference. While the optimal lag length criteria suggested one as optimal lag.
Table 5
Unrestricted Cointegration Rank Test (Trace Statistics)
Hypothesised No of Cointegration Equation Eigenvalue Statistics Trace Value 5 percent
Critical Value Prob**
None * 0.62436 75.461 69.818 0.0165
At most 1 0.48028 39.233 47.856 0.2511
At most 2 0.22607 15.017 29.797 0.7790
At most 3 0.13767 5.5350 15.494 0.7497
Table 6
Unrestricted Cointegration Rank Test (Maximum Eigenvalue)
Hypothesised No. of Cointegration Equation Eigenvalue Statistics Trace Value 5 percent
Critical Value Prob**
None * 0.62436 36.228 33.876 0.0257
At most 1 0.48028 24.215 27.584 0.1273
At most 2 0.22607 9.4822 21.131 0.7917
At most 3 0.13767 5.4805 14.264 0.6803
At most 4 0.00147 0.0545 3.8414 0.8153
Trace test and Max-eigenvalue test indicate 1 cointegrating eqn(s) at the 0.05 level *denotes rejection of the hypothesis at the 0.05 level
**MacKinnon-Haug-Michelis (1999) p-values
The next procedure was to test the existence of long run relationship among the variables in the model. This study applied Johansen (1988), cointegration test to examine whether there is more than one single cointegration relationship.
Johansen’s cointegration procedure mainly focused to find out the number of cointegrating vectors in the system. If the number of cointegrating vector (0≤r≤n) is zero, it would imply that there is no long run relationship among the variables. On the other hand, if there are r cointegrating vectors, it suggests that there are (n-r) common stochastic trends among the variables that link them together.
Tables 5 and 6 revealed the results of Johansen cointegration test based on Trace statistics and Max Eigenvalue respectively. These tests statistics help to evaluate whether there exist a long run relationship exist among LY, LHK, LK, LLF and LEDY. Both of these tests showed the long run equilibrium relationship among non stationary variables entering in the model. The null hypothesis of no cointegration was rejected therefore, the alternative hypothesis that at least one cointegrating vector was accepted by both test at 5 percent level of significance. According to the results of Johansen’s test, it can be argued that a long run relationship exist among LY, LHK, LK, LLF and LEDY and there exist precisely one cointegrating vector in the estimated model.
Variables considered in the determination of economic growth have expected signs except labour force. Human capital and capital positively affect the economic growth where as external debt and labour force affects it negatively.
Table 7
Long Run Equilibrium Equation Dependent Variable (Log GNP)
Independent Variable Coefficient t-statistics
Constant –1.3227 4.2378
Log (Human Capital)* 0.31277 4.6239
Log (Capital Stock)* 0.52918 6.4832
Log (Labour Force)* –0.16823 –10.3901
Log (External Debt as Percentage of GDP)* –0.42394 –8.24052
In the context of LDCs, economic theory suggests that human capital is an important determinant of economic growth. Various theoretical models include human capital as a factor of production and consider the accumulation of human capital as an element of the growth process. Empirical evidence for number of countries also confirmed this relationship. Lucas (1993), argued that accumulation of human capital serve as an engine of economic growth. Mankiw (1992), further extended the theory and consider human capital as an additional accumulatable factor. He provided evidence that changes in human capital ultimately translates into significant changes of growth rates. Barro and Lee (1993) and Benhabib and Spiegel (1994), provided evidence that human capital accumulation promotes economic growth.
Empirical findings indicated that human capital has a positive effect on economic growth and have the second most substantial effect on GNP i.e. 0.31. This means that 1 percent increase in annual education expenditure (used as proxy of human capital) leads to increase GNP by 0.31 percent. This relationship was significant at 5 percent level of significance. This indicates the low level of government expenditure on education in Pakistan.
The results also indicated a positive relationship between capital and economic growth. This in line with the general assertion that the capital is a key factor of production hence it is positively associated to economic growth. Since capital is one of the major determinants of GNP therefore, according to estimation it reports the positive effect on economic growth. On this estimates 1 percent increase in capital leads to increase GNP by 0.53 percent. This association was significant at 5 percent level of significance. The relationship was consistent with economic theory. This indicates the scarcity of capital in Pakistan.
Labour force showed the negative impact on economic growth; where as the study hypothesised the positive effect of labour force. Firstly, it can be argued that Pakistan is labour abundant country. More unskilled labour having low productivity is unlikely to increase the level of output in the country. Secondly, agriculture is the largest sector of the economy and 45 percent of total employed labour force is working in this sector [Pakistan (2010-11)]. Agriculture sector suffer from disguised unemployment, majority of the people belong to this sector seem to be actively participated in economic activities, but having zero marginal productivity. Therefore, labour was negatively related to economic growth. These results were conflict with Hameed, et al. (2008), who found the positive impact of labour force and economic growth in Pakistan. While Wijeweera, et al.
(2005), found the same result for Sri Lanka. Positive impact of education expenditures also indicated that there may be scope of improving labour efficiency by increasing education expenditure in Pakistan.
Results reported in Table 7 indicated that external debt has negative long run relationship with economic growth. The rationale is that high ratio of external debt as percentage of GDP leads to lower the rate of economic growth i.e. an increase in 1 percent in external debt as percentage of GDP will reduce the GNP by 0.42 percent. These results confirmed the existence of debt overhang problem. This hypothesis hypothesised that having heavy debt burden the government will have to increase taxes in the future to finance the high debt service payments. That increase in taxes means a lower
after tax return on capital and a reduced incentive to invest. Lower investment leads to slower growth [Krugman (1987 and 1985); Sachs (1984 and 1986)].
However in the long run repayments of principal and interest payment absorb the significant portion of foreign reserves making it difficult to launch new investment projects. This implies that rising external debt deter economic growth. The findings were consistent with the literature with Geiger (1990), Cunningham (1993), Afexientue (1993),
Sawada (1994), Deshpande (1997), Karagol (2002), and Hameed, et al. (2008), (in case
of Pakistan) found negative relationship between debt burden economic growth.
Among the variable capital stock and human capital contributed to boost the economic growth in the country during the period of the study. While being a labour abundant nation labour contributed negatively. Heavy external debt act like a future tax therefore, it verified the occurrence of debt overhang situation in Pakistan during the period of the study. All these associations are statistically significant at 5 percent level of significance.
4.4. Short Run Dynamics
Short run dynamic equation has two important objectives. Firstly, it can be used to investigate whether the impact of any external debt burden is stable or temporary. If the responses are significant both in long run and short run, it can be said that changes are permanent as well as transitory. Finally, the Error Correction Term (ECT) provides information about the speed of adjustment in response to a deviation from the long run equilibrium. The short run results of the model are depicted in Table 8.
Table 8
Short Run Results of the Model
Independent Variable Coefficient t-statistics
Log (Human Capital)* 1.500092 3.65554
Log (Capital Stock)* 1.231827 3.15180
Log (Labour Force)* –0.116589 –1.63426
Log (External Debt as Percentage of GDP)* –0.482802 –4.92390
Error Correction Term* –0.328 –3.21314
Note: The asterisks (*) indicates the statistical significance at 5 percent level of significance.
The results reported in Table 8 indicate that the short run results of first difference
of log-level variables are similar to long run. Short run dynamics indicated that the short
run impact of human capital and capital is positive and statistically significant. External debt exerts negative effect on economic growth in short run and the size of negative impact is stronger than long run. GNP will increase 1.23 and 1.50 percent as a result of 1 percent increase in capital and human capital respectively. While the short run estimates show the insignificant negative association between labour force and economic growth.
Relationship between external debt and economic growth is found to be negative and significant in short run. This indicated that external debt effect in Pakistan during the period of study is permanent as well as transitory and debt overhang occurs both in short and long run. Negative impact of external debt in short run is stronger than long run, 1 percent increase in external debt as a percentage of GDP will cause 0.48 percent decrease
in GNP in short run. Mismanagement of external debt is the main contributing factor of this negative effect in the short run.
After determining the existence of cointegrating relationships, disequilibrium may exist in the short run. If a long run relationship between different variable exists then an error correction process is also taking place. The coefficients of the ECT provide information about the speed of adjustment toward the long run equilibrium after a short run shock. The speed of adjustment coefficient is correctly signed. The ECT is significantly different from zero, indicating the existence of error correction mechanism and implying that the D(LY), D(LHK), D(LK), D(LLF) and D(LED/Y) converge to the long run equilibrium relationship. The speed of adjustment of the equilibrium error term suggest that if a shock inserted into the model 33 percent deviation is rather corrected with in the first year. The ECT is negative and significant with high t-values of 3.21, confirms that findings of the study are regarding the cointegration relationship.
5. CONCLUSIONS
The study attempted to examine the long run and short run impact of external debt on economic growth in Pakistan over the period of 1970-2010, considering GNP as a function of annual education expenditures (proxy of human capital), capital, labour force and the external debt. Then long run equilibrium equation was obtained by applying Johansen cointegration test while short run results were obtained through Vector Error Correction Modeling. Finally Error Correction Term was measured to capture the speed of adjustment.
Empirical evidence revealed that external debt exerts a negative impact on economic growth; clearly indicate that higher external debt discourages economic growth. Therefore it verified the occurrence of debt overhang situation in Pakistan during the period of the study. Capital as a key factor of production, positively affects the economic growth. This indicates that capital investment has a lot of potential to accelerate the pace of economic growth. Human capital has positive impact on economic growth signified that an educated and highly productive labour force can lead to speed up the growth process. Labour force showed the negative impact on economic growth indicated that more unskilled labour having low productivity is unlikely to increase the level of output in the country.
Short run results also confirmed the significance of capital formation and human capital to generate national income. Short run results showed the similar sign of variable entering in the model as in the long run but significant negative association of labour force and economic growth exist only in the long run.
A significant adjustment parameter obtained from the cointegration equation confirmed the long run relationship. An estimation of adjustment parameter suggested that 33 percent of any deviation to the long run equilibrium corrected in one year.
From the policy prospective it is recommended that increased domestic saving and export earnings could also raise the estimated growth rate and reduce the reliance of the economy on external debt. It is very important to create conducive environment for investment and much focus of the policies should be on the inflow of Foreign Direct Investment (FDI), while the inflow of debts should be minimised. There is severe need of close monitoring and consistent debt management strategies to avoid the misutilisation of external debt.
REFERENCES
Abu Bakar, N. A. and S. Hassan (2008) Empirical Evaluation on External Debt of Malaysia. International Business and Economics Research Journal 7:2, 95–108. Adosla, W. A. (2009) Debt Servicing and Economic Growth in Nigeria: An Empirical
Investigation. Global Journal of Social Sciences 8:2, 1–11.
Afxentiou, P. C. (1993) GNP Growth and Foreign Indebtedness in Middle-Income Developing Countries. International Economic Journal 7:3, 81–92.
Afxentiou, P. C. and A. Serletis (1996) Growth and Foreign Indebtedness in Developing
Countries: An Empirical Study Using Long-term Cross Country Data. The Journal of
Developing Areas 31, 25–40.
Ahmed, M. M. (2008) External Debts, Growth and Peace in the Sudan: Some Serious Challenges Facing the Country in the Post-Conflict Era. CHR Michelson Institute SR 2008: 1, Sudan.
Ayadi, F. S. and F. O. Ayadi (2008) The Impact of External Debt on Economic Growth:
A Comparative Study of Nigeria and South Africa. Journal of Sustainable
Development in Africa 10:3, 234–264.
Barro, R. and J. W. Lee (1993) International Comparisons of Educational Attainment.
Journal of Monetary Economics 32, 363–394.
Benhabib, J. and M. Spiegel (1994) The Role of Human Capital in Economic
Development: Evidence from Cross-Country Data. Journal of Monetary Economics
34, 143–173.
Boopen, S., P. Kesseven, and D. Ramesh (2007) External Debt and Economic Growth: A Vector Error Correction Approach. International Journal of Business Research, 211–233. Borensztein, E. (1990) Debt Overhang, Debt Reduction and Investment: The Case of
Philippines. (IMF Working Paper, No. WP/90/7).
Cholifihani, M. (2008) A Co-integration Analysis of Public Debt Service and GDP in Indonesia. Journal of Management and Social Sciences 4:2.
Clements, B., R. Bhattacharya, and T. Q. Nguyen (2003) External Debt, Public Investment, and Growth in Low-Income Countries. (IMF Working Paper. 03/249).
Cohen, D. (1993) Low Investment and Large LDC Debt in the 1980s. American
Economic Review 83:3, 437–449.
Cunningham, R. T. (1993) The Effect of Debt Burden on Economic Growth in Heavily Indebted Nation. Journal of Economic Development 18:1.
Deshpande, A. (1997) The Debt Overhang and the Disincentive to Invest. Journal of Development Economics 52:1, 169–187.
Engle, R. F. and C. W. J. Granger (1987) Co-integration and Error Correction: Representation, Estimation and Testing. Econometrica 55, 251–278.
Geiger, L. T. (1990) Debt and Economic Development in Latin America. The Journal of
Developing Areas 24, 181–194.
Granger, C. W. J. and P. Newbold (1974) Spurious Regression in Econometrics. Journal
of Econometrics 2:2, 111–120.
Hameed, A., H. Ashraf, and M. A. Chaudhry (2008) External Debt and its Impact on
Economic Growth in Pakistan. International Research Journal of Finance and
Harris, R. and R. Sollis (2003) Applied Time Series Modelling and Forecasting. Chichester, England: Jhon Willey and Sons, Ltd.
Hasan, A. and S. Butt (2008)Role of Trade, External Debt, Labour Force and Education
in Economic Growth Empirical Evidence from Pakistan by using ARDL Approach.
European Journal of Scientific Research 20:4, 852–862.
Johansen, S. (1988) Statistical Analysis of Cointegration Vectos. Journal of Economic Dynamics and Control 12:2/3, 231–254.
Karagol, E. (2002) The Causality Analysis of External Debt Service and GNP: The Case of Turkey. Central Bank Review 1, 39–64.
Krugman, P. (1985) International Debt Strategies in an Uncertain World. In G. W. Smith and J. T. Cuddington (eds.) International Debt and the Developing Countries. Washington, DC: World Bank.
Krugman, P. (1987) Prospects for International Debt Reform. In UNCTAD, International Financial Issues for the Developing Countries, Geneva.
Krugman, P. (1988) Financing vs. Forgiving a Debt Overhang: Some Analytical Issues. Cambridge, Massachusetts: National Bureau of Economic Research. (NBER Working Paper No. 2486).
Lucas, R. E. (1993) On the Determinants of Direct Foreign Investment: Evidence from
East and South East Asian. World Development 21:03, 391–406.
Mohamed, M. A. A. (2005) The Impacts of External Debt on Economic Growth: An
Empirical Assessment of the Sudan: 1978-2001. EASSRR 21:2, Sudan.
Ndung’u. N. (1993) Dynamics of the Inflationary Process in Kenya. Unpublished PhD Thesis, University of Gothenburg, Gothenburg.
Oleksandr, D. (2003) Non-linear Impact of External Debt on Economic Growth: The Case of Post Soviet Countries. Unpublished M.A. Thesis, National University of Kyiv-Mohyla Academy.
Omet, A. M. G. and F. Kalaji (2003) External Debt and Economic Growth in Jordan: The Threshold Effect. International Economics 256:3, 337–355.
Pakistan, Government of (Various Issues) Pakistan Economic Survey. Islamabad:
Ministry of Finance.
Patenio, J. A. S. and A. Tan-Cruz (2007) Economic Growth and External Debt Servicing of the Philippines: 1981-2005. 10th National Convention on Statistics (NCS).
Patillo, C., H. Poirson, and L. Ricci (2002) External Debt and Growth. (IMF Working Paper).
Patillo, C., H. Poirson, and L. Ricci (2004) What Are the Channels Through Which External Debt Affects Growth. (IMF Working Paper).
Romer, P. (1986) Increasing Returns and Long Run Growth. Journal of Political Economy 94, 1002–1037.
Rusike, T. G. (2007) Trends and Determinants of Inward Foreign Direct Investment to South Africa. Unpublished M.A. Thesis, Rhodes University, South Africa.
Sachs, J. D. (1984) Theoretical Issues in International Borrowing. Princeton Studies in International Finance 54. New Jersey: Princeton University.
Sachs, J. D. (1986) The Debt Overhang Problem of Developing Countries. Paper presented in memorial to Carlos Diaz-Alejandro, Helsinki.
Sachs, J. D. (1989) Introduction to “Developing Country Debt and the World Economy”
NBER Chapters. In Developing Country Debt and the World Economy 1–34. National
Bureau of Economic Research, Inc.
Savvides, A. (1992) Investment Slowdown in Developing Countries during the 1980s: Debt Overhang or Foreign Capital Inflows? Kyklos 45, 363–378.
Sawada, Y. (1994) Are the Heavily Indebted Countries Solvent? Tests of Inter Temporal
Borrowing Constraints. Journal of Development Economics 45, 325–337.
Shabbir, Safia (2009) Does External Debt Affect Economic Growth: Evidence from Developing Countries. Downloadable at: http://aysps.gsu.edu/sites/default/files/ documents/ECON_MA_shabbirS.pdf.
Todaro, M. P. (1988) Economic Development in the Third World. (Fourth Edition), Longman, New York and London, p. 411.
Warner, A. M. (1992) Did the Debt Crisis Cause the Investment Crisis? Quarterly Journal of Economics 107:4, 1161–1186.
Were, M. (2001) The Impact of External Debt on Economic Growth in Kenya. United Nation University, World Institute for Development Economics Research. (Paper No. 2001/116).
Wijeweera, A., B. Dollery, and P. Patberiya (2005) Economic Growth and External Debt Servicing: A Cointegration Analysis of Sri Lanka, 1952 to 2002. (Working Paper Series in Economics 2005-8).
World Bank (2007) World Development Indicators (CD 2007). Washington, DC: World