Ateneo de Manila University Ateneo de Manila University
Arch
ī
um Ateneo
Arch um Ateneo
Environmental Science Faculty Publications Environmental Science Department
3-20-2017
A supply chain framework for characterizing indirect vulnerability
A supply chain framework for characterizing indirect vulnerability
Charlotte Kendra Z. Gotangco
Ateneo de Manila University, [email protected] Abigail Marie T. Favis
Ateneo de Manila University, [email protected] Ma. Aileen Leah G. Guzman
Ateneo de Manila University, [email protected] Marion Lara Tan
Ateneo de Manila University Carissa Quintana
Ateneo de Manila University
See next page for additional authors
Follow this and additional works at: https://archium.ateneo.edu/es-faculty-pubs
Part of the Sustainability Commons
Recommended Citation Recommended Citation
Gotangco, C. K., Favis, A. M., Guzman, M. A. L., Tan, M. L., Quintana, C., & Josol, J. C. (2017). A supply chain framework for characterizing indirect vulnerability. International Journal of Climate Change Strategies and Management.
This Article is brought to you for free and open access by the Environmental Science Department at Archīum Ateneo. It has been accepted for inclusion in Environmental Science Faculty Publications by an authorized administrator of Archīum Ateneo. For more information, please contact [email protected].
Authors Authors
Charlotte Kendra Z. Gotangco, Abigail Marie T. Favis, Ma. Aileen Leah G. Guzman, Marion Lara Tan, Carissa Quintana, and Jairus Carmela C. Josol
A Supply Chain Framework for Characterizing Indirect Vulnerability Charlotte Kendra Gotangco
Department of Environmental Science, Ateneo De Manila University, Quezon City, Philippines
Email: [email protected] Abigail Marie Favis
Department of Environmental Science, Ateneo De Manila University, Quezon City, Philippines
Email: [email protected] Ma. Aileen Leah Guzman
Department of Environmental Science, Ateneo De Manila University, Quezon City, Philippines
Email: [email protected] Marion Lara Tan
John Gokongwei School of Management, Ateneo De Manila University, Quezon City, Philippines
Email: [email protected] Carissa Quintana
Department of Environmental Science, Ateneo De Manila University, Quezon City, Philippines
Email: [email protected] Jairus Carmela Josol
Crawford School of Public Policy, Australian National University Canberra, Australia
Email: [email protected]
Submitted: 23 April 2015; Revised: 28 July 2016 Structured Abstract
Purpose:
- Climate vulnerability assessments are often operationalized by the analysis of indicators defined by the spatial boundaries of the community under study. These, however, sometimes fail to capture interdependency among communities for basic resources. This paper proposes a framework for characterizing vulnerability caused by interdependency by adapting a supply chain lens.
Approach:
- The paper proposes a definition for “indirect vulnerability” that recognizes the transboundary and teleconnected nature of vulnerability arising from resource networks among cities and communities. A conceptual framework using a supply chain approach is presented for climate hazards in particular. This approach is then demonstrated through a rapid appraisal of the rice, energy and water supply chains and the waste management chains of Metro Manila.
Findings:
- The application of the supply chain lens to assessing the indirect vulnerability of Metro Manila brings to fore issues extending beyond the decision-making boundaries of local government units. Addressing these will require vertical government coordination and horizontal inter-sectoral
collaboration. Thus, this supply chain-based indirect vulnerability assessment can be complementary to traditional vulnerability assessments in providing a larger systems perspective.
Originality/value:
- Innovative tools are needed to make community vulnerability assessments both holistic and tractable. Existing methods in the private sector can be adapted rather than reinventing the wheel. This supply chain framework can be a useful decision support and planning tool across governance levels to comprehensively address vulnerability.
Keywords: climate, hazards, vulnerability, sustainable cities, supply chain
A supply chain framework for characterizing indirect vulnerability
Growing Communities, Interdependencies and Indirect Vulnerability
Cities are the center of economic, political, and commercial activities. However, most urban communities are dependent on areas outside of their jurisdictions for resources, waste disposal, and ecosystem services (Mori et al., 2012). Self-sustaining cities are rare (Porter et al., 2014) with most urban centers importing essential resources from beyond the city limits. For example, Beijing’s drinking water comes from catchment areas beyond its administrative boundary, especially during extreme droughts (Zhang et al., 2010). Also, Rio de Janeiro derives most of its energy needs from the Paraiba River Basin in the state of Gerais, with energy shortages felt in the city when a severe drought hit Gerais state in 2001 (De Sherbinin et al., 2007). Finally, flooding in the coast of Semarang, Indonesia, damaged its ports and trains, leading to food shortages as goods failed to reach markets (Da Silva et al., 2012).
Connectedness among communities therefore is a double-edged sword – resources are shared, but the impacts of hazards and disturbances are teleconnected (Preston et al., 2011). Each community is affected by the vulnerability of other areas which they depend upon especially for critical needs and transport networks (Pelling, 2003). As such, vulnerability assessments for communities must be enhanced to articulate this interdependency. This article therefore defines “indirect vulnerability” in the context of interdependency, and suggests a conceptual framework of analysis for climate hazards using a supply chain approach. To illustrate potential utility, the approach is applied to a rapid appraisal of the vulnerability of Metro Manila to climate hazards based on critical needs.
As it is, “vulnerability” is a complex interplay of physical, socio-economic, cultural, and political conditions, making it a challenging concept to operationalize and assess. The Intergovernmental Panel on Climate Change (IPCC) defined vulnerability as “the degree to which a system is susceptible to, and unable to cope with, adverse effects of climate change, including climate variability and extremes” (IPCC, 2001). Thus, vulnerability is a function of physical exposure to the climate hazard, sensitivity of the exposed system to the hazard, and the capacity to adjust and adapt. Climate hazards may be in the form of rapid onset events (such as extreme rainfall) or long-term shifts (such as increases in mean temperatures and sea level rise). Exposed elements may comprise not just populations but also assets such as water reservoirs, agriculture, and energy sources.
The above IPCC definition represents a biophysical type of vulnerability that is concerned with the potential impacts of a hazard given the properties of a system. This is differentiated in literature from social vulnerability which focuses on inherent properties of human systems (Brooks, 2003). Vulnerability in the social sciences refers to the pre-event state of society, as opposed to resilience, which is the ability to respond, recover and adapt after the event has occurred (Cutter et al. 2008). The sensitivity and adaptive capacity factors of the 2001 IPCC definition overlap with the concepts of social vulnerability (Brooks, 2003) and resilience, respectively, hence the choice of the IPCC framing in this paper to demonstrate the proposed approach.
This is not to overly simplify the rich literature on vulnerability. There are other conceptualizations and critiques of the concept and its components. Adaptive capacity is in itself a multidimensional concept, which may include characteristics such as redundancy, resourcefulness, robustness and rapidity (Simonovic and Peck, 2013), flexibility and ability to learn (e.g., as in Folke et al., 2002; Smit and Wandel, 2006; Fazey et al. 2007, among others). However, these have been reviewed elsewhere (e.g., as in Kelly and Adger, 2000; Brooks, 2003; Vincent, 2004; Fussel and Klein, 2006; Smit
and Wandel, 2006; Fussel, 2009; Turner, 2010; Preston et al., 2011) and will not be discussed in-depth here.
One common approach to concretizing vulnerability across different framings has been through the use of indicators. Key indicators for the components of vulnerability are identified, weights are assigned to these indicators, and the overall or composite vulnerability index is calculated (e.g., as in Cutter et al., 2003; Vincent, 2004; Brooks et al., 2005; Sullivan and Meigh, 2005; Hahn et al., 2009, among others). Examples of vulnerability indices developed at the country level include the Vulnerability Index for the Climate and Regional Economics of Development (VI-CRED) (Stanton et al., 2012), the Climate Vulnerability Monitor (DARA, 2012), and the Global Climate Risk Index (Harmeling and Eckstein, 2012). Vulnerability assessment is highly context-specific, so there is no standardized set of indicators. Indicators can be based on the framework adopted, the priorities of the community and the hazards they are exposed to. However, data collection for these indicators coincides with jurisdictional scales, lacking in-depth treatment of drivers outside the system of interest (Turner et al., 2003). For example, the Human Development Index (HDI), which comprises of life expectancy, education and income, has been evaluated to “outperform” other indices of social vulnerability (Gall, 2007 as cited in Fussel, 2009). However, the HDI articulates little about the basic resources required for living a healthy productive life – such as clean water and nutritious food – and where the community’s supplies come from. The agriculture and water sectors are already known to be climate-sensitive, and sources may be located in vulnerable areas. Therefore, crucial issues concerning provision of basic services could be overlooked, resulting in a false sense of vulnerability being less than in actuality.
This paper therefore explicitly defines “indirect vulnerability” as the vulnerability of a community arising from its dependence on other vulnerable communities for critical services or commodities. The concept of “indirect vulnerability” is not entirely new. Wallgren (2012) defines indirect vulnerability as the “effects that are experienced in a certain location as a result of the effects of changes to the climate of another geographic location.” Hunt and Watkiss (2011) recognize the “knock-on effect” on dependent city populations of climate impacts on agriculture production and transport infrastructure outside the city, or even the country. The Stockholm Environment Institute (SEI) similarly defines “indirect impacts” as “impacts that require adaptation in one place as the result of climate change somewhere else (Benzie, 2014).” They may arise from adjustments, including adaptation interventions, made by actors and stakeholders that feed back into the system and create vulnerabilities elsewhere (Atteridge and Remling, 2013). These concepts need to be better incorporated into climate vulnerability assessments.
Furthermore, different usages of similar terms have led to related – though subtly different – understandings of the “indirect” dimension. The use of “indirect impacts” or “indirect risks” in IPCC reports and sectoral and disaster studies denotes other pathways by which climate change affects the sector of concern. For example, in the health sector, direct impacts include deaths from heat stroke, while indirect impacts refer to illnesses and deaths due to vector-borne diseases enhanced by climate change (IPCC, 1997). In the NatureServe Habitat Climate Change Vulnerability Index (Comer et al., 2012), direct effects comprise actual climatic stress, exposure and changes in species composition, while indirect effects refer to factors that might compromise ecological integrity and resilience, such as habitat fragmentation and invasive species. In the agricultural sector, direct impacts consist of effects of temperature and precipitation on yields while indirect impacts include changes in soil quality through erosion, pests and the spread of diseases, or saltwater intrusion (Pearson and Langridge, 2008; Muller et al., 2011). Indirect impacts have also been defined as those cascading from direct shocks and impairing capacity to adapt (Da Silva et al., 2012).
There are also other terminologies being used that are similar to the concept of “indirectness”: Fussel (2009) documents the usage of the terms “internal” and “external” in reference to vulnerability
factors. Internal factors refer to those that are directly within the domain of a community, while external factors refer to those operating at larger scales but still affecting the community directly. Similarly, Turner et al. (2003) recognize human and environmental influences “outside the place” to account for factors operating in scales beyond that of the community being studied. Moser and Hart (2015) develop a related concept using the term “societal teleconnections” to describe the human networks that link activities and processes over distances. For country-level assessments specifically, SEI also recently developed a “Transnational” Climate Impacts Index which does account for indirect cross-border impacts, although the focus is on exposure rather than vulnerability (Benzie et al., 2016).
The concept of indirect vulnerability in this paper considers other pathways by which a community is affected by climate hazards aside from the primary or immediate impact. Specifically, it refers to pathways besides direct exposure of assets or populations within geopolitical boundaries. Like the concept of “teleconnections”, “indirect vulnerability” here highlights the external sources of vulnerability which create a ripple effect through resource networks. Impact and vulnerability assessments need to consider the physical exposure, sensitivity and adaptive capacity of extra-jurisdictional regions to which the community is connected. A transboundary understanding of the term “vulnerable” is needed, and other approaches should be explored to appreciate and understand the teleconnection of impacts. In this respect, the private sector can be of help.
Learning from the Private Sector
There are existing tools at the city or regional level that capture interdependencies. One example is the input-output (IO) model which captures the coupling of economies. The strength of the interregional IO approach lies in the detailed presentation of production and distribution characteristics of individual industries, and of interrelationships among industries and the economy (Isard, 1962). Possible applications have included quantifying sustainability (Guzman, 2010), and measuring vulnerability of GDP given disruptions in “lifelines” (utility, transport and networking services) (Crawford-Brown et al., 2013). However, IO as a tool has basic problems with the scope vis-à-vis data availability (Isard, 1953). If a region being analyzed is self-sufficient, providing detailed interregional flows will not be necessary. However, if the region has significant ties to other regions, as is the case for most cities today, then it will be necessary to provide a detailed account of the interregional flows, which often requires voluminous data (Isard, 1962). In most developing countries, data gaps exist especially in the reporting and processing of shipments via different transportation routes (air, rail, road, and water), making the creation of an IO more difficult (Guzman, 2010).
The urban metabolism approach is another tool that analyzes the flow of materials and energy and their transformation within a community (Kennedy et al., 2007; Ruth and Coelho, 2007; Barles, 2010). A related concept is the urban eco-footprint (Barles, 2010; Seitzinger et al., 2012). However, in both cases, the focus is on the internal efficiency of the city’s use of resources. Less emphasis is given to the sources of input, the destinations of output, the transport routes, and their respective vulnerabilities.
Thus, there is still room for tractable tools that can be applied readily (e.g., while a full IO analysis is being conducted), that will complement the gaps in urban metabolism approaches, and will enhance current vulnerability assessment methods. Ness et al. (2007) attempt to classify the many existing sustainability tools into three broad categories: indicators/indices, integrated assessments and product-related assessments. The first two categories are already being applied to study vulnerability, but the product-related assessments, which are commonly used in the private sector, are not typically applied for the purpose of community vulnerability assessments. Given the growing exchange of commodities and services between communities, it is perhaps timely to explore what approach can be adapted from the private sector. One such approach that can be adapted is the supply chain analysis.
Supply chain analyses have been used to ensure business continuity in the face of risks presented by global environmental change and environmental hazards. For example, Green Mountain Coffee Roasters (GMCR) engages supply chain actors, particularly the coffee growers in developing countries, to assess climate change impacts and prepare adaptation strategies (Amado et al., 2012; Olson et al., 2012). Lessons from the 2011 flooding in Thailand and the 2011 great earthquake in Eastern Japan also emphasize the importance of the robustness of production chains (Abe and Thangavelu, 2012; Ando and Kimura, 2012). These hazards damaged supply chains heavily; however, Thailand’s and Japan’s production networks worked quickly to adjust and restore the supply chains in their respective industries.
Academic literature on supply chain management has conventionally been conducted from the perspective of industries or business entities (Vachon and Mao, 2008). The study of supply chains examines integrated systems, looking into the intricate network of business entities (suppliers, manufacturers, distributors, retailers, etc.) working together to convert acquired raw materials to valuable finished products delivered to customers (Beamon, 1998; Min and Zhou, 2002). Building adaptive capacity in this context usually refers to local projects with communities that are nodes in the supply chain, for example, to enhance worker education and living conditions, or to ensure continued viability of climate-sensitive inputs (e.g., drought-resistance crops) (Norton et al., 2015).
There is scarce literature on assessing the supply chain networks using a political unit (e.g., country, state, city/municipality) as a focal point. However, established supply chain concepts, can be applied to the context of vulnerability assessments. By definition, the primary function of supply chain management is to ensure the functional delivery of supplies in the business environment. The supply chain is consistent with the concept societal teleconnections, which consist of a substance moved between locations, the process by which this is accomplished, and the physical structure to support the process (Moser and Hart, 2015). The supply chain approach can therefore be adapted and modified for a society perspective. This will ensure that societal functions operate to meet the needs of individual members (Oral, 2009) and to create conditions to reduce vulnerability.
Adapting Supply Chain Studies for Communities
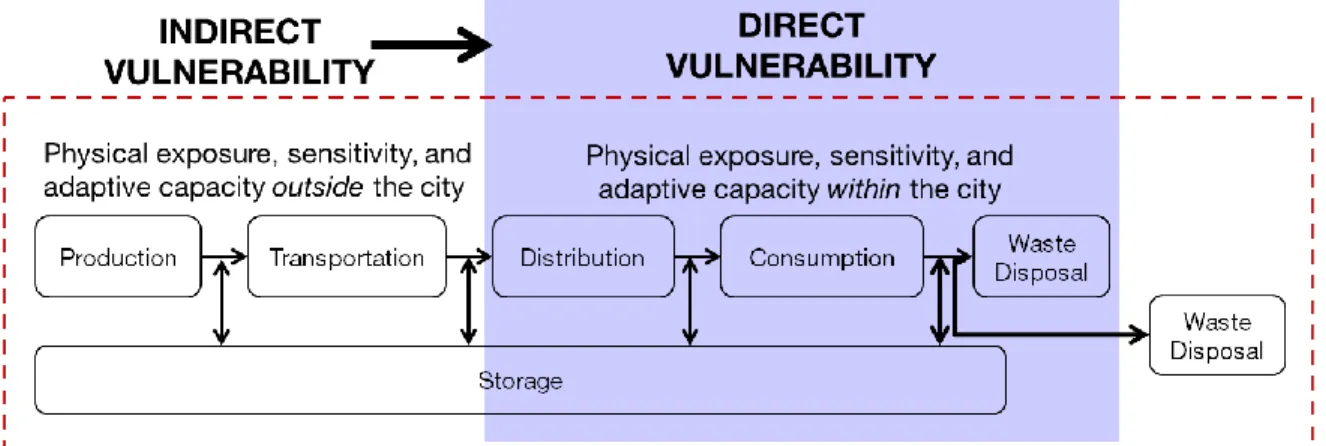
The definition of “indirect vulnerability” can therefore be refined in the context of a supply chain framework (Figure 1). The indirect vulnerability of a community is concerned with the dependence on external but also vulnerable areas that form links in the supply chain (e.g., as sources or suppliers, transport routes, storage and distribution centers, and even waste disposal locations). Each link in the chain has its own physical exposure to hazards, sensitivity issues and adaptive capacities. These all contribute to the vulnerability of the communities they serve beyond their political boundaries. When applied to critical needs (e.g., food, water, energy), the supply chain framing can help better (1) link sectoral resource vulnerability assessments to community-level vulnerability assessments, and (2) link indirect to direct vulnerability assessments. Supply chain analyses can be incorporated into climate hazard vulnerability assessment in through the study of a community’s supply network as a whole, and/or through the study of each supply chain individually.
Figure 1. Conceptualizing indirect vulnerability in the context of supply chains
In applying the first approach to the IPCC components of vulnerability, for example, a characterization of physical exposure involves the physical and spatial analysis of supply chain nodes (e.g., sources, transport routes, storage and distribution centers), cross-referenced or overlaid (i.e., if mapping software is involved) with climate variability maps (e.g., extreme rainfall and flooding maps) and/or climate change projections. The sensitivity analysis involves the study of factors affecting the strength of and access to the elements of the supply chain. These factors could be socio-economic, political, logistical or cultural in nature. The redundancy of chains (i.e., having several sources for a critical commodity), the availability of inventory in strategic storage, and having alternate delivery options could speak to adaptive capacity in the sense that the community has contingencies in case of disruptions. While this multiple-chain analysis can provide a bigger picture of a city’s support networks, it could also potentially be resource-intensive, particularly of spatial data. This approach could alternatively be used to identify the key supply chains in each sector to focus attention on.
If individual supply chains are considered, then each node in the supply chain could be analyzed in-depth. A vulnerability assessment for a city using a supply chain lens could then consist of linked vulnerability assessments of the nodes of the chain, including the networks of transport routes and storage areas. Furthermore, the framework can be adapted for indicator and index development if desired. In the analysis of individual chains, specific indicators can be scored and aggregated to develop an overall index of the vulnerability of the chain, and to compare across chains of the same product/service. This will help communities identify and prioritize which chains in the network need strengthening. The narrower spatial scope of individual chains allow for more in-depth analysis of logistical and time-dependent issues through the use of operations research (OR) tools, material flow analysis, and systems dynamics modeling.
However, even in the absence of a quantitative scoring system, the detailed description and spatial mapping of supply chain-based indirect vulnerability will already be a crucial and critical component of adaptation and sustainability planning. To demonstrate, an initial and exploratory qualitative rapid appraisal of Metro Manila is presented. This case study focuses on critical needs – rice (the main food staple), water, and energy – and waste management. The study attempts to construct basic supply chains and to scope issues that could potentially contribute to indirect vulnerability.
Case Study: Metro Manila
Metro Manila, also known as the National Capital Region (NCR), is the socio-economic and political center of the Philippines. NCR accounts for more than one-third of the country’s GDP (NSO-NCR, n.d.), occupies 0.2% of the country’s land area but houses approximately 12 million people as of
the 2010 census (NSO-NCR, 2012). Often regarded as a mega-city, it is divided into 17 local government units (LGU) – one each for its 16 cities and one municipality. Each of these LGUs is headed by a mayor and is subdivided into smaller units called barangays. City borders are porous in terms of the movement of people and goods. A regional level body called the Metro Manila Development Authority (MMDA) assists the LGUs in implementing development plans, mostly in the transport and infrastructure sectors; however, decision-making (i.e., on comprehensive land use planning, socio-economic and health services) is usually done at the LGU level.
Among Southeast Asian countries, NCR was ranked as highly vulnerable, considering physical exposure to multiple hazards and its high population density (Yusuf and Francisco, 2009). NCR actually ranked highly in terms of adaptive capacity, but this component was operationalized using three categories of indices: socio-economic (HDI, poverty incidence, and income inequality), technology (electricity coverage, extent of irrigation) and infrastructure (road density and communication). Rural and peri-urban areas which provide the mega-city's food, water and energy were lower-ranking on the adaptive capacity scale. Given the mounting pressures within the urban center from increasing populations and demands for space and resources, NCR is far from being self-sufficient in basic necessities. It relies on surrounding areas for food, water and energy, and also for landfills to dispose of generated wastes.
To characterize the supply chains for rice, water, electricity, and waste, a top-down approach was used, beginning with the government agencies mandated to oversee these resources. In addition, since the rice and solid waste sector have more diffused players, a bottom up approach was also used to validate the supply chains from the retail and community level. Information from both top-down and bottom-up approaches were analyzed to identify issues contributing to physical exposure, sensitivity and adaptive capacity. For the physical exposure aspect in particular, Geographic Information Systems (GIS) was used to map key components of the supply chain vis-à-vis climatic hazards. Key findings are discussed in the succeeding sections.
Rice Supply Chain
Top-down approaches include interviews and secondary data-gathering from the agencies or institutions mandated to manage aspects related to rice. These include the National Food Authority (NFA), whose mandate for food security includes the stabilization of the supply and price of staple cereals (NFA, n.d.).; the National Economic and Development Authority (NEDA), the country’s lead agency for macroeconomic forecasting, policy analysis and research towards developing sectoral plans (NEDA, n.d.); relevant offices of the Department of Agriculture (DA), specifically, the Rice Program, the Bureau of Agricultural Statistics and the Bureau of Soils and Water Management; the Philippine Rice Research Institute (PhilRice), whose focus is on technology development, particularly concerning rice varieties and rice production; and the Philippine Atmospheric, Geophysical, Astronomical Services Administration (PAGASA), which provides weather and climate forecasts to concerned sectors. Additional data were also obtained from the offices of the Philippine Statistics Authority (PSA) and a supplementary interview was conducted with the Food and Agriculture Organization (FAO) in the Philippines to further scope the ongoing projects relating to rice. NFA, NEDA, DA, PAGASA and PSA along with National Irrigation Administration (NIA), the Bangko Sentral ng Pilipinas (Central Bank of the Philippines), the Department of Trade and Industry (DTI) and farmers’ representatives form an inter-agency Food Security Committee on Rice (OPAFSAM, 2015). To complement institutional data, bottom-up methods involved visits to markets across Metro Manila to interview rice stall operators (both commercial and NFA rice), and interviews of wholesale distributors and rice mill operators.
Based on literature from government agencies (Dela Peña, 2014a; Dela Peña, 2014b; Dela Peña, 2012; NEDA & UNDP, 2005) and interviews with the Philippine Rice Research Institute (PhilRice), the
post-harvest supply chain begins with portions of the harvest allotted as payment to threshers and harvesters as a type of in-kind sharing. Portions may also be allotted for personal consumption, as irrigation fee, as seeds for the next planting season, and as feeds. The remaining marketable surplus is typically 50-52%, although smaller farms may not have any marketable surplus left (A Briones-Mataia 2015, personal communication, 4 March). This surplus, which is still in the form of rice grains with husk, is then sold to traders or assemblers, itinerant traders, other agents (e.g., of private firms), cooperatives, or the National Food Authority (NFA). The rice is processed at milling stations in Bulacan and Nueva Ecija, then distributed to wholesalers and retailers.
The stocks and flows of government rice into NCR are documented through the NFA. Based on data over the past decade, the major suppliers of rice to the megacity include the provinces Isabela, Cagayan, La Union, and Pangasinan (in Northern Luzon), Nueva Ecija and Bulacan (in Central Luzon), and Mindoro island (South Luzon). NCR also receives rice from Nueva Vizcaya, Kalinga, Ilocos Norte, Ilocos Sur, Pampanga, Zambales, Tarlac, Bataan, and Batangas (see supplemental material)1. The main transport route from the major rice producing provinces in the north to NCR is via the North Luzon Expressway (NLEX). The few that are in the south but still on Luzon mainland (e.g., Batangas) are transported by the South Luzon Expressway (SLEX). Stock from the island of Mindoro is transported via barge. In contrast, commercial rice stocks and flows are not as well-documented and most companies approached (e.g., wholesalers, retailers, supermarket chains) were reluctant to disclose information. The data obtained on commercial rice stocks came mainly from NFA surveys (see supplemental material).
Physical Exposure of the Rice Supply Chain
Rice yields are highly dependent on short-term and long-term climatic factors. Extreme events such as typhoons, floods, and droughts affect the water supply of crops, which cause physiological changes and stress if they occur during critical stages. These three types of events accounted for 82.4% of total rice loss in the Philippines from 1970-1990 (PhilRice-BAS, 1994). More recently, typhoons affecting Northern and Central Luzon such as Typhoon Santi (in 2013), Typhoon Kuppo and Typhoon Melor (in 2015) resulted in over Php 6 billion worth of damages in the rice sector. Figure 2 (left) shows the location of provinces that are major and minor suppliers of rice to NCR vis-à-vis recent typhoon tracks. Rice supplying provinces in northeastern, central and southern Luzon are prone to flooding (Figure 2, right). Flooding has also been observed on the major expressways (both NLEX and SLEX) connecting the rice supplying provinces to NCR. Storage and distribution are also of concern since several NFA warehouses and the markets in NCR are located in flood-susceptible areas (Figure 3).
Over the longer term, rice yield has been found to be affected by night-time temperature and growing season minimum temperatures. Based on a study conducted in the province of Laguna, Peng et al. (2004) found that rice yield decreased by approximately 10% for every 1°C increase in growing season minimum temperatures, and approximately 15% for every 1°C decrease in growing season mean temperatures. Historical analysis of climate data over the Philippines from 1951-2009 shows a significant increase in the number of hot days and a decrease in the number of cold nights (PAGASA, 2011). Furthermore, the national meteorological agency projects increases in seasonal temperatures between 0.8 to 1.0°C (PAGASA, 2011). More local, contextualized studies are needed to ascertain impacts on future rice yields given current environmental conditions and management practices.
Figure 2. (Left) Provinces supplying rice to NCR and typhoon tracks from 2010-2014; (Right) Flood hazard scores for provinces supplying rice to NCR. [Figures created by the authors using political boundary and road maps from the National Mapping and Resource Information Authority (NAMRIA); Typhoon tracks from the Joint Typhoon Warning Center (JTWC); Rice supply data from the National Food Authority
Figure 3. Locations of NFA warehouses, markets, landfills and road networks in Metro Manila vis-à-vis flood hazard ratings. [Figure created by the authors using data from NFA, MMDA and NSWMC with locations approximated using Google Maps; Flood hazard approximation generated from Philippine GIS
Data Clearinghouse (PhilGIS), NAMRIA and Google Maps]
Sensitivity Issues in the Rice Supply Chain
The lack of transparency of commercial rice flows is a concern from a planning perspective. Small-scale retailers interviewed on the ground seem to be unaware of the origins of their rice, and arrangements with suppliers seem to be somewhat informal and dependent on personal relationships. Many retailers and distributors are reluctant to share supply chain information, even with government researchers. This could be due to the politics surrounding rice as a commodity, and the existence of cartels that may influence prices (e.g., by hoarding rice supplies) and of smuggling (Dela Peña, 2014a). These factors make it difficult to determine what buffer stocks really exist and will be made accessible in times of critical need.
The National Economic Development Authority (NEDA) also identified other gaps such as the lack of efficient infrastructure to distribute rice and traceability issues for local markets. Interviews with government agencies revealed that historical yield statistics are routinely included in supply forecasts, and that seasonal climate forecasts are also regularly communicated to concerned stakeholders. However, it is not clear to what extent climate change projections are systematically incorporated in long-term policy
and economic initiatives. These issues, together with the uncertainty in future yield estimates, aggravate an already fragile sector. On the research end, development and testing of less climate-sensitive rice varieties (e.g., drought- or flood-resistant) is underway. However, the widespread distribution of such varieties will have to be balanced against the cost. Farmers are among the poorest households in the country, with the agriculture sector declining in productivity and contribution to GDP (Cayabyab, 2013; Habito and Briones, 2005).
Adaptive Capacity Issues in the Rice Supply Chain
Provinces in Northern and Central Luzon – important nodes in the supply chain – have been assessed to be within the top 40 of 132 vulnerable districts/regions across Southeast Asia (Yusuf and Francisco, 2009). However, due to data and transparency gaps, it is difficult to assess how a disruption in a supply chain will affect NCR. Private retailers/wholesalers likely source from the different provinces of Luzon, so availability of supply from alternate sources may be less a problem than physical and economic accessibility (i.e., issues of hoarding and price increases during flooding events). When forecasts show that local supplies may be insufficient, the government imports rice, e.g., from Thailand, Vietnam. However, these countries will likely be affected by climate change as well, making the rice demand-and-supply issue a regional to global one. In terms of transport, there are no alternate routes to the NLEX and SLEX aside from provincial roads. This leads to delays of deliveries into Manila during extreme rainfall events. The buffer stocks required by NFA could act as a coping mechanism in times of supply chain disruption; however, as mentioned previously, many of these in NCR are also located in flood-prone areas.
Over the longer term, adaptive capacity of the rice sector will depend on the level of investment in the agriculture sector to improve the socio-economic status of farming households, strengthen the infrastructure to distribute rice, systematically incorporate climate forecasts and projections in policy-making, and implement appropriate adaptive management techniques. The supply chain lens should also be extended to consider climate change impacts on other countries from which the Philippines imports rice.
Water Supply Chain
In order to characterize the water supply chain for Metro Manila, both government agencies (including, NEDA, the Metropolitan Water Works and Sewerage System (MWSS), and the National Water Regulatory Board (NWRB)) and public utility companies (such as, Manila Water and Maynilad) mandated to manage and provide potable water to Metro Manila were interviewed. Aside from the key informant interviews, secondary data from MWSS, Manila Water, National Power Corporation (NPC) and the Asian Development Bank (ADB) were also obtained to help identify how water in NCR is distributed from the source to the end user.
Raw water for NCR comes from three sources, namely, the Umiray-Angat-Ipo system (located in Norzagaray, Bulacan, north of NCR), Laguna de Bay (south of NCR), and ground water pumps located in various areas (see supplemental material). The Umiray-Angat-Ipo system provides approximately 96%, while the Laguna de Bay supplies 3% and ground water pumps contribute 1% of NCR’s raw water (Maynilad, 2012; Manila Water, n.d.). In NCR, water distribution is divided into the East and the West Zones and serviced by Manila Water and Maynilad, respectively (see supplemental material). Both concessionaires are under the direct supervision of Metropolitan Waterworks and Sewerage System (MWSS), which provides both companies raw water (MWSS, n.d.).
The Umiray River flows into Angat Dam, which is connected to the Ipo Dam via the Angat River. From Ipo Dam, water travels through three tunnels to Bigte Settling Basin and from there, the water is divided between the East Zone and the West Zone in a 40-60% split. Water intended for the West Zone is directed to a treatment plant before distribution. West Zone demand is augmented by water from Laguna de Bay which is also treated and stored prior to distribution. Water for the East Zone is stored in La Mesa Dam for future treatment or directly sent to a filtration plant. Treated water is stored in reservoirs prior to distribution. Water demand for each zone is supplemented by groundwater pumped within Metro Manila and from the province of Cavite (Maynilad, 2012).
Physical Exposure of the Water Supply Chain
The Angat Watershed System is located in the provinces of Bulacan, Quezon, and Rizal while Laguna de Bay is between the provinces of Laguna and Rizal. These provinces are prone to extreme weather events such as drought and intense rainfall. For instance, from the 180-meter critical water level, the water level in Angat Dam fell to 158 meters in 1998, to 173 meters in 2007, and to 157 meters in 2010. This resulted in decreased water pressure and water rationing in several parts of NCR. Precipitation forecasts show marked decrease in precipitation over Luzon suggesting water security issues may further be aggravated (see supplemental material). During the typhoon season (May – November), the Angat Dam system (including La Mesa Dam) reaches its maximum storage capacity and spills over. Laguna de Bay also overflows, causing severe flooding in surrounding areas. Erosion and run-off induced siltation in Angat and Laguna de Bay have been blamed for decreased storage capacity.
Sensitivity of the Water Supply Chain
NCR’s water supply is sensitive to climatic variability because Angat Dam, often affected by extreme weather events, is the only main source of raw water for the area, supplying almost all of the city’s raw water demand. The water supply capacity is estimated at approximately 4100 MLD (million liters per day), with demands in the MWSS service areas estimated to increase to 4,500 MLD by 2020 and 5,300 MLD by 2037 (CTI Engineering International Co., Ltd., 2012). In addition, the dam’s infrastructure is time-worn, making it prone to damage during extreme weather events such as high temperatures and/or sudden and extreme temperature changes.
Adaptive Capacity of the Water Supply Chain
NCR’s water supply lacks redundancy. In addition, the number and capacity of treated water storage facilities are not enough to store NCR’s entire water needs. The construction of a diversion tunnel from Sumag River located in Umiray, General Nakar, Quezon is underway (64.53% complete as of time of writing) as another means to augment the water coming from Angat River (MWSS, 2016a). A New Centennial Water Source project will harness the Kaliwa-Kanan-Agos River Basin as an alternative water source (capacity 600 MLD) for Metro Manila, but as of writing, this project is still in the bidding stage (MWSS, 2016b). Other water sources, mostly north of NCR, are in the proposal or feasibility study stage (CTI Engineering International Co., Ltd., 2012). As for the availability of water to Metro Manila in the event of a catastrophe, Manila Water has invested in water trucks that can be used to deliver water to its concessionaires when necessary, a practice already implemented in other service areas after earthquakes and flood events. No information was obtained from Maynilad regarding their plans to supply water to Metro Manila in case of systems failure.
During the interviews conducted, government agencies and water concessionaires mainly considered weather and seasonal forecasts and geophysical hazards threatening NCR’s water supply. It was not clear to what extent long-term climate change projections and impacts were systematically considered in planning, demand forecasting and allocation of water uses.
Adequate demand side management schemes, which can provide incentives to consumers to conserve water use especially during low water months, are not in place (Guzman & Estiva, 2013). The protocol during low water levels limits and/or stops the use of the dam’s water for hydropower and irrigation to prioritize providing water to NCR. However, it is unclear how the protocol is monitored for compliance. Likewise, the protocol is simply a stop-gap measure used to prevent conflict in the usage of water.
Energy Supply Chain
The scope of the energy study focused mainly on electricity. To characterize the energy supply chain, official documents from the Department of Energy (DOE) and the National Grid Corporation of the Philippines (NGCP) were used, such as: the Philippine Energy Plan, the Transmission Development Plan, the Distribution Development Plan, and the Power Situationer. The known energy supply chain was verified through interviews with key informants from supply chain players such as the Meralco Corporation (the electricity distribution company for NCR) and the National Power Corporation.
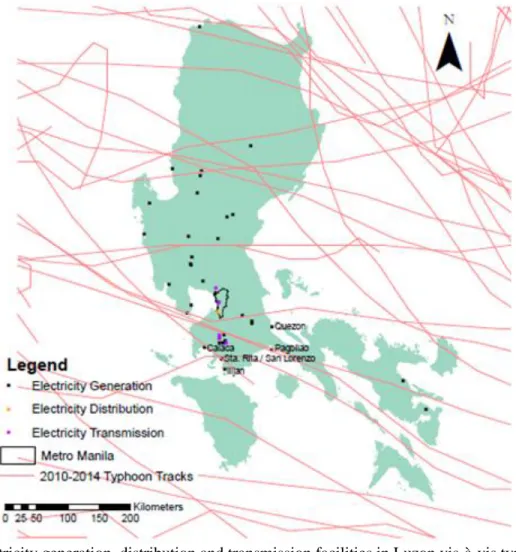
As of 2013, NCR’s power supply mainly comes from eight major power plants spread throughout Luzon. Six south Luzon generators accounts for at least 76% of the entire metropolis’ supply; Sta. Rita - natural gas (26%), Ilijan – natural gas (21%), Quezon – Coal (8%), San Lorenzo – Natural Gas (8%), Pagbilao – Coal (8%) and Calaca – Coal (8%) (NGCP, 2013). The National Grid Corporation of the Philippines (NGCP) manages transmission. Points of entry from transmission are through eight 230kV substations spread around the metropolis. The Meralco Corporation handles distribution in NCR.
Physical Exposure of the Energy Supply Chain
Physical exposure issues involve climate hazards that reduce productivity in the generation, transmission, and distribution of energy. These include disruptions caused by extreme weather events and potential damages caused by long-term climate change effects such as increased occurrences of flooding and rise in air temperature (ADB, 2013).
Throughout the chain, electric supply is normally served using an overhead system. Assets used in the energy supply chain are designed to withhold weather pressures, where power lines can withstand winds up to 200kph. However, these power lines are still susceptible to interferences associated with strong winds such as uprooted trees and other debris. For example, due to Typhoon Rammasun in 2014, 90% of the NCR franchise area experienced power outage from downed poles and transmission lines (DOE, 2014). Although NCR may not be in the direct path of typhoons (Figure 4), the exposure of generation and transmission assets elsewhere contributes to the vulnerability of the metropolis.
Potential infrastructure damage may be caused by increase of flooding events in asset controlled areas which affect aboveground lines and substations. As noted during the mapping of energy assets, many electricity substations are near areas of extreme flooding
Increase in air temperature is also a physical exposure that stresses the energy system. Warmer temperature impacts generation, transmission, and distribution. High air temperature can reduce generation efficiency and output; transmission lines tend to have higher resistance during warmer temperatures; energy demand increases as customers seek energy for cooling purposes (ADB, 2013).
Figure 4. Electricity generation, distribution and transmission facilities in Luzon vis-à-vis typhoon tracks. [Figure created by the authors using Luzon and Metro Manila outlines from NAMRIA; Typhoon tracks
from JTWC; Electricity generation, distribution and transmission location from the DOE.]
Sensitivity Issues in the Energy Supply Chain
Some inherent or social factors influence the degree to which the energy system is affected. Some issues to consider would be the changes in population and compliance to infrastructure installation codes. Luzon’s peak demand for 2014 was at 8,717 MW (DOE, 2014). Historically, Meralco’s NCR distribution accounts for approximately 50% of the entire Luzon demand; estimated demand for 2014 was at 4,492 MW (NGCP, 2013). The projected demand for Luzon and NCR in 2012 was expected to increase to 11,165 MW and 5,508 MW respectively (NGCP, 2013).
As of 2014, the Luzon grid has a total of 11,622 MW dependable capacity (DOE, 2014). However, outlook for 2030 requires a total of 13,000 MW additional capacity for the entire Philippines; of which additional 10,500 MW capacity will be attributed for the Luzon grid (Somani et al., 2014). New capacity needed to be built starting in 2016 to meet this demand. However, of the 13,000 MW needed, only 1,800 MW capacity has been committed (DOE, 2012). As of 2014, demand is still met by capacity. However, 2016 and beyond will be critical; proposed capacity plans must be realized to avoid power outages.
One of the major vulnerability concerns in energy infrastructure are the installations: whether there is a system of re-evaluation given changing environmental conditions, whether old installations are upgraded, and whether new installations are built according to standards (Paskal, 2009). Based on an interview with Meralco, transmission and distribution lines should withstand 200kph wind shear. Sensitivity issues arise regarding whether or not electricity assets follow building standards.
Adaptive Capacity Issues in the Energy Supply Chain
Increasing variability and unpredictability caused by environmental change requires networks to become more flexible and adaptive (Paskal, 2009). Currently, 76% of NCR’s energy system comes from Southern generators and the Southern Transmission corridor. For the energy supply chain of NCR to become adaptable means improvement in transmission and distribution. The Asian Development Bank guidebook (2013) prescribed “specifying redundancy in control systems, multiple transmission and distribution routes, relocation and/or underground distribution for protection against wind, high temperatures, corrosion and flooding may be considered”.
Demand-side management through reducing energy consumption, on the other hand, requires institutional change on electricity generation and urban planning (Sahakian and Steinberger, 2011). Sahakian and Steinberger’s study of Metro Manila’s energy consumption concluded energy reduction cannot be attained by merely influencing consumer behavior solely on moral or cost basis. Rather, reduction should be coursed through structured policy measures in the energy industry and in city planning. Cleaner generation mix at the national level and better urban systems at the city level are major issues that need to be tackled to improve adaptive capacity through demand reduction.
Solid Waste Management Chain
For the top-down perspective, interviews were conducted with the National Solid Waste Management Council (NSWMC), which is the major agency tasked to implement Republic Act 9003 (Ecological Solid Waste Management Act of 2000) on a national level, and the waste division of selected local government units – the Quezon City Environmental Protection and Waste Management Division (QC EPWMD) and the Pasay City Community Environment and Natural Resources Office (Pasay CENRO). However, some administrative services transcend political boundaries. The Metropolitan Manila Development Authority (MMDA) which assists the LGUs in takes care of such services, which include solid waste disposal and management (i.e., policy formation and implementation of proper solid waste disposal). Private entities, contracted by the abovementioned government agencies, were also interviewed. For the bottom-up perspective, markets in the various Metro Manila cities and municipality were also visited and interviewed.
In residential areas, solid waste is collected door-to-door, while for larger establishments such as malls or markets, tenants or management transfer wastes and temporarily store these in a collection station. Waste haulers collect the waste from households or from collection stations at least once a day and bring these to the final disposal sites. By law, landfilling is the only legal means of waste disposal in the Philippines. NCR’s waste is disposed of in three sanitary landfills (SLF), two are within the political boundaries of NCR (the Quezon City SLF and the Navotas SLF) while the Rizal SLF is found outside of NCR (Figure 3). Transportation to the Quezon City SLF and the Rizal SLF are by land, while the Navotas SLF may only be reached by sea.
When asked about climate related hazards in their areas of responsibility, stakeholders highlighted experiences of flooding during extreme rainfall events. Typhoon Ketsana in August 2009 provided the most severe experience so far when a total of 448.5mm of rain fell over a span of 12 hours (Abon et al., 2011), resulting in 239 barangays flooded in NCR and 37 road sections impassable for light vehicles (NDCC, 2009). Aside from collection and transportation, landfill disposal is also affected by climate related hazards. Interviews indicate that the Quezon City SLF may be affected by extreme rainfall that may result in flooding in low-lying areas of the SLF, erosion and slope failures (which have led to fatalities within the landfill in the past), and cracks in compacted waste.
The Navotas SLF management is not concerned about flooding because the dikes built to protect the SLF were designed to accommodate more than the 25-year worst flood level. However, transport of waste to the Navotas SLF is regulated by weather. When travel by sea is prohibited, the waste is left at their collection station by the pier.
These denote that NCR’s solid waste supply chain has been – and will continue to be – affected by climate and weather hazards, most significantly by extreme rainfall-induced flooding. This exacerbates the problems already caused by uncontrolled or poorly planned development and improper waste disposal.
Sensitivity Issues in the Waste Chain
While flooding has been indicated as a climate change hazard of concern, interviews with local government representatives and market stall owners indicate that no serious disruption in the collection of solid waste – even during extreme weather events – was experienced. The worst reported cases are only hours-long delays in collection due to floods. The size and height of garbage trucks allow them to travel to some extent on flooded roads. Collection, transportation, and disposal is continued later in the day when flood waters recede and thus, solid waste is still collected at least once daily, especially in public markets. Waste collectors interviewed validate this and concur that no other disruptions have been experiences save for the delays in collection.
For the Navotas SLF, no alternative routes exist and the company relies on the size of the Pier 18 collection station to accommodate un-transported wastes while travel by sea is prohibited.
Adaptive Capacity Issues in the Waste Chain
As a supply chain, NCR’s solid waste management system can accommodate climate- and weather- related impacts at minimum disruption. Collection stations for large scale operations such as shopping malls and public markets can accommodate accumulated solid waste even when flooding results in missed collection. Garbage trucks are large enough to operate during low level floods and only have to wait a few hours for high level floods to recede. While the Navotas SLF can only be reached by barge, the Pier 18 transfer station has so far been able to accommodate 4-day accumulated waste. Disposal redundancies also exist. Two of the three SLFs that service NCR may be reached by land and ready to accommodate waste from the other, in the event of a major blockage.
Overall Assessment of NCR’s Indirect Vulnerability
The application of the supply chain lens to NCR’s critical needs reveals weak links that give rise to the indirect vulnerability of the mega-city. Disruptions outside the geopolitical boundaries of NCR highly affect downstream operations. First are issues with supply. Rice supply is already an issue due to
weather and climate hazards, and physical and economic accessibility aggravates the problem. Water supplies and electricity generation have insufficient alternatives. Second, transport routes or transmission systems and storage/distribution centers need to be re-examined for location and feasible alternatives. Third, stronger policies and implementation thereof are needed to regulate distribution and prices. Last, even in cases like the waste management chain which has demonstrated minimum disruption, improving the system to adapt to potentially stronger future events or cumulative climate change impacts may be necessary.
Clearly, these issues present a challenge for governance and decision-making within NCR, particularly given the number of stakeholders. There are already 17 local government units in the area, each managing the delivery of basic services in their own territories. In addition, there are the NCR-level bodies (e.g., MMDA) and national-level institutions that oversee the resource chains. Addressing supply chain vulnerabilities will go beyond the current mandate and responsibility of any one body. While the vulnerability assessment may be initiated at the local or NCR level (as has often been the case), strengthening the supply chain will require local- to national-level dialogue and coordination to target gaps and overlaps. Furthermore, this initial scoping study of NCR was limited to the national level, and to other agencies mentioned earlier who were willing to share information. It is recommended for a regional- (e.g., Asia) to international-level study to be conducted as well, given that critical needs such as rice and fuel are also imported.
Thus, the drivers of the overall vulnerability of NCR necessitate a broader perspective than has been considered in previous studies. With only four chains considered in this study, future research could similarly apply the supply chain approach to other key resources for NCR (e.g., other food staples and water-intensive products, building materials, fuel). Future initiatives also need to delve more comprehensively into the impacts of a failure of these supply chains, including how such a failure will affect the direct vulnerability indicators of Metro Manila. For example, how will HDI be affected without adequate food and water? How will communication and transportation infrastructure fare without sufficient energy supply? Solutions to these problems could be developed by addressing the nodes of the supply chain; however, it should also be noted that, in the case of demand-side management, for example, adaptive capacity can also include the ability of the mega-city itself to regulate its own consumption, and therefore, the magnitude of its own dependencies.
Conclusions
Increasing interdependencies among communities, cities, and countries for the provision of basic needs and commodities further contributes to an already complex web of vulnerability. Thus, for comprehensive adaptation and development planning, it becomes necessary to consider the indirect vulnerability arising from our reliance on outside areas to supply our needs. Tools and approaches from other sectors that may enhance existing climate change vulnerability assessments should be explored. The supply chain analysis is one such tool coming from the private sector that can assess the network of support for a community. In considering the different components of resource chains, this approach brings to the fore issues that might not be given as much attention by a direct and indicator-based vulnerability assessment. Constructing a supply chain is an attempt to characterize what actually happens on the ground in the process of getting critical resources to where they are needed and used. While the supply aspect, for example, is often already included in sectoral vulnerability assessments, the aspects of transport and storage are highlighted more in a supply chain approach. Complexities in governance also emerge as we see how decision-making is diffused and distributed among actors in the chain who have different mandates and scales of responsibility, as seen in the NCR case.
Extending our perspective with this lens will hopefully motivate more collaborative and coordinated inter-governmental and inter-sectoral approaches while counteracting tendencies to operate in silos. This is crucial to generating and sustaining positive synergistic impacts. Such an approach also enables governing bodies to identify inefficiencies within these systems. These inefficiencies may then be addressed to improve the overall integrity of the supply chains. This will lead to enhanced guidelines and strategies to ensure minimal disruptions in the basic support services for communities.
There are still challenges to contend with, as the case study of NCR has shown. As with any tool or assessment, data availability and accessibility and transparency of decision-making are practical concerns. However, one can apply this framework precisely as a means to scope these issues and identify gaps, thus creating an opportunity to re-evaluate monitoring and data-gathering systems. This approach can provide the motivation and justification to implement mechanisms to document, track and access key indicators that may extend beyond city boundaries. This approach may also be valuable as a complement to other methods – for example, demand-side management emerged as a consideration for adaptive capacity. In the case of cities, an urban metabolism study of these particular resources can help deepen the understanding of how consumption can be regulated and dependencies reduced.
Lastly, the supply chain approach is flexible and adaptable to different contexts. The selection of chains to be assessed should be aligned with the community’s priorities and goals. For example, key imports and exports, or climate-sensitive products crucial to the city economy may be considered. As with current vulnerability assessments, the indicators to be used and the weighting systems to be applied (if composite index development is the goal) are best adapted to local realities.
The authors further propose that the approach can be adapted for different framings of vulnerability as well. This paper uses the IPCC definition of vulnerability but the concept can be used with other conceptualizations of vulnerability and related concepts (for example, applying instead the UN definition of risk as a function of hazard, exposure, and vulnerability to the supply chain nodes). Lastly, future research can also adapt the supply chain lens for different systems other than communities. The private sector has already demonstrated how this is applied to individual business. The supply chain can also be adapted for sectoral studies (e.g., to examine the inputs to and outputs of the agricultural sector). What is important is the linking of indirect and direct dimensions to establish a larger systems perspective.
Acknowledgements
This paper was supported by a grant from the Ateneo de Manila University (ADMU) University Research Council (URC) for the project #URC-14-01 “An Application of Supply Chain Analyses to Assess Indirect Vulnerability to Climate Change: A Pilot Study of Metro Manila.” The authors thank the following research and student assistants: Marie Joy Ann Chua, Kevin Bartolome, Carmela Magayanes and Philip Joshua Bernadas. For the energy sector, specifically, we would like to acknowledge Pamela Joyce Baluyot,
Andy Dela Cruz, Jr., Maria Nastasha Dugan, Matthew Henri Falcotelo, Gabrielle Go, Allan Javison Guzman, Richard Patrick Sun, Jr., and Robert Christian Tiong, The authors thank the anonymous reviewers for their helpful comments. We also thank Dr. Rosa Perez for the learning and exposure to vulnerability assessments.
References
Abon, C.C., David, C.P.C. and Pellejera, N.E.B., (2011), "Reconstructing the Tropical Storm Ketsana flood event in Marikina River, Philippines", Hydrology and Earth System Sciences, Vol. 15 No. 4, pp.1283-1289.
Abe, S. and Thangavelu, S.M., (2012), “Natural Disasters and Asia: Introduction”, Asian Economic Journal, Vol. 26, pp. 181–187.
Amado, J.-C., Adams, P., Colemen, H., and Schuchard, R., (2012), Value Chain Climate Resilience, Oxfam America, Boston, Ma.
Ando, M., and Kimura, F., (2012), “How did the Japanese Exports Respond to Two Crises in the International Production Networks? The Global Financial Crisis and the Great East Japan Earthquake”, Asian Economic Journal, Vol. 26, pp. 261–287.
Asian Development Bank (ADB), (2013), Guidelines for Climate Proofing Investment in the Energy
Sector, Pasig City, Metro Manila.
Atteridge, A. and Remling, E., (2013), “The Indirect Effects of Adaptation: Pathways for Vulnerability Redistribution in the Colombian Coffee Sector”, Working paper 2013-10, Stockholm Environment Institute, Stockholm, Sweden, December.
Barles, S., (2010), “Society, energy and materials: the contribution of urban metabolism studies to sustainable urban development issues”, Journal of Environmental Planning and Management, Vol. 53 No. 4, pp.439-455.
Beamon, B. M., (1998), “Supply Chain Design and Analysis: Models and Methods”, International
Journal of Production Economics, Vol. 55, pp. 281–294.
Benzie, M. (2014), “National Adaptation Plans and the indirect impacts of climate change”, available at: https://static.weadapt.org/initiatives/files/49/5475ef5f947cesei-pb-2014-indirect-climate-impacts-naps.pdf. (accessed 21 February 2015).
Benzie, M., Hedlund, J., and Carlsen, H., (2016), “Introducing the Transnational Climate Impacts Index: Indicators of country-level exposure – methodology report”, Working Paper 2016-7, Stockholm Environment Institute, Sweden, June.
Brooks, N., (2003), “Vulnerability, risk and adaptation: a conceptual framework”, Working Paper 38, Tyndall Centre for Climate Change Research, Norwich, UK, November.
Brooks, N., Adger, N., and Kelly, P., (2005), “The determinants of vulnerability and adaptive capacity at the national level and the implications for adaptation”, Global Environmental Change, Vol. 15, pp. 151-163.
Cayabyab, M.J., (2013), “Agriculture: The decline of the poor man's sector”, GMA News, available at: http://www.gmanetwork.com/news/story/306370/money/agriculture-the-decline-of-the-poor-man-s-sector (accessed 29 December 2015).
Comer, P. J., Young, B., Schulz, K., Kittel, G., Unnasch, B., Braun, D., Hammerson, G., Smart, L., Hamilton, H., Auer, S., Smyth, R., and Hak, J., (2012), “Climate Change Vulnerability and
Adaptation Strategies for Natural Communities: Piloting methods in the Mojave and Sonoran deserts”, Report, U.S. Fish and Wildlife Service. NatureServe, Arlington, VA.
Crawford-Brown, D., Syddal, M., Guan, D., Hall, J., Li, J., Jenkins, K., Beaven, R., (2013),
“Vulnerability of London’s Economy to Climate Change: Sensitivity to Production Loss”, Journal of
Environmental Protection, Vol. 4, pp. 548-563.
CTI Engineering International Co., Ltd., in association with Woodfields Consultants, Inc., (2012), Metro
Manila Water Security Study: Final Report, Metropolitan Waterworks and Sewerage System
(MWSS), World Bank and AusAID, available at:
http://www-wds.worldbank.org/external/default/WDSContentServer/WDSP/IB/2014/04/01/000442464_2014040 1114600/Rendered/PDF/863820WP0P1251540Box385165B00PUBLIC0.pdf (accessed 25 July 2016).
Cutter, S.L., Boruff, B.J. and Shirley, W.L., (2003), “Social vulnerability to environmental hazards”,
Social Science Quarterly, Vol. 84, No. 2, pp. 242-261.
Cutter S.L., Barnes, L., Berry, M., Burton, C., Evans, E., Tate, E., Webb, J., (2008), “A place-based model for understanding community resilience to natural disasters”, Global Environmental Change, Vol. 18, pp. 598-606.
Da Silva, J., Kernaghan S., and Luque, A., (2012), “A systems approach to meeting the challenges of urban climate change”, International Journal of Urban Sustainable Development, Vol. 4 No. 2, pp. 125-145.
De Sherbinin, A., Schiller, A., and A. Pulsipher, (2007), “The vulnerability of global cities to climate hazards”, Environment and Urbanization, Vol. 19, pp. 39-64.
Development Assistance Research Associates (DARA), (2012), “Methodological documentation for the climate vulnerablity monitor (2nd edition)”, available at:
http://daraint.org/wp-content/uploads/2012/09/CVM2_Methodology.pdf (accessed 21 February 2015).
Dela Peña, B., (2014a), “Rapid Appraisal of the State of Competition in the Rice Value Chain”, Philippine Institute for Development Studies Discussion Paper Series No. 2014-25, Manila.
Dela Peña, B., (2014b), “Competition in the rice value chain: highlights of a rapid appraisal”, Philippine Institute for Development Studies Policy Note No. 2014-10, Manila.
Dela Peña, B., 2012. The Philippine Rice Situation. Technical Assistance Consultant’s Report. Support for the Association of Southeast Asian Nations Plus Three Integrated Food Security Framework (Financed by the Japan Fund for Poverty Reduction), Project Number: TA 7495-REG, Asian Development Bank (ADB), Pasig City, Metro Manila.
Department of Energy (DOE), (2012), Philippine Energy Plan 2012-2030, Metro Manila, Philippines. Department of Energy (DOE), (2014), 2014 Power Situationer, Department of Energy, Metro Manila,
Philippines.
Fazey, I., Fazey JA., Fisher, J., Sherren, K., Warren, J., Noss, R., and Dovers, S., (2007), “Adaptive capacity and learning to learn as leverage for socio-ecological resilience”, Front Ecol Environ, Vol. 5 No.7, pp. 375–380
Folke, C., Carpenter, S., Elmqvist, T., Gunderson, L., Holling, CS., and Walker, B., (2002), “Resilience and sustainable development: Building adaptive capacity in a world of transformations”, Ambio, Vol. 31 No. 5, pp. 437-440.
Fussel, H.-M., (2009), Review and quantitative analysis of indices of climate change exposure, adaptive
capacity, sensitivity, and impacts, Potsdam Institute for Climate Impact Research, Germany.
Fussel, H.-M and Klein, R. J. T., (2006), “Climate change vulnerability assessments: an evolution of conceptual thinking”, Climatic Change, Vol. 75, pp. 301–329.
Gall, M., (2007), “Indices of Social Vulnerability to Natural Hazards: A Comparative Evaluation”, Ph.D. Dissertation, University of South Carolina, available at:
http://webra.cas.sc.edu/hvri/education/docs/Melanie_Gall_2007.pdf (accessed 21 February 2015) Guzman, M.A.L.G., (2010), “Quantifying the Current and Future Sustainability of Metro Manila,
Philippines”, Ph.D. Dissertation, Syracuse, New York, USA: State University of New York, College of Environmental Science and Forestry.
Guzman, M.A.L.G. and Estiva, J.A.N., (2013). “Managing for Uncertainty: Case Study of the
Metropolitan Waterworks and Sewerage System”, paper presented at Managing Water Resources under Climate Uncertainty: Challenges and Opportunities, 17-18 October 2013, Bangkok, Thailand. Habito, C.F. and Briones, R.M., (2005), “Philippine Agriculture over the Years: Performance, Policies
and Pitfalls”, paper presented at Policies to Strengthen Productivity in the Philippines conference, 27 June 2005, Makati City, available at:
http://siteresources.worldbank.org/INTPHILIPPINES/Resources/Habito-word.pdf (accessed 22 December 2015)
Hahn, M., Riederer, A., and Foster, S., (2009), “The livelihood vulnerability index: A pragmatic approach to assessing risks from climate variability and change - A case study in Mozambique”, Global
Environmental Change, Vol. 19 No. 1, pp. 74-78.
Harmeling, S. and Eckstein, D., (2012), “Global climate risk index 2013”, available at: https://germanwatch.org/en/download/7170.pdf (accessed 17 April 2015).
Hijmans, R.J., Cameron, S.E., Parra, J.L., Jones, P.G. and Jarvis, A., (2005), “Very high resolution interpolated climate surfaces for global land areas”, International Journal of Climatology, Vol. 25, pp. 1965-1978.
Hunt, A., and Watkiss, P., (2011), “Climate change impacts and adaptation in cities: a review of the literature”, Climatic Change, Vol. 104, pp. 13–49.
IPCC, (1997), “The regional impacts of climate change: An assessment of vulnerability”, available at: https://www.ipcc.ch/pdf/special-reports/spm/region-en.pdf (accessed 17 April 2015).
IPCC, (2001), “Climate change 2001: Impacts, adaptation and vulnerability, Summary for Policy makers”, available at: https://www.ipcc.ch/ipccreports/tar/wg2/pdf/wg2TARspm.pdf (accessed 19 February 2016).