WestminsterResearch
http://www.westminster.ac.uk/westminsterresearch
Hierarchical Framework for Automatic Pancreas Segmentation in
MRI Using Continuous Max-flow and Min-Cuts Approach
Asaturyan, H. and Villarini, B.
This is an author's accepted manuscript of a paper published in Campilho A., Karray F.,
ter Haar Romeny B. (eds) Image Analysis and Recognition. ICIAR 2018. Lecture Notes
in Computer Science, vol 10882. Springer, Cham.
The final authenticated publication is available online at:
https://doi.org/10.1007/978-3-319-93000-8_64
The WestminsterResearch online digital archive at the University of Westminster aims to make the research output of the University available to a wider audience. Copyright and Moral Rights remain with the authors and/or copyright owners.
Whilst further distribution of specific materials from within this archive is forbidden, you may freely distribute the URL of WestminsterResearch: ((http://westminsterresearch.wmin.ac.uk/).
Segmentation in MRI Using Continuous
Max-Flow and Min-Cuts Approach
Hykoush Asaturyan and Barbara Villarini University of Westminster, Computer Science Department,
London, United Kingdom
[email protected], [email protected]
Abstract. Accurate, automatic and robust segmentation of the pan-creas in medical image scans remains a challenging but important pre-requisite for computer-aided diagnosis (CADx). This paper presents a tool for automatic pancreas segmentation in magnetic resonance imaging (MRI) scans. Proposed is a framework that employs a hierarchical pool-ing of information as follows: identify major pancreas region and apply contrast enhancement to differentiate between pancreatic and surround-ing tissue; perform 3D segmentation by employsurround-ing continuous max-flow and min-cuts approach, structured forest edge detection, and a training dataset of annotated pancreata; eliminate non-pancreatic contours from resultant segmentation via morphological operations on area, curvature and position between distinct contours. The proposed method is evalu-ated on a dataset of 20 MRI volumes, achieving a mean Dice Similarity coefficient of 75.5±7.0% and a mean Jaccard Index coefficient of 61.2
±9.2%.
Keywords: automatic pancreas segmentation, computer aided diagno-sis (CADx), continuous max-flow and min-cuts, contrast enhancement, MRI, structured forests
1
Introduction
The accurate segmentation and classification of the pancreas plays a key role in computer-aided diagnosis (CADx) systems [7] [18], providing image analysis for disorders such as Type 2 diabetes mellitus [1] and detection of pancreatic neoplasms [13]. Studies have reported variations in the pancreas contour can be linked to ductal adenocarcinoma [3], and enhanced contour analysis can help stratify normal variations against pancreatic tumours [11]. However, the pan-creas has very high structural variability and a full inspection from a scan is problematic due to location and surrounding abdominal fat, and vessels. Dif-fering from CT imaging, the low resolution and slower imaging speed of MRI presents additional edge based artefacts, especially for the pancreas [2].
2 Hierarchical Framework for Automatic Pancreas Segmentation in MRI
In recent research literature, various approaches to pancreas segmentation have relied upon training databases of manually annotated pancreata in MRI and CT volumes. A number of methods have been employed including region growing [16], atlas guided approach and discriminative dictionary learning [17], deformable image registration [14] and patch-based label propagation using rel-ative geodesic distances [19]. Furthermore, most recently, deep learning based networks such as convolutional neural networks (CNNs) have been widely re-ported in pancreas segmentation tasks [2] [13].
The proposed approach performs automatic pancreas segmentation in MRI volumes using a training dataset of annotated image volumes. The identifica-tion of the major pancreas region, coupled with effective contrast enhancement, reveals rich pancreatic features which are extracted using continuous max-flow and min-cuts, and structured forest edge detection.
In Section 2, the methodology for 3D pancreas segmentation and refinement is covered. Section 3 presents and discusses the segmentation results’ outcome with comparison to those reported in recent literature, and strategies for further optimisation. Section 4 provides a conclusion for the proposed framework.
2
Methodology
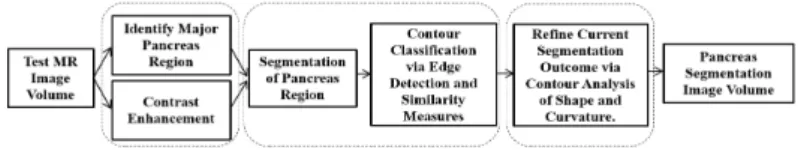
The methodology of the proposed framework, as illustrated in Figure 1, pro-gresses through three main stages, each one of which is discussed below.
Fig. 1.Overview of framework for the automatic segmentation of the pancreas from an MRI volume.
2.1 Analysis of Image Structure and Intensities
An effective application of contrast enhancement in an MRI volume can differen-tiate pancreatic tissue and boundaries against background classes of blood ves-sels, stomach fundus and the first section of the small intestine. In this approach, a sigmoid function is applied to a given test image volume by incorporating a gain,g, which controls the actual contrast, and a cut-off value,c, which repre-sents the (normalised) grey value about which contrast level is changed. Every i-th slice, si, in the image volume undergoes contrast enhancement, C(si), as
C(si) =
1
1 + exp [g(c−si)]
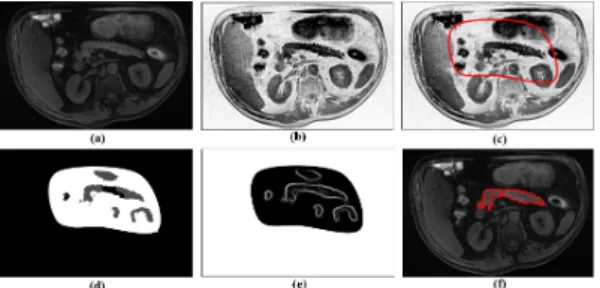
(1) Figure 2(a) and (b) depicts a slice from an image volume before and after contrast enhancement, respectively. By assigning optimum gain values to images in the training dataset, a non-linear regression model is developed to predict the gain from a test image volume. Overall, the value of the gain changes in proportion to the mean of pixel intensities in the image volume. Similarly, a linear regression model is developed for predicting the cut-off value.
Next, the major pancreas region is identified using the method reported in [7]. A random forest is trained on a selection of extracted features in image patches of 25×25 pixels. These features describe texture and the probability of a patch being “pancreas” based on voxel intensity analysis in the training data. Figure 2(c) displays a red outline over a sample slice that embodies the area predicting “pancreas” at a probability of 0.85. This represents the major pancreas region for that particular slice in a test image volume.
2.2 Segmentation of Pancreas Tissue and Surroundings
The image volume is further processed through a 3D segmentation algorithm described in [20], which uses maximal-flow and minimum graph-cuts approach in a continuous domain. AllowΩto serve as a closed and continuous 3D domain representing the major pancreas region volume as a graph. At every position, x ∈ Ω, the spatial flow passing x can be written as q(x). Additionally, the directed source flow from terminal s to x can be denoted by qs(x), and the
directed sink flow from xto terminalt byqt(x). The continuous max-flow and
min-cuts model can be described through the introduction of a multiplier known as the “dual variable”, denoted byµto some flow conservation:
max qs,qt,q min µ Z Ω qsdx+ Z Ω µ(∇ ·q−qs+qt)dx (2)
such thatqs(x)≤Cs(x),qt(x)≤Ct(x) and|q(x)≤|C(x), whereC(x),Cs(x)
andCt(x) describe given capacity functions, and∇ ·q calculates the total
spa-tial flow nearbyx. From here, the “Multiplier-Based Maximal-Flow Algorithm” described in [20] is employed to perform unsupervised image segmentation on the entire image volume within the major pancreas region. Figure 2(d) displays the resulting segmentation of a single slice from a given test image volume.
Edge Detection and Boundary Matching The segmented image volume under-goes a transformation via structured forest learning [4] where the boundaries or edges of pancreatic issue and surroundings are detected. The edges of segments in each slice are measured against the boundaries of equally sized pancreas seg-ments provided in the training dataset. The measure of similarity between these edges are performed via modified Hausdorff distance (MHD) [6] and structural similarity (SSIM) index [5]. Whenever the error between a region in the training
4 Hierarchical Framework for Automatic Pancreas Segmentation in MRI
data and its corresponding region in the segmentation slice falls below 15% for MHD and below 30% for SSIM, a boundary match is assigned to a compilation of pancreas contour similarities, otherwise the segment is disregarded. Figure 2(e) depicts the boundaries of different tissue in a segmented slice after max-flow and min-cuts segmentation. Notice the variation in contour intensity against the background.
Fig. 2.Visualisation of results for a slice from image volume. (a) Original MRI slice, (b) MRI slice after contrast enhancement, (c) Red bounding box depicts major pan-creas region, (d) Segmentation following max-flow and min-cuts approach, (e) Bound-ary detection using structured forest learning, (f) Final contour segmentation after refinement.
2.3 Fine Extraction of Pancreas
Once an image volume of rough segmentation has been extracted, a stage of post-processing eliminates surrounding contours identified as “non-pancreas”. Figure 2(f) displays the final segmentation outcome for a single slice in a test image volume following stages of refinement.
Morphological Operations on Pancreatic Contours Analysing a given set of an-notated training image volumes, the following is deduced: the mean of ranges (where the pancreas is visible throughout successive slices in a volume), with careful consideration to heavy outliners; the mean slice number where the pan-creas features become visible for the first time, sstart, reach maximum area,
smax, and the last slice after which pancreas features are not visible any longer,
send. By considering the total number of slices in each image volume, ts(which
is constant), a discrete set of four slice ranges are established:r1: [1, sstart−1],
r2: [sstart, smax−1],r3: [smax, send−1] andr4: [send, ts] , wherer1,r2,r3 and
r4∈Z. A k-medoids cluster approach is employed in order to generateNr1,Nr2,
Nr3 and Nr4 groups of constraints for every slice range. Every group of
con-straints includes a measure of area, triangularity and ratio of width-to-height. For each slice range, individual contours in the segmentation image volume are simultaneously measured against corresponding groups of constraints; if the er-ror for each observation is larger than 15%, then this contour is regarded as
“non-pancreas” and removed from the overall segmentation result, otherwise it is retained. Let Nri(α), Nri(β) and Nri(γ) represent individual constraints of
area, triangularity and ratio of spatial dimensions. Thus, for every Nri, this
operation can be defined as:
pc = ( 1 if 0≤Eα ri, E β ri, E γ ri ≤0.15 0 otherwise (3)
where pc represents a segmented contour whose value of 1 corresponds to
“pancreas” and a value of 0 corresponds to “non-pancreas”. Eα ri, E
β
ri and E
γ ri
represent the error betweenNri(α),Nri(β) andNri(γ) and an observed
segmen-tation contour’s similar measures, respectively.
Another morphological operation involves computation of mean curvature [9] for each distinct contour in the segmentation. If an observed contour falls below a threshold computed from analysing curvatures of unique contours in the training dataset, then it is discarded.
Position of Contours The slice-by-slice inspection of pancreatic regions in the training dataset reveals that whole or distinct pancreatic contours are embod-ied in a shape resembling a horseshoe, an inverted-V, transverse, sigmoidal [8] but more commonly, oblique or L-shaped [3]. By considering a bounding box, Fs, to contain all the contours in each segmentation slice, it is possible
to generate an L-shaped template that behaves like a “trail-map” for iden-tifying contours deemed as “pancreas” or otherwise. This trail-map can be viewed as a collection of neighbouring paths that begin from a set of points, BXY = {(x1, ymax), ...,(xn, ymax)}, on the bottom horizontal of the bounding
box and rise by corresponding angles, θ = {θ1, ..., θn}, to respective points on
the top horizontal of the bounding box. From here, the trail descends by an-gles, φ={φ1, ..., φn}, to respective terminating points (on the bounding box).
It is noted that BX = {x1, ..., xn} are values that refer to a set of n
dis-tances measured from the bottom right-hand vertex, i.e. (xmax, ymax), hence,
BX ∈R|xmin ≤BX ≤xmax. Values ofθ andφ are co-dependent on the width
and height of the bounding box.
3
Results and Discussion
The proposed approach employs a dataset of T2-weighted (fat-suppressed) ab-dominal MRI scans obtained from 130 volunteers using a Siemens Trio 3T scan-ner. The training and test evaluation dataset is split into 110 and 20 MRI vol-umes respectively. For each image volume, the pancreas has been manually an-notated by an expert-operator using a commercially available image analysis software. Every image volume in the dataset consists of 80 slices with 1.6mm
spacing, with each slice of spatial size 320×260 and 1.1875mm pixel interval in the axial and sagittal direction.
For each experiment, the values described in Section 2.3 and 2.3 are such that the curvature threshold is 0.27 and n= 4, respectively.
6 Hierarchical Framework for Automatic Pancreas Segmentation in MRI
The segmentation program ran via a workstation with i7-59-30k-CPU at 3.50 Ghz, and the mean time for segmentation of one case (MRI volume) is 25 minutes. This run-time can be potentially reduced by a factor of 10 by using a GeForce Titan X GPU.
The performance of the proposed approach is evaluated using the Dice Sim-ilarity Coefficient (DSC) and Jaccard Index (JI) method. Table 1 displays the DSC and JI for the evaluation dataset as mean ± standard deviation [lowest, highest], in comparison to other automatic approaches reported in research lit-erature.
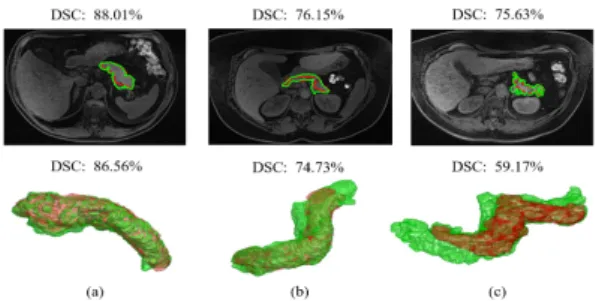
Fig. 3.Segmentation results for three different volunteers. From left, first column dis-plays sample MRI axial slices with segmentation outcome (green) against ground-truth (red), and computed DSC; second column displays 3D reconstruction of entire pancreas (green) segmentation against its ground-truth (red), with computed overall DSC.
However, direct comparison with other methods in literature is difficult due to differences in imaging modalities, the scanner imaging protocols, spatial res-olution and dimensions, as well as the number of image volumes used in the experiments. That said, the approach presented in this paper does report bet-ter quantitative pancreas segmentation results in comparison to other state-of-the-art techniques. Although the accuracy results reported in [2] are relatively higher in comparison, this proposed approach reveals a tighter standard devi-ation. Moreover, employing this method produces detailed contouring of the pancreas for every protrusion and indentation as opposed to an approximate or mean tracing of the organ.
A methodology reported in [15] employs probabilistic atlas-based graph cut and achieves a mean JI coefficient of 77.0±10.2% for 15 CT volumes. Since the technique is interactive based, a medical expert identifies a “seed” (or location) from where the segmentation is performed. The proposed method for this paper is fully automatic and does not require user intervention. Also, the modality of choice is MRI, as opposed to CT, and therefore tackles greater problems relating to image artefacts. Also, the max-flow and min-cuts based approach, described in this paper, employs rich statistical information about wide variations and irregularities in pancreas shape and size.
Table 1. Overall DSC and JI shown as mean±standard deviation [lowest, highest] for automatic segmentation methods
Method DSC(%) JI(%) Data (size)
Wang,Z., et al. [19] 65.5±18.6 [2.4, 90.2] - CT (100) Tong,T., et al. [17] 71.1±14.7 56.90±15.2 CT (150) Holger,R., et al. [13] 71.8±10.7 [25.0, 86.9] - CT (82) Cai,J., et al. [2] 76.1±8.7 [47.4, 87.1] - MRI (78) Okada,T., et al. [10] - 46.60 CT (28) Shimizu,A., et al. [14] - 57.90 CT (20)
Proposed Method 75.5±7.0 [65.0, 86.9] 61.2±9.2 [48.1, 76.9] MRI (20)
Figure?? displays the final pancreas segmentation from four different MRI scans. Similarly, Figure??displays the results in four different CT scans. Notice the variation between image contrast and intensity in the axial slices, particularly in MRI. Although this method produces detailed contouring of the organ, there are also evident differences can appear less-well defined with blurred bound-aries between the organ and surrounding tissue, and therefore affect the overall segmentation accuracy. The main source of segmentation error, currently pre-venting a relatively higher accuracy score, can be attributed to accumulation of surrounding pancreas tissue such as the superior mesenteric vein, the splenic vein, the duodenum and nearby vessels. The potential for optimisation involves removal of surrounding tissue such as splenic arteries prior to max-flow and min-cuts segmentation. Incorporating a deep learning based model for automatically learning to identify pancreatic features can enhance the segmentation outcome [2] [12]. Moreover, the proposed approach can be further developed by improv-ing computation of optimum parameters, such as threshold and contrast level for pancreatic tissue enhancement prior to segmentation.
4
Conclusion
This paper presents a framework for automatic pancreas segmentation in MRI volumes. Although direct comparison with other methods is difficult due to dif-ferences in datasets, the proposed approach performs close to performs better than state-of-the-art techniques.
Acknowledgments. The authors would like to thank the University of West-minster for providing a large medical imaging database that fosters research for health and wellbeing.
References
1. Burute, N., Nisenbaum, R., J. Jenkins, D., Mirrahimi, A., Anthwal, S., Colak, E., Kirpalani, A.: Pancreas volume measurement in patients with type 2 diabetes using magnetic resonance imaging-based planimetry. Pancreatology14, 268–274 (2014)
8 Hierarchical Framework for Automatic Pancreas Segmentation in MRI
2. Cai, J., Lu, L., Zhang, Z., Xing, F., Yang, L., Yin, Q.: Pancreas Segmentation in MRI Using Graph-Based Decision Fusion on Convolutional Neural Networks, pp. 442–450. SPRINT (2016)
3. Cruickshank, A.H., Benbow, E.W.: Pathology of the Pancreas, pp. 10–15. Springer-Verlag London (1995)
4. Doll´ar, P., Zitnick, C.L.: Structured forests for fast edge detection. In: Proceedings of the 2013 IEEE International Conference on Computer Vision, ICCV ’13, pp. 1841–1848. IEEE CS (2013)
5. Dosselmann, R., Yang, X.D.: A comprehensive assessment of the structural simi-larity index. SIViP5(1), 81–91 (2011)
6. Dubuisson, M., Jain, A.: A modified hausdorff distance for object matching. In: Proceedings of the 12th IAPR International Conference, vol. 1, pp. 566–568 (1994) 7. Farag, A., Lu, L., Roth, H.R., Liu, J., Turkbey, E., Summers, R.M.: A bottom-up approach for pancreas segmentation using cascaded superpixels and (deep) image patch labeling. IEEE Transactions on Image Processing26(1), 386–399 (2017) 8. Hagen-Ansert, S.: Textbook of Diagnostic Sonography, pp. 305–308. Mosby (2017) 9. J. Williams, D., Shah, M.: A fast algorithm for active contours and curvature
estimation. CVGIP55, 14–26 (1992)
10. Okada, T., Linguraru, M.G., Yoshida, Y., Hori, M., Summers, R.M., Chen, Y.W., Tomiyama, N., Sato, Y.: Abdominal Multi-Organ Segmentation of CT Images Based on Hierarchical Spatial Modeling of Organ Interrelations, pp. 173–180. Springer Verlag GmbH (2012)
11. Omeri, A.K., Matsumoto, S., Kiyonaga, M., Takaji, R., Yamada, Y., Kosen, K., Mori, H., Miyake, H.: Contour variations of the body and tail of the pancreas: evaluation with mdct. Jpn J Radiol35(6), 310–318 (2017)
12. Ronneberger, O., Fischer, P., Brox, T.: U-Net: Convolutional Networks for Biomed-ical Image Segmentation, pp. 234–241. SPRINT (2015)
13. Roth, H.R., Lu, L., Farag, A., Shin, H.C., Liu, J., Turkbey, E.B., Summers, R.M.: DeepOrgan: Multi-level Deep Convolutional Networks for Automated Pancreas Segmentation, pp. 556–564. SPRINT (2015)
14. Shimizu, A., Kimoto, T., Kobatake, H., Nawano, S., Shinozaki, K.: Automated pancreas segmentation from three-dimensional contrast-enhanced computed to-mography. Int J Comput Assist Radiol Surg5(1), 85–98 (2010)
15. Suzuki, T., Takizawa, H., Kudo, H., Okada, T.: Interactive segmentation of pan-creases from abdominal ct images by use of the graph cut technique with proba-bilistic atlases. BioMed Res. Int45, 575–584 (2016)
16. Tam, T.D., Binh, N.T.: Efficient Pancreas Segmentation in Computed Tomography Based on Region-Growing, pp. 332–340. SPRINT (2015)
17. Tong, T., Wolz, R., Wang, Z., Gao, Q., Misawa, K., Fujiwara, M., Mori, K., Hajnal, J.V., Rueckert, D.: Discriminative dictionary learning for abdominal multi-organ segmentation. Med Image Anal23(1), 92–04 (2015)
18. Villarini, B., Asaturyan, H., Thomas, E., Mould, R., Bell, J.: A framework for morphological feature extraction of organs from MR images for detection and clas-sification of abnormalities. IEEE (2017)
19. Wang, Z., Bhatia, K.K., Glocker, B., Marvao, A., Dawes, T., Misawa, K., Mori, K., Rueckert, D.: Geodesic Patch-Based Segmentation, pp. 666–673. SPRINT (2014) 20. Yuan, J., Bae, E., Tai, X.C.: A study on continuous max-flow and min-cut
ap-proaches. In: Proceedings of the IEEE Computer Society Conference on Computer Vision and Pattern Recognition, pp. 2217–2224 (2010)
![Table 1. Overall DSC and JI shown as mean ± standard deviation [lowest, highest]](https://thumb-us.123doks.com/thumbv2/123dok_us/1299385.2674064/8.892.216.711.217.359/table-overall-dsc-shown-standard-deviation-lowest-highest.webp)