by Michael Sturm, Jan Strasky,
Petra Adolf and Dominik Peschel
Occ asiOnal PaPer series
nO 92 / July 2008
The Gulf cOOPeraTiOn
cOuncil cOunTries
ecOnOmic sTrucTures,
recenT develOPmenTs
and rOle in The GlObal
ecOnOmy
O C C A S I O N A L P A P E R S E R I E S
N O 9 2 / J U L Y 2 0 0 8
by Michael Sturm
1, Jan Strasky
1,
Petra Adolf
2and Dominik Peschel
2THE GULF COOPERATION
COUNCIL COUNTRIES
ECONOMIC STRUCTURES, RECENT
DEVELOPMENTS AND ROLE
IN THE GLOBAL ECONOMY
This paper can be downloaded without charge from http://www.ecb.europa.eu or from the Social Science Research Network electronic librar y at http://ssrn.com/abstract_id= 1144464.
1 European Central Bank 2 Deutsche Bundesbank The authors are grateful for helpful comments by Frank Moss, Thierry Bracke and Adalbert Winkler (ECB), Karlheinz Bischofberger, Andreas
Günnewich and Jens Ulbrich (Deutsche Bundesbank). They also thank Livia Chitu (ECB) for
In 2008 all ECB publications feature a motif taken from the €10 banknote.
© European Central Bank, 2008 Address Kaiserstrasse 29 60311 Frankfurt am Main Germany Postal address Postfach 16 03 19 60066 Frankfurt am Main Germany Telephone +49 69 1344 0 Website http://www.ecb.europa.eu Fax +49 69 1344 6000
All rights reserved. Any reproduction, publication or reprint in the form of a different publication, whether printed or produced electronically, in whole or in part, is permitted only with the explicit written authorisation of the ECB or the author(s).
The views expressed in this paper do not necessarily refl ect those of the European Central Bank.
ISSN 1607-1484 (print) ISSN 1725-6534 (online)
C O N T E N T S ABSTRACT 4
PREFACE 5
EXECUTIVE SUMMARY 6
1 ECONOMIC STRUCTURES AND
DEVELOPMENTS IN THE GCC COUNTRIES 1 0
1.1 Introduction 1 0
1.2 Key structural features of GCC
economies 1 0
1.2.1 Size of countries and
economies 1 0
1.2.2 The role of oil and gas in
the economy 1 2
1.2.3 Economic diversifi cation 1 4
1.2.4 Labour markets 1 7
1.3 Economic developments and
policies 1 9
1.3.1 Growth and employment 1 9
1.3.2 Infl ation, monetary and
exchange rate policies 2 1
1.3.3 Fiscal developments and
policies 2 6
1.3.4 External developments 2 8
1.3.5 Financial sector
developments 3 1
1.4 Conclusions 3 7
2 THE ROLE OF THE GCC COUNTRIES IN THE GLOBAL ECONOMY: OIL REVENUE RECYCLING AND IMPLICATIONS FOR
GLOBAL FINANCIAL STABILITY 3 9
2.1 Introduction 3 9
2.2 Oil revenue recycling 3 9
2.2.1 The extent of oil revenue
recycling 3 9
2.2.2 Recycling petrodollars via the trade and the capital
account channels 4 0
2.2.3 Tracking
petrodollar-related capital fl ows 4 2
2.3 Implications for global fi nancial
stability 4 4
2.3.1 Global imbalances, capital
fl ows and their sustainability 4 4
2.3.2 Global imbalances, policy plans and their feasibility 4 5
2.3.3 Oil exporters as new big players in world fi nancial
markets 5 0
2.4 Conclusions 5 5
3 THE ROLE OF THE GCC COUNTRIES IN THE REGIONAL AND GLOBAL ECONOMY:
ENERGY AND TRADE 5 7
3.1 Introduction 5 7
3.2 GCC countries’ role in world
energy markets 5 7
3.2.1 Trends in world energy
markets 5 7
3.2.2 Oil substitution and gains
in effi ciency 6 0
3.2.3 GCC countries’ potential to accommodate increasing
energy demand 6 2
3.3 Trade and trade policy in the
GCC countries 6 5
3.3.1 Trade patterns 6 5
3.3.2 Institutional aspects 6 7
3.4 Conclusions 6 9
BIBLIOGRAPHY 7 0 EUROPEAN CENTRAL BANK OCCASIONAL
PAPER SERIES SINCE 2007 7 5
LIST OF BOXES:
Box 1 Wage developments in GCC
countries 2 2
Box 2 Islamic fi nance 3 6
Box 3 Impact of a revaluation of
oil-exporting countries’ currencies on domestic prices 4 8
Box 4 Empirical evidence of the effect of petrodollar recycling on asset
prices 5 1
Box 5 Oil qualities, refi nery capacities
and oil prices 6 1
Box 6 GCC countries’ contribution to meeting world gas demand 6 5
ABSTRACT
In the wake of high and rising oil prices since 2003, the member states of the Gulf Cooperation Council (GCC) have seen dynamic economic development, enhancing their role in the global economy as investors and trade partners. Real GDP growth has been buoyant, with non-oil activity expanding faster than oil GDP. Macroeconomic developments have also been characterised by large fi scal and current account surpluses as a result of rising oil revenues, notwithstanding
fi scal expansion and rapid import growth. The most significant macroeconomic challenge faced by GCC countries is rising infl ation in an environment in which the contribution of monetary policy to containing inflationary pressure is constrained by the exchange rate regimes. The overall favourable macroeconomic backdrop of recent years has provided GCC countries with an opportunity to tackle long-standing structural challenges, such as the diversifi cation of oil-centred economies and reform of the labour markets. In a global context, apart from developing into a pole of global economic growth, GCC countries – together with other oil-exporting countries – have become a major net supplier of capital in global markets, second only to East Asia. As a result, they have become part of the international policy debate on global imbalances. Furthermore, GCC countries are home to some of the world’s largest sovereign wealth funds, which raises several fi nancial stability issues. Their role as trade partners has also increased, with the European Union being the only major region in the world maintaining a signifi cant surplus in bilateral trade with the GCC. GCC countries are also key players in global energy markets in terms of production, exports and the availability of spare capacity. Their role is likely to become even more pivotal in the future as they command vast oil and gas reserves and benefi t from relatively low costs in exploiting oil reserves.
Key words: Gulf Cooperation Council, global imbalances, sovereign wealth funds, fi nancial stability, oil markets
PREFACE
The economies of the member states of the Gulf Cooperation Council (GCC) 1 have attracted
increasing attention over recent years. In the wake of high and rising oil prices since 2003, they have developed into a pole of global economic growth. They have also become more important as global investors and trade partners, and play a crucial role in global energy markets. Furthermore, together with other major oil-exporting countries, they have become part of the international policy debate on global imbalances.
Against this background, the European Central Bank (ECB) and the Deutsche Bundesbank organised a Eurosystem high-level seminar with the central banks and monetary agencies of the GCC member states. This seminar took place on 12 March 2008 in Mainz, Germany and should be seen in the light of the Eurosystem’s policy of developing relations with central banks in other regions of the world, most of which also have experience of regional cooperation.
This Occasional Paper presents the analytical background documentation that was prepared for the seminar and served as the basis for discussion. The seminar’s agenda focused on economic structures and developments in the GCC countries and on relevant aspects from a global perspective, in particular, with regard to current issues in money and fi nance, as well as energy and trade. Therefore, this paper is divided into three parts. Part 1 “Economic structures and developments in the GCC countries” reviews key structural issues and economic developments in GCC countries over recent years. Parts 2 and 3 focus on the role of the GCC countries in the global economy. Part 2 “Oil revenue recycling and implications for fi nancial stability” analyses the fi nancial fl ows of GCC countries, their role in the context of global imbalances and special issues related to sovereign wealth funds. Part 3 “Energy and trade” reviews the role of GCC countries in global energy markets and international trade. The information in this paper is based on that available as at February 2008,
given the date of the seminar for which the contributions were prepared.2
Bahrain, Kuwait, Oman, Qatar, Saudi Arabia and the United 1
Arab Emirates (UAE).
In the executive summary, reference is made to some more 2
recent macroeconomic data that has become available in the IMF World Economic Outlook of April 2008 and the IMF Regional Economic Outlook for the Middle East and Central Asia of May 2008.
EXECUTIVE SUMMARY
ECONOMIC STRUCTURES AND DEVELOPMENTS IN THE GCC COUNTRIES
Gulf Cooperation Council (GCC) countries share a number of specifi c structural economic features, while also displaying some signifi cant differences. Key common features are: a high dependency on hydrocarbons as expressed in the share of oil (and gas) revenues in total
fi scal and export revenues and the share of the hydrocarbon sector in GDP; a young and rapidly growing national labour force; and the heavy reliance on expatriate labour in the private sector. These features also pose common structural policy challenges to GCC economies, notably economic diversifi cation to reduce the dependency on the hydrocarbon sector and to develop the private non-oil sector. Both are necessary to create employment opportunities for young nationals, given that the hydrocarbon sector is not labour-intensive and further increasing public sector employment is not sustainable. In order to enhance the employability of nationals, efforts to reduce the educational mismatch between nationals’ qualifi cations and private sector needs are key. GCC member states are moving towards economic diversifi cation at a different pace and in different directions, with Bahrain and the United Arab Emirates (UAE) being most advanced in the process. This is also driven by the fact that hydrocarbon reserves are projected to be depleted in some countries (Bahrain and Oman) relatively soon, while they will last in others for a considerable period of time. Economic diversifi cation needs to be supported by structural reforms, in particular, privatisation and market liberalisation, areas in which most GCC countries have made signifi cant progress over recent years.
Recent macroeconomic developments provide a favourable backdrop for implementing reforms and addressing the structural challenges, in particular, as they have provided GCC economies with the fi nancial means to do so.
In the wake of high oil prices, annual real GDP growth has been buoyant at around 7% on average for the GCC countries as a whole for the past fi ve years, making the region a pole of global economic growth. Non-oil GDP growth has been impressive and has even exceeded oil GDP growth in most countries, even though the dynamics of the non-oil sector remain largely driven by government expenditure, which in turn depends on oil revenues. The nominal GDP of GCC economies has more than doubled since 2001, adding an economy the size of Sweden to the GCC in terms of aggregate output. GCC countries have accumulated large fi scal and current account surpluses in recent years. Budget surpluses are the result of rising public revenues and have masked fi scal expansion. Public expenditure has increased signifi cantly, with a focus on developing the physical and social infrastructure required for private sector development.
Infl ationary pressure has emerged in all GCC countries in response to strong domestic demand accompanied by dynamic monetary and credit growth. Average infl ation in GCC countries increased to above 6% in 2007, with signifi cant differences between GCC member states. The increase in headline CPI infl ation, which may not refl ect the full extent of infl ationary pressure on account of shortcomings in the CPI baskets in some countries, was particularly pronounced in Qatar and the UAE. In these two countries, where, in particular, developments in the real estate sector have fuelled infl ation, anchoring infl ation expectations and avoiding a rent-wage-price spiral appear to be challenges.
The contribution of monetary policy to containing inflationary pressure has been very limited in view of the exchange rate pegs to the US dollar, as interest rates broadly follow US rates in an environment of free capital movements. The policy challenge for central banks in GCC countries to curb infl ation appears to have further increased following the rising cyclical divergence between the GCC and US economies. Most GCC countries have resorted to administrative and prudential measures to curb infl ation.
S U M M A R Y
In view of the prevailing exchange rate regimes,
fi scal policy is the key macroeconomic tool to control infl ation. At the same time, GCC countries face domestic pressures to increase public expenditure in view of expectations to share windfall revenues of recent years with wider parts of the population and development needs in areas such as infrastructure. Governments in GCC countries have also been called upon internationally to raise spending in the context of the debate on global imbalances. Thus, the policy challenge is to balance the fi scal stance between cyclical and intergenerational considerations and the need for spending on physical and social infrastructure, taking account of bottlenecks and the absorptive capacity of the economies.
OIL REVENUE RECYCLING AND IMPLICATIONS FOR GLOBAL FINANCIAL STABILITY
GCC economies have been experiencing substantial revenue increases in the wake of the prolonged and marked hike in oil prices of this decade. There are indications that about half of the GCC region’s oil revenues are currently absorbed through the trade channel, with the imports to exports ratio having picked up in comparison to the 1970s. The other half of GCC countries’ petrodollar infl ows are invested in
fi nancial assets, resulting in a sizeable build-up of traditional foreign exchange reserves and, increasingly, stabilisation and savings funds, which are also referred to as sovereign wealth funds (SWFs). As only about half of these fi nancial resources can be tracked with the help of international statistics, a large part of investment activities by the GCC countries remains opaque to international fi nancial market participants. Based on the available evidence, however, two tentative conclusions can be drawn. First, diversifi cation in asset classes, countries and currencies seems to play an important role for GCC economies. Second, the United States has nonetheless continued to be a main recipient of oil-related fi nancial funds. In view of the remarkable increase in its combined current account surplus during the recent episode of rising oil prices, approaching
USD 200 billion per annum in recent years, the GCC region has emerged as a major net supplier of capital on a global scale, second only to East Asian countries. As a result, GCC economies form part of the international community’s four-pronged approach, aimed at avoiding a sudden and disorderly unwinding of global imbalances. However, the related policy plans, above all the acceleration of domestic absorption, will probably have only a limited effect on global imbalances. Given the structure of the GCC region’s external trade, the absorption channel is much more likely to benefi t the European Union and Asia than the country with the world’s largest current account defi cit, namely the United States. Enhancing exchange rate
fl exibility, a recommendation usually made with reference to China rather than the GCC region, might also support the adjustment process to a limited extent only, even though a gradual nominal appreciation of the GCC countries’ currencies against the US dollar might be in their own interest given the region’s domestic macroeconomic conditions. In particular, it could contribute to dissolving infl ationary pressures resulting from domestic absorption of high and rising oil revenues.
As a consequence of the sheer size of fi nancial petrodollar recycling, oil-exporting countries in general and GCC countries in particular have emerged as new big players in world
fi nancial markets. As such, they are alleged to exert some infl uence on asset prices, especially on US long-term interest rates, emerging market yields and the US dollar exchange rate. However, empirical studies fail to identify a signifi cant impact for oil revenue investments, in part owing to data constraints, but also because the relatively broad diversifi cation of investment portfolios reduces the infl uence on individual asset markets. Moreover, the strength of the impact is likely to vary with the size of the respective market. On a more general scale, the effects of petrodollar recycling on global fi nancial stability may be summarised as positive, mainly because the longer-term orientation and the presumed reluctance of GCC countries to engage excessively in
highly-leveraged positions contribute to diversifying the global investor base and its asset allocation. However, in adverse situations, the overall size of oil-related fl ows, as well as the very limited knowledge market participants have about petrodollar investments, may give rise to market rumours and, possibly, fi nancial instability.
In recent years, SWFs from both oil-exporting and other countries have proliferated and have increased in scale and diversity of activity. The GCC is home to some of the world’s largest SWFs, and the entire GCC region is estimated to have assets in the range of USD 1-1½ trillion under sovereign management. Not least because of their opacity, SWFs have raised fears of politically or strategically motivated investments, which – although hypothetical at the current juncture – might ultimately fuel protectionism. Instead, however, the proliferation of SWFs should be viewed in the context of a general trend towards deeper
fi nancial globalisation. In this respect, it is essential that the international community abstain from measures that unduly restrict the free movement of capital on a global basis – all the more so as empirical evidence and country experience suggest that concentrating state-backed investment within an oil fund might prove to be benefi cial for the domestic economy, provided that promoting fi scal discipline is one of the fund’s dominant characteristics. On the other hand, in the light of the very limited knowledge market participants have about SWFs, a certain wariness regarding their activities is likely to persist. Thus, enhancing transparency in respect of the management and operation of these funds, along the lines of the work done, for example by the International Monetary Fund (IMF), would be welcome.
ENERGY AND TRADE
GCC countries are major players in global oil markets in terms of current production and the availability of spare capacity. As they hold about 40% of global oil reserves, they are likely to remain pivotal in providing the world
economy with oil in the future. To this end, they are raising investment spending on oil exploration and the development of new oil
fi elds, as they benefi t from comparatively low costs in exploiting oil reserves, notwithstanding the lower quality of GCC countries’ crude oil. In addition, GCC countries are active in mitigating oil refi nery capacity bottlenecks.
Global oil demand is being driven mainly by growth in emerging market economies, including oil producers and thus GCC countries themselves. Moreover, in Europe, as well as in the United States, the depletion of reserves will increase oil import dependency, despite stagnating oil consumption in the case of Europe. This will raise the importance of external providers, including GCC oil producing countries, in meeting domestic demand. Other sources of energy, including substitutes for crude oil, such as oil sand, synthetic oil and biofuels, as well as progress in raising energy effi ciency may dampen global demand for crude oil, in particular, in an environment of elevated oil prices. However, without major technological breakthroughs in energy production and/or energy savings, crude oil and oil derivatives will continue to play the dominant role in meeting rising global energy demand in the foreseeable future. As for natural gas, its production is projected to increase both globally and in the GCC region, but it is expected that large parts of the GCC gas production will be used to meet rising domestic energy needs.
Trade by GCC countries has risen substantially in recent years, driven by higher oil prices, with exports and imports differing substantially in terms of the structure of goods traded and the geographical pattern of trade. While the bulk of GCC countries’ exports consist of oil and oil derivatives, their imports are dominated by machinery and mechanical appliances, vehicles and parts, electrical machinery and equipment. The EU is the main trading partner of the GCC countries, as most of their imports originate in Europe. By contrast, exports by GCC countries – mainly consisting of oil and oil derivatives – are
S U M M A R Y
strongly oriented towards Japan and emerging Asia, while Europe’s oil imports originate mainly from oil producing countries in the Commonwealth of Independent States and North Africa and only to a smaller degree (24% in 2006) from the Middle East, including GCC countries. As a result, the EU is the only major region in the world to have a trade surplus with the GCC countries as a group.
GCC countries have made substantial investments to establish themselves as a regional trade hub. While the physical infrastructure has been upgraded, further progress is needed in the area of trade facilitation. In terms of institutional trade links and integration, all GCC countries have now become members of the World Trade Organisation (WTO). Moreover, Free Trade Agreements (FTAs) are currently being negotiated with several countries and regions, including with the EU, which might further contribute to the GCC countries’ integration into the world economy. At the same time, intra-GCC trade is still limited, but is expected to expand with further progress in diversifying GCC economies and regional integration.
1 ECONOMIC STRUCTURES AND
DEVELOPMENTS IN THE GCC COUNTRIES3
1.1 INTRODUCTION
Part 1 reviews key structural features of the economies of the six member states of the Gulf Cooperation Council (GCC) and macroeconomic developments over recent years. In doing so, it identifi es a number of policy issues faced by decision-makers in GCC countries.
Notwithstanding some differences between GCC countries with regard to hydrocarbon (oil and gas) dependence and economic diversifi cation, GCC member states together with some neighbouring countries represent the most hydrocarbon-centred economic region in the world. In the wake of high oil prices, GCC countries over recent years have experienced favourable macroeconomic developments. Real GDP growth has been buoyant, with non-oil GDP growing even faster than oil GDP. Dynamic economic development has led to infl ationary pressure, although this differs between GCC member states, and may not be fully refl ected in CPI fi gures. In view of the long-standing exchange rate pegs to the US dollar, there is little room for monetary policy to counteract infl ationary pressure. Under these exchange rate regimes, fi scal policy plays a particularly important role in ensuring macroeconomic stability. GCC countries have accumulated large current account and fi scal surpluses, and the use of higher oil revenues overall appears to have been prudent.
The generally favourable macroeconomic backdrop of recent years offers an opportunity for GCC countries to tackle some structural issues specifi c to many highly oil-dependent countries in general and the GCC economies in particular. These include the diversifi cation of the oil-centred economies and the development of the private non-oil sector. Both are key for absorbing the young and rapidly growing national labour force into the economy, against
the background of a continued high reliance on expatriate labour in GCC economies.
Part 1 of this paper takes stock of the developments and policy issues described above. It is structured as follows: Section 1.2 highlights key structural features of GCC economies; Section 1.3 reviews economic developments and policies; and Section 1.4 concludes.4
1.2 KEY STRUCTURAL FEATURES OF GCC ECONOMIES
1.2.1 SIZE OF COUNTRIES AND ECONOMIES
GCC member states differ signifi cantly in terms of population and aggregate output, while differences in terms of GDP per capita are somewhat less pronounced. In terms of population and nominal GDP, Saudi Arabia is by far the largest of the six countries, comprising about 24 million inhabitants (about two thirds of the GCC’s total population) and accounting for around half of the total GDP of GCC countries. The other five countries are considerably smaller. The second largest country both in terms of population and nominal GDP is the UAE, with fi ve million inhabitants and a share of around a quarter of the total GDP of GCC countries (Chart 1).
GDP per capita (in purchasing power parity terms) is highest in Qatar and the UAE at USD 36,600 and 34,100, respectively, and lowest in Saudi Arabia (USD 16,500) and Oman (USD 18,500). Average GDP per capita in GCC countries stands at USD 19,800 and thus at 63% of the euro area average, with Qatar’s and the UAE’s per capita income exceeding the euro area average (Chart 2). The dispersion of GDP per capita is somewhat lower than within the euro area: Saudi Arabia’s income per capita is around 45% of Qatar’s, while Portugal’s GDP
By Michael Sturm and Jan Strasky (ECB). 3
The macroeconomic analysis in Part 1 is mainly based on IMF 4
S T R U C T U R E S A N D D E V E L O P M E N T S I N T H E G C C C O U N T R I E S
per capita (the lowest in the euro area in 2006) is equivalent to 28% of Luxemburg’s (the highest in the euro area).
The high oil prices of recent years have signifi cantly increased GCC member states’ nominal GDP and GDP per capita. In 2001, the combined GDP of the six GCC countries was USD 332 billion and thus comparable to that of Australia. In 2006, the nominal GDP reached USD 712 billion, which is comparable to that
of Canada. This increase of more than 100% or USD 380 billion in absolute terms implies that, within fi ve years, an economy the size of Sweden was added to the GCC in terms of aggregate output. Saudi Arabia and the UAE accounted for the bulk of this increase with USD 166 billion and USD 95 billion, respectively, over these fi ve years in absolute terms (Chart 3).
In GCC countries, like in other oil-exporting countries, it is useful to look at increases in nominal GDP in addition to real GDP growth in order to gauge the underlying economic dynamics, given that higher oil prices are refl ected in nominal GDP growth fi gures, while only higher oil production increases real GDP. However, nominal GDP increases resulting from higher oil prices – assuming that they are not short-lived – represent “real” income, and are not just an expression of infl ationary price increases. In particular, nominal oil revenue is the basis for government expenditure, which is a key driver of economic activity in GCC countries (see sub-section 1.3.1 for a more detailed account of economic growth in the GCC).
Between 2001 and 2006, GDP per capita for the GCC as a whole increased by 30%, with Bahrain and Qatar experiencing the strongest increases at 42% and 37%, respectively (in PPP terms). At the same time, population growth in the GCC was signifi cant at 3% on average per annum between 2001 and 2006. This Chart 1 Population and GDP of GCC
countries
Population in million (Total: 35.2 million)
UAE 5.0 Saudi Arabia 23.7 Qatar 0.8 Oman 2.6 Kuwait 3.1 Bahrain 0.7
Gross domestic product in USD billion (Total: USD 712.4 billion) Bahrain 15.4 Kuwait 95.9 Oman 36.0 Qatar 52.7 Saudi Arabia 349.1 UAE 163.3
Sources: IMF, ECB staff calculations. Note: Data are for 2006.
Chart 2 GDP per capita in GCC countries
(USD thousands) 40 35 30 25 20 15 10 5 0 40 35 30 25 20 15 10 5 0 Bahrain Kuwait Oman Qatar Saudi
Arabia UAE GDP per capita (USD, PPP)
euro area average GCC average
Source: IMF. Note: Data are for 2006.
population growth refl ects both high birthrates and the infl ow of expatriate labour in the wake of the recent economic boom. Labour infl ows were particularly pronounced in the UAE, the population of which has grown at 6% per annum since 2001 and in Qatar and Kuwait at around 5.6% per annum. By comparison, in 2006 the population of the EU27 grew by 0.4%, of which 0.3% was accounted for by net migration fl ows and only 0.1% by natural growth.
1.2.2 THE ROLE OF OIL AND GAS IN THE ECONOMY
Saudi Arabia is – alongside Russia – the world’s largest oil producer, with an average production of 8.75 million barrels per day (mb/d) in 2007,5
and by far the largest net oil exporter. Kuwait and the UAE are also among the top ten world net oil exporters.6 Saudi Arabia holds more than
one fi fth of global oil reserves and accounts for more than half of all oil reserves in GCC countries. Although possessing relatively little oil, Qatar commands the third largest natural gas reserves worldwide after Russia and Iran and has in recent years rapidly increased gas production. Oil and gas resources in Bahrain and Oman are considerably lower.
Expressed in per capita terms, the differences between GCC countries with regard to both oil and gas production and reserves are pronounced (Chart 4). Qatar stands out as the country with
by far the highest reserves and production, refl ecting its large gas reserves in combination with a relatively small population (800,000, of which less than 20% are nationals 7), while the
UAE and Kuwait also have relatively high production levels (and thus revenue) and hold large reserves per capita. Saudi Arabia’s production and reserves per capita are smaller
International Energy Agency (IEA) data, which may slightly 5
differ from BP data used in Part 3, but this does not affect the ranking of countries in terms of their importance.
See also ECB (2007b) on key structural features and economic 6
developments in oil-exporting countries.
See Table 3 in sub-section 1.2.4 for the share of expatriates/ 7
nationals in the workforce and population of GCC countries. Per capita production and reserves are even higher if only nationals – who ultimately are the “owners” of reserves – are taken into account, in particular, in countries where the share of nationals in the total population is low, for example in Qatar and the UAE.
Chart 3 Nominal GDP: 2001 versus 2006
(USD billions) UAE Saudi Arabia Qatar Oman Kuwait Bahrain 0 50 100 150 200 250 300 350 400 2001 2006 Source: IMF.
Chart 4 GCC countries’ oil and gas production and reserves per capita in 2006
Per capita oil and gas production (barrels of oil equivalent)
0 100 200 300 400 500 600 700 800 900 0 100 200 300 400 500 600 700 800 900 UAE gas production oil production
Bahrain Kuwait Oman Qatar Saudi Arabia
Per capita oil and gas reserves (thousand barrels of oil equivalent)
0 20 40 60 80 100 120 140 160 180 200 0 20 40 60 80 100 120 140 160 180 200 220 220 gas reserves oil reserves UAE Bahrain Kuwait Oman Qatar Saudi
Arabia
Sources: BP Statistical Review of World Energy 2007, IMF and ECB staff calculations.
S T R U C T U R E S A N D D E V E L O P M E N T S I N T H E G C C C O U N T R I E S
despite the large numbers in absolute terms, reflecting the country’s larger population. Finally, resources are relatively tight in Bahrain and Oman, where at current production levels,
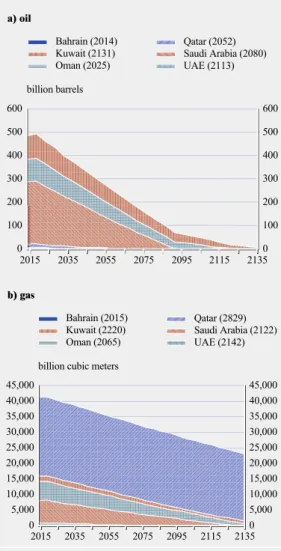
oil will run out within the next two decades. By contrast, oil reserves are projected to last more than 100 years in Kuwait and the UAE. With 14% of global gas reserves, Qatar’s reserves will last for several centuries at current production levels, while Kuwait, the UAE, and Saudi Arabia may also still produce gas in the 22nd century (Chart 5).8
The flip side of the GCC countries’ rich endowment with natural resources and their important role in global energy supply is that their economies are hydrocarbon-dependent (mainly on oil). The oil dependency of GCC countries is refl ected in the share of oil (and gas) revenues in total government revenues, the share of oil (and gas) exports in total exports and the share of the oil and gas sector in GDP. On average, oil revenues account for around 80% of government revenue and for around 70% of export revenue in the GCC, while the oil share in GDP stands at almost 50% (Table 1). The hydrocarbon dependency appears to be highest in Kuwait and Saudi Arabia, and lower in the UAE and Bahrain, pointing to more diversifi ed economies in the latter two countries (see next sub-section). The large contribution of oil to GCC countries’ government revenues, exports and GDP implies that oil price developments have been key determinants for the development of budget and current account balances and for nominal GDP over the past decades.
The oil sector is almost completely nationalised in most GCC countries with regard to upstream
Given that depletion projections depend on various factors that 8
are diffi cult to predict, such as the future state of technology and prices, they should be regarded as highly tentative.
Chart 5 Projected depletion rates of GCC countries’ oil and gas reserves
a) oil 0 200 300 400 500 600 0 100 100 200 300 400 500 600 Bahrain (2014) Oman (2025) Qatar (2052) Saudi Arabia (2080) UAE (2113) Kuwait (2131) billion barrels 2015 2035 2055 2075 2095 2115 2135 b) gas
billion cubic meters 45,000 40,000 35,000 30,000 25,000 20,000 15,000 10,000 5,000 0 45,000 40,000 35,000 30,000 25,000 20,000 15,000 10,000 5,000 0 Bahrain (2015) Oman (2065) Qatar (2829) Saudi Arabia (2122) UAE (2142) Kuwait (2220) 2015 2035 2055 2075 2095 2115 2135 Source: BP Statistical Review of World Energy 2007.
Table 1 The role of oil in GCC countries’ government revenues, exports and GDP
(percentage of total government revenues, exports and GDP)
Bahrain Kuwait Oman Qatar Saudi Arabia UAE GCC
Government revenues 76.1 77.6 86.1 69.5 89.1 76.1 79.1
Exports 64.9 86.7 79.1 73.2 87.0 44.4 72.6
GDP 26.0 59.8 49.4 61.9 54.1 37.3 48.1
Sources: IMF, ECB staff calculations.
Notes: Unweighted averages. Data are for 2006. Government revenues for Bahrain, Kuwait and Oman are projections and for Qatar are based on 2005 data.
activities (crude oil production), while there is more private foreign involvement in downstream activities (such as refi ning). The gross share of the government or national oil company in crude oil production in 2006 was estimated at 100% in Qatar, 97% in Saudi Arabia, 90% in Kuwait and 54% in the UAE.9
1.2.3 ECONOMIC DIVERSIFICATION
The GCC countries’ strong orientation towards oil and gas implies that the diversifi cation of their economies is a key challenge.10 On the one hand, oil
production has promoted economic development and raised living standards enormously in past decades, and GCC countries went from being essentially subsistence economies in the 1960s to wealthy countries as far back as 1980. At the same time, the strong reliance on oil has proven to be a liability. For example, when oil prices fell during the early to mid-1980s, income per capita declined considerably and in the following years stagnated – also owing to high population growth – until the oil price increase starting at the beginning of this decade again led to higher growth rates.
The need for diversifi cation is most pressing in those countries which face a depletion of oil reserves soon, which is the case for Bahrain and Oman (see previous sub-section). However, the need for diversifi cation is not only linked to the level of oil reserves. High population growth, a large number of young labour market entrants and rising unemployment among young nationals also call for diversifi cation efforts in all countries of the region.11 This is because the
oil and gas industry offers only limited employment opportunities given that it is very capital intensive. The traditional tool employed by Gulf countries to absorb young nationals into the labour market – employing them in the public sector – has proven to have its limits and is not sustainable. Thus, the development of the private non-oil sector is crucial for easing labour market pressure (see also next sub-section on labour markets and 1.3.1) and for reducing the exposure of economic development to volatile international oil markets.
There are significant differences between GCC countries with regard to both the degree of diversification achieved so far and the direction of diversifi cation in terms of sectors. Overall, Bahrain and the UAE appear to be most advanced in terms of reducing their dependency on oil. Chart 6 depicts the state of diversifi cation in the four most likely areas for generating income in the GCC countries, namely commodities, manufacturing, fi nance and tourism.
These diversifi cation results reveal the following differences between individual countries: • Bahrain has established itself as a fi nancial
hub for the Gulf region and for the Arab world, particularly in Islamic banking. Tourism, in particular, of regional origin, transport and related services are other areas in which the country is well established. Bahrain is also home to a signifi cant producer of aluminium.
• The UAE has similarly diversifi ed into tourism, with a more international focus than Bahrain; into fi nance, for example with the Dubai International Financial Center (DIFC); and into transport, serving as a regional trading hub. This makes it the only other country apart from Bahrain with a relatively low level of oil dependency.
Data from the OPEC Annual Statistical Bulletin 2006. No data 9
are available for Bahrain and Oman, as they are not members of OPEC, but in these countries state companies also dominate crude oil production. The relatively low fi gure for the UAE is explained by the minority-shareholdings of international oil companies in state-dominated UAE companies. If all oil production by state-dominated companies (government or national oil company share >50%) were accounted for as public sector, the share of the government and national oil companies would be above 90%.
See, for example, Fasano and Iqbal (2003) and Malaeb (2006) on 10
economic diversifi cation in the GCC.
Almost one third of the overall population of GCC member 11
states is below the age of 15. Given the large share of expatriates in the total population of around 35 million, who often do not bring their families to GCC countries, the share of those under the age of 15 among nationals is considerably higher. This is particularly the case in Saudi Arabia and Oman, where the share of expatriates in the overall population is lower compared with the other GCC countries (Table 3).
S T R U C T U R E S A N D D E V E L O P M E N T S I N T H E G C C C O U N T R I E S
• Kuwait remains highly dependent on commodities, while fi nance has developed recently.
• Oman, despite having diversifi ed into manufacturing to a certain extent and started developing infrastructure for tourism, is one Chart 6 Diversification across GCC member states
GCC average Bahrain Kuwait Commodities Manufacturing Finance Tourism Commodities Manufacturing Finance Tourism Oman Qatar Commodities Manufacturing Finance Tourism Commodities Manufacturing Finance Tourism
Saudi Arabia United Arab Emirates
Commodities Manufacturing Finance Tourism Commodities Manufacturing Finance Tourism
Sources: ECB staff calculations on the basis of data from the AMF, the IMF, the World Tourism Organization, CIA World Factbook and national authorities.
Notes: The graph gives shares of the maximum of all six countries. The blue line refers to the GCC average. “Tourism” refers to tourist arrivals per capita of national population; “Commodities” refers to income from oil and gas per GDP; “Finance” refers to stock market capitalisation plus bank loans per GDP; “Manufacturing” refers to the share of manufacturing in GDP.
of the countries where the need for structural change away from production of oil and gas is most pressing.
• Saudi Arabia, which is not focused completely on commodities, but generates around 10% of GDP in the manufacturing sector, is quite active in the construction sector and indeed aims to develop as the region’s backbone in manufacturing. Saudi Arabia also wants to further develop fi nance, e.g. with the planned establishment of the King Abdullah Financial District.
• Qatar is most focused on hydrocarbon exploration, in particular, by developing large capacities for the extraction of natural gas. A switch from oil to gas as the main source of export revenues would not completely solve the problems related to the Gulf countries’ role as primary commodity exporters. However, this move would still reduce the effects of price volatility, as natural gas prices tend to be less volatile than spot prices on the oil market. Qatar has also advanced in tourism, in particular, as a host of conferences, fairs and events.
Key preconditions for economic diversifi cation are ensuring a favourable investment climate, open markets with transparent business practices and stable regulatory frameworks, which together make investment in non-oil sectors more
attractive. Furthermore, an enhanced role of the private sector in those services which so far have been mainly provided by governments, such as water, electricity and health care would be conducive to diversifi cation, implying that GCC countries’ diversifi cation is intrinsically linked to privatisation. Indeed, GCC member states have passed privatisation laws and made progress on privatisation in recent years, for example, in the telecommunications sector. Finally, enhancing the employability of nationals, whose skills and qualifi cations often do not meet the requirements of private sector companies, is a key ingredient for more diversifi ed economies in the region (see also sub-section 1.2.4).
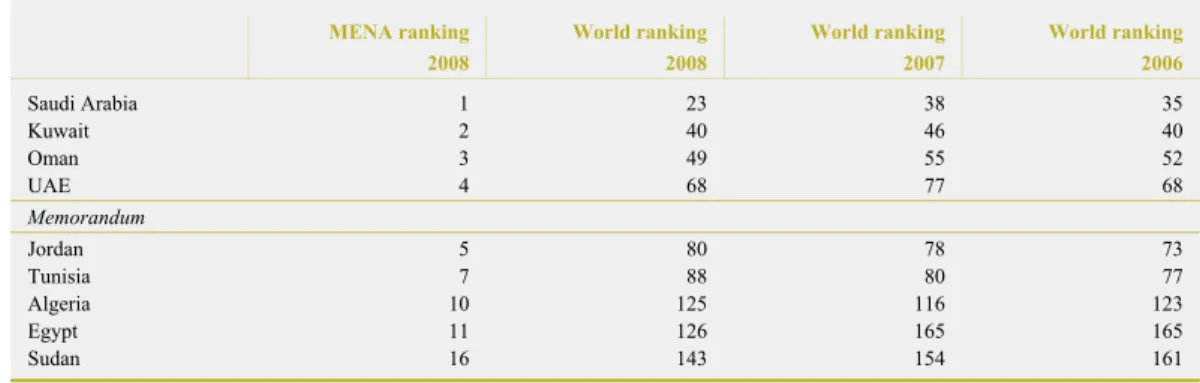
In terms of business environment, the World Bank Doing Business indicators rank GCC countries at the top of Middle Eastern and North African countries, with Saudi Arabia in particular having improved its ranking over recent years (Table 2). In terms of governance, World Bank governance indicators also show that GCC countries do considerably better than their peers in the Mediterranean region and in other emerging markets in the broad neighbourhood of the EU, but lag behind the OECD countries (Chart 7).
However, the potential limits to diversifi cation also need to be acknowledged. In terms of manufacturing, the comparative advantage of Gulf countries, notably of countries like Saudi
Table 2 Rankings on ease of doing business
MENA ranking World ranking World ranking World ranking 2008 2008 2007 2006 Saudi Arabia 1 23 38 35 Kuwait 2 40 46 40 Oman 3 49 55 52 UAE 4 68 77 68 Memorandum Jordan 5 80 78 73 Tunisia 7 88 80 77 Algeria 10 125 116 123 Egypt 11 126 165 165 Sudan 16 143 154 161
Sources: MEES, “Doing Business 2008: How to Reform”, World Bank and IFC, September 2007. Note: No ranking for Bahrain and Qatar.
S T R U C T U R E S A N D D E V E L O P M E N T S I N T H E G C C C O U N T R I E S
Arabia and Kuwait, ultimately lies in the hydrocarbon sector. Attracting energy intensive industries (e.g. aluminium production, which already plays a signifi cant role in Bahrain and the UAE) and developing petro-chemical industries and downstream activities are therefore potentially promising options. For instance, investments in refi nery capacity could benefi t countries in the region and at the same time help stabilise global oil markets.12 While GCC
countries have signifi cantly increased refi nery capacities over the last decade (UAE +148%, Saudi Arabia +24%, Kuwait +10%, compared with a global average of +13%), their share of global capacity nevertheless stands at only 4.1% (2006).13 By investing in refi nery capacity, as
actually planned (e.g. Saudi Arabia intends to approximately double its refi nery capacity of 2.1 mb/d over the next years and Kuwait is also planning a signifi cant expansion), countries in the
region could move from being crude oil exporters to exporters of refi ned products, thereby helping to overcome capacity shortage at the global level and becoming exporters of products with higher value-added. Nevertheless, the contribution of these industries to job creation may be limited in view of their capital intensity.
Another question related to current diversifi cation efforts concerns fi nance, namely how many regional fi nancial centres the GCC can sustain. While Bahrain has developed as a successful fi nancial hub for the region since the 1970s and Dubai has advanced in this regard, other countries in the GCC are also vying to establish themselves as fi nancial centres, e.g. Qatar and Saudi Arabia. It remains to be seen whether these fi nancial centres will develop in a complementary way, i.e. each of them focusing on specifi c fi nancial activities and exploiting comparative advantages, or whether agglomeration effects will prevail and result in a concentration with one leading centre.
1.2.4 LABOUR MARKETS
GCC economies rely heavily on expatriate labour, with expatriates also representing a large share of the total population (Table 3). Labour markets are fragmented between nationals and expatriates. Typically, nationals of GCC countries provide the bulk of the labour force employed in the public sector, which tends to exhibit many rigidities, while expatriates are employed mainly in the private sector, which is highly fl exible. Expatriate employment is found in the whole spectrum of professional skills,
Constraints on refi nery capacity, in particular, for heavy crude oil 12
from the Gulf region, have constituted one of the factors driving up prices for light crude oil in recent years.
Data from BP (2007). 13
Chart 7 Governance indicators
-1.0 -0.5 0.0 0.5 1.0 1.5 2.0 2.5 -1.0 -0.5 0.0 0.5 1.0 1.5 2.0 2.5 1996 1998 2000 2002 2004 2005 2006 South-East Europe
Commonwealth of Independent States GCC
Mediterranean Africa OECD
Sources: World Bank, ECB staff calculations.
Notes: Arithmetic average of six sub-indicators. Unweighted regional averages. The six governance indicators are measured in units ranging from -2.5 to 2.5, with higher values corresponding to better governance outcomes.
Table 3 Expatriates in the GCC countries’ population and workforce
Share of expatriates as a
percentage Bahrain Kuwait Oman Qatar Saudi Arabia UAE GCC
Total workforce 59 81 33 89 47 90 56
Total population 34 53 19 83 21 80 31
ranging from high skill jobs – often fi lled by staff from Western countries – to low skill jobs which are fi lled, in particular, by workers from Asia and non-GCC Arab countries. Thus, GCC countries have access to labour at internationally competitive prices and the large share of expatriate workers implies a signifi cant overall
fl exibility of labour markets, as the number of workers can be fl exibly adjusted in response to economic developments. The mobility of foreign employees between companies and sectors is impeded, however, by the sponsorship system for expatriate labour.14
The high reliance on expatriate labour is mainly the result of the educational mismatch of the local population, which has prevented GCC nationals from working in most industries that require higher education, especially technical skills, and reluctance of nationals of GCC countries to accept lower paid jobs that require less professional skills.15 Indeed, GCC countries
are peculiar with regard to labour migration insofar as a high share of the young adult population in a receiving country has been identifi ed as a factor having a negative effect on immigration.16 This does not seem to be the case
in the GCC countries owing to the educational mismatch of young nationals.
Thus, improving education and vocational training for nationals is a key challenge and
indeed fi gures high on the agenda in GCC member states.17 While the level of education
has been raised considerably over recent years, educational standards in the GCC countries lag behind the average for middle and high income countries (Chart 8). The sub-index for education compares unfavourably with the overall Human Development Index (HDI) for the GCC. It is lowest in Oman and the UAE, and lags behind the overall HDI, in particular, in the UAE. Improving education and professional skills is key to creating employment opportunities for a young and rapidly growing population. These efforts are complemented by a policy of regulation, which aims at the “nationalisation” of the labour force in GCC countries. For example, quotas for nationals and stricter work permit requirements for the employment of expatriates have increasingly been imposed in the private sector.18 In this context, it will be a
In most GCC countries, expatriate workers need a sponsor 14
(employer) to receive a work permit. Under the sponsorship system, workers are not allowed to change jobs without receiving the permission of the sponsor. If this permission is not granted, workers face the alternative of staying with the sponsor, leaving the country or working illegally. Bahrain liberalised the sponsorship system in 2006 and in other GCC countries a relaxation of the system has been implemented or is under discussion.
The educational mismatch is exemplifi ed by Saudi Arabia, where 15
around 70% of university students have graduated in humanities or Islamic studies.
See Hatton and Williamson (2002). They identify four main 16
economic and demographic factors generating migration: (i) the gap in income per capita; (ii) economic development (some development leads to increased emigration, as poverty constraints are relaxed); (iii) young adult population (a: large share in receiving country discourages immigration; b: large share in sending country encourages emigration); and (iv) the social network (the stock of previous migrants from the sending country in the receiving country drives further migration). Labour migration to GCC countries appears to be broadly in line with these factors except for (iii, a), and to some extent (i), as the region also attracts qualifi ed expatriates from high-income countries. For example, the 2007 budget of Saudi Arabia included 17
provisions for the establishment of 2,000 new schools and four new universities. Another example is the establishment of the Al Maktoum foundation announced in May 2007 by the Emir of Dubai and Prime Minister of the UAE Mohammed bin Rashid Al Maktoum. This fund endowed with USD 10 billion aims at improving education levels in GCC and other Arab countries. This contrasts with the prevailing trend of migration policy 18
in EU Member States, see European Commission (2007). In recent years, EU Member States have moved towards tightening conditions for entry via family reunification and asylum programmes (which dominate migration fl ows to the EU so far), while at the same time further opening up to economic-based migration, targeting workers in scarce supply at the local level, against the background of ageing populations.
Chart 8 Human development index and education sub-index
0.5 0.6 0.7 0.8 0.9 1.0 0.5 0.6 0.7 0.8 0.9 1.0 1 Norway 2 "High income" 3 OECD 4 Libya 5 GCC 6 Venezuela 7 "Middle income" 8 World 9 Arab states 10 "Low income" human development index
education sub-index
1 2 3 4 5 6 7 8 9 10
Source: UNDP 2007/2008 Human Development Report. Note: Data are for 2005.
S T R U C T U R E S A N D D E V E L O P M E N T S I N T H E G C C C O U N T R I E S
policy challenge to ensure that this process of “nationalisation” of the labour force in the private sector is not accompanied by a reduction in the fl exibility that currently prevails in GCC labour markets, given that national employees may enjoy greater bargaining power than the expatriates, which could give rise to institutional arrangements entailing a higher degree of wage rigidity and job protection. Furthermore, nationalisation policies need to be implemented
fl exibly to avoid bottlenecks, in particular, in sectors requiring highly skilled labour, and so mitigate infl ationary pressure resulting from labour shortages.19
1.3 ECONOMIC DEVELOPMENTS AND POLICIES 1.3.1 GROWTH AND EMPLOYMENT
GCC countries have experienced strong real GDP growth since 2003 in the wake of high oil prices (Chart 9). For the GCC as a whole, real GDP increased by 6.8% per annum on average over the last fi ve years.20 Growth since 2003 was
highest (per annum on average) in Qatar (11.6%), the UAE (9.4%), and Kuwait (9.1%) and more moderate in Oman (5%), Saudi Arabia (5.5%) and Bahrain (7%). For 2008 growth rates are projected to converge in a range from 4% to 7%, with the exception of Qatar, where growth is expected to remain particularly buoyant. Nominal GDP growth, which – as pointed out in sub-section 1.2.1 – may be a useful additional indicator to gauge underlying economic developments in highly oil-centred economies, increased at almost 18% per annum on average since 2003.
Export growth was the main driver of real GDP growth in 2003, peaking at over 11% in GCC countries on average following the rise in oil prices. Domestic demand, in particular, private consumption and fi xed capital formation have picked up strongly since 2004. Real private consumption increased at rates between 7.5% and 11% in each year since 2004. Real fi xed capital formation grew on average at 16.7% per annum in GCC countries as a whole over the last fi ve years, with annual fi gures being highly volatile, refl ecting the fact that strong
investment activity is driven by large public investment projects (see below). Strong investment activity is also refl ected in the share of gross fi xed capital formation in GDP, which increased from 20% in 2002 to 30% in 2007 on average for GCC countries. Real fi xed capital formation over the last fi ve years increased the strongest in Kuwait at almost 29% per annum, followed by Oman at 23.4% per annum, which points to strong investment in the latter country to foster diversifi cation in view of the dwindling hydrocarbon resources.
Government expenditure has been the key transmission mechanism for higher oil and gas revenues to translate into both higher investment and consumption (see also sub-section 1.3.3 on fi scal developments), with the exception of the UAE, where private sector investment plays a more signifi cant role than in other GCC countries. In particular, GCC governments have embarked on large investment projects to upgrade both physical and social infrastructure.
An example of such fl exible implementation in the face of 19
bottlenecks is Saudi Arabia’s decision in 2007 to reduce the obligatory quota for Saudi employees in the healthcare and construction sectors.
The 2007 fi gure included in the average is a projection from the 20
IMF WEO of October 2007.
Chart 9 Real GDP growth
(annual percentage changes)
25 20 15 10 5 0 -5 25 20 15 10 5 0 -5 2001 2002 2003 2004 2005 2006 2007* 2008* GCC UAE Qatar Oman Saudi Arabia Kuwait Bahrain
Source: IMF (* projections).
The increase in private consumption – apart from being bolstered by confi dence inspired by high oil prices – is also infl uenced by government spending, e.g. via the increase in public sector wages, which is one way to respond to political and social pressures to share increased oil wealth with the broader (national) population (see also Box 1 on wage developments).
GCC countries’ investment spending plans for the next fi ve years are worth at least USD 800 billion, i.e. in excess of their current combined GDP of USD 791 billion (estimate for 2007). These include investment in the oil and gas sector, fi nanced mainly by national oil companies; infrastructure, often funded under public-private partnership (PPP) arrangements; and real estate development, fi nanced largely by the private sector. 75% of the USD 800 billion is earmarked for investment in the non-hydrocarbon sector.21
Non-oil real GDP growth in GCC countries has accelerated and exceeded oil real GDP growth since 2003 (Chart 10). Over the past fi ve years, non-oil GDP growth per annum on average was higher in each of the six countries than during the fi ve preceeding years. Moreover, from 2003 non-oil GDP grew faster per annum on average than oil GDP in fi ve of the six countries. The highest non-oil GDP growth was recorded in Qatar and the UAE at 13% and 11% per annum, respectively, while it was lowest in Saudi Arabia at 5.3%, the only country where non-oil growth did not exceed non-oil GDP growth. The highest oil GDP growth occurred in Qatar and Kuwait at 11% and 8% per annum on average, respectively. From 2003, oil GDP contracted in Bahrain by 3.8% per annum on average and in Oman oil GDP stagnated, pointing to these two countries’ declining oil resources.22
While accelerating and high real non-oil GDP growth can be seen as an indication of some progress in diversifi cation (see also sub-section 1.2.3), caution is warranted in terms of drawing too strong conclusions. The high non-oil growth of recent years has been driven to a large extent by government expenditure, which has been
fuelled by buoyant revenues as result of high oil prices. Thus, high non-oil growth has to be seen in the context of high oil prices, and it remains an open question as to whether and to what extent recently observed high levels of non-oil growth could be sustained if oil prices decreased and government expenditure retrenched. Offi cial data on unemployment in GCC countries is scarce. Unemployment among expatriates can be assumed to be negligible as staying in a GCC country is generally linked to having a job. Among nationals, unemployment is a problem in some countries. The respective country fi gures (or estimates thereof) differ signifi cantly.23 In
Bahrain and Oman, unemployment is estimated at 15% and 12-13%, respectively. In Saudi Arabia, unemployment stands at 12%, with the percentage of jobseekers in the age group 20-29 as high as 25%. Unemployment has increased in recent years despite buoyant growth and about one million new jobs created in 2005-2006, as many of the new jobs were fi lled by expatriates (see also 1.2.4). Offi cial fi gures put unemployment in Kuwait at close to 5%, with some estimates pointing to a rate twice as high.
See IMF (2007f). 21
In Bahrain, the decline is also the result of a change in 2004 to 22
the arrangement with regard to the Abu Saafa oil fi eld shared with Saudi Arabia.
The fi gures indicated here are compiled from the IIF country 23
reports for 2007.
Chart 10 Oil and non-oil real GDP growth
(percentages) 14 12 10 8 6 4 2 0 -2 -4 Bahrain Kuwait oil real GDP growth non-oil real GDP growth
Oman Qatar Saudi Arabia UAE 14 12 10 8 6 4 2 0 -2 -4 Source: IMF.
S T R U C T U R E S A N D D E V E L O P M E N T S I N T H E G C C C O U N T R I E S
In the UAE and Qatar, at an estimated 3% and 2%, respectively, joblessness is not considered a problem, even though underemployment (in the public sector) is an issue.
1.3.2 INFLATION, MONETARY AND EXCHANGE RATE POLICIES
Infl ation has increased over recent years in all GCC countries in the wake of higher oil prices, the ensuing buoyant economic growth and rising import prices. This has led to a rise in average infl ation in GCC countries from below 1% in 2002 to over 4% in 2006 and 2007. However, while infl ation remained at relatively moderate levels in most countries owing to the dynamics of the economic expansion, infl ation rates in Qatar and the UAE have risen sharply since 2004 to around 10% (Chart 11).
Common factors driving up infl ation in GCC countries in recent years have been: (i) strong domestic demand accompanied by rapid money and credit growth; (ii) emerging bottlenecks in the economy caused by the economic boom, e.g. in the areas of construction and project management; and (iii) rising food prices and prices for raw materials (e.g. steel, cement), which have been a global phenomenon. Rising import prices as a result of the US dollar pegs of GCC countries have also contributed to the increase in infl ation, given that the US dollar has depreciated in recent years vis-à-vis most major currencies, including the euro and the pound sterling, the valuations of which are important for GCC countries’ import prices as Europe is an important source of imports.
Differences in the infl ation performance of GCC countries are mainly explained by developments in the real estate sector. While the two countries with high infl ation in the GCC – Qatar and the UAE – also have the fastest growing economies in recent years, partly explaining the infl ation differentials, the main driver of price increases has been the boom in the real estate sector. Soaring real estate prices – for which there is plenty of anecdotal evidence, but few systematic and comparable data – have driven up rent prices, which make up for the difference between Qatar
and the UAE and the other four countries in terms of infl ation. For example, the average rent increase between November 2004 and November 2006 was 83% in Doha/Qatar and 60% in Dubai, while the comparable fi gure for Riyadh was 21% and for Kuwait City 24%.24
The surge in Qatar and UAE real estate prices and rents is linked inter alia to: (i) more liberal regulations regarding foreign ownership of real estate (with the most open regulations in the emirate of Dubai, while in most other GCC countries restrictions are pervasive); and (ii) the large infl ow of expatriates. In Qatar, the implementation of many mega-projects within a short time span and on a limited territory has been a particular driver of real estate prices and infl ation. This was also linked to massive construction activity related to the 2006 Asian Games hosted in Qatar, which attracted expatriate labour. The interaction of rent, wage and general price increases, in particular in Qatar and the UAE, appears to have the potential to set the stage for a wage-price spiral, which might make it diffi cult to anchor infl ation expectations (see Box 1 on wage developments).
See GulfTalent (2006a). 24
Chart 11 Inflation in GCC countries
(annual percentage changes)
-2 0 2 4 6 8 12 10 -2 0 2 4 6 8 12 10 Bahrain Kuwait Oman Qatar Saudi Arabia UAE GCC 2001 2002 2003 2004 2005 2006 2007* 2008* Source: IMF (* projections).
Box 1
WAGE DEVELOPMENTS IN GCC COUNTRIES
GCC countries experienced signifi cant and accelerating increases in private sector wages in the past three years.1 Wages increased on
average by 7% in 2005, by 7.9% in 2006 and by 9% in 2007 (see Chart).
Qatar and the UAE have seen the highest wage increases in the private sector over the past three years, while in 2007 Oman also recorded a sharp hike in wages. In these three countries, wage increases recently reached double-digit levels. Pay rises were highest in the construction, banking and hydrocarbon sector (reaching 11.1%, 9.8% and 9.7%, respectively in 2007). This mirrors the bottlenecks that have occurred in these sectors as a result of the buoyant economic activity in recent years as
local companies expand (e.g. in the construction and hydrocarbon sector) or foreign companies enter the market (e.g. in the banking and fi nancial sector, see also sub-section 1.3.5). However, other sectors also experienced signifi cant pay rises.
The following key drivers have been identifi ed for the broad-based wage increases in the private sector:
– Rising infl ation and, in particular, spiralling rents, have driven up the cost of living and forced employers to offer higher wages to retain or attract qualifi ed employees. The sharp rent increases have been the major factor behind the particularly high pay rises in Qatar and the UAE, where employees spend around one-third of their income on rents, while in Saudi Arabia rents account only for 19% of household spending.
– The depreciation of the US dollar has decreased the value of Gulf salaries in foreign currency terms. This has been the case, in particular, for highly qualifi ed expatriate staff. As a result, employers are reported to offer higher wages for employees from those countries whose home currencies have appreciated vis-à-vis the US dollar/Gulf currencies.
– High economic growth in combination with higher wages and increased job opportunities in Asia, in particular, India have made it more diffi cult to attract/retain staff from countries, which are a key source of labour supply in the Gulf. Asian expatriates are reported to have seen the highest pay rises recently.
1 Information in this box is based on Gulf Talent (2005, 2006a,b, 2007), which conducts annual surveys on salaries among 18,000 professionals in the six GCC countries. The surveys cover 12-month periods from August to August, i.e. 2007 means August 2006-August 2007.
Private sector wage increases in GCC countries
(annual percentage changes)
0 2 4 6 8 10 12 0 2 4 6 8 10 12 1 Bahrain 2 Kuwait 3 Oman 4 Qatar 5 Saudi Arabia 6 UAE 7 GCC 1 2 3 4 5 6 7 2005 2006 2007
S T R U C T U R E S A N D D E V E L O P M E N T S I N T H E G C C C O U N T R I E S
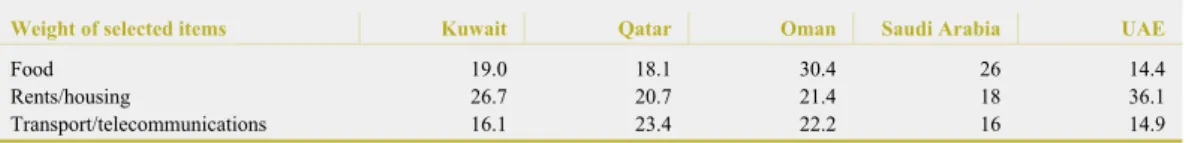
Infl ationary pressure in GCC countries may not be fully refl ected in headline CPI fi gures. This is suggested by widespread administered prices and subsidies in most countries, e.g. for oil, gas, electricity, water and some food items. Furthermore, CPI baskets may not refl ect current consumption patterns (e.g. the weights in the CPI basket of Bahrain have not been updated since 1995) or are confi ned to nationals (e.g. in the UAE), who make up only a small part of the population and benefi t more from subsidies than the large expatriate population.25 Food, rents and
housing-related costs, and transport and telecommunications are the biggest items in GCC countries’ CPI baskets (Table 4). The current pattern of price increases in GCC countries is exemplifi ed by Saudi Arabia. In the
fi rst ten months of 2007, CPI infl ation (cost of living index for all cities) increased to 4.6%. The main drivers of infl ation in this period were rents and housing-related costs (+10.5%), and
foodstuff and beverages (+6.4%). Prices for transport and telecommunication rose by only 0.9%. This probably refl ects the impact of energy subsidies. This was also visible in May 2006, when Saudi Arabia lowered domestic fuel prices to alleviate the impact of the stock market correction on private households, which led to a fall in the headline CPI of 0.2% that month, while the CPI without the transportation and telecommunications component rose by 0.6%. The substantial increases in the stock markets of GCC countries since 2003, which saw a correction in 2006 (see sub-section 1.3.5), as well as evidence of sharply rising real estate prices also point to underlying infl ationary pressures, which may not be refl ected in the CPI
fi gures, but in asset price infl ation.
While offi cial infl ation in the UAE in 2006 stood at 9.3%, private 25
sector estimates (IIF, EIU) point to infl ation rates of 13-15%.
– GCC countries have gradually liberalised the sponsorship system for expatriate employees (see also sub-section 1.2.4), which limited the mobility of staff between sectors and companies and thus was a tool for employers to retain employees. The gradual removal of restrictions made it easier for staff to seek better jobs and higher wages. The recent spike in wages in Oman is partially explained by the liberalisation of the sponsorship system and by the movement of expatriates to GCC countries with higher wage levels such as the UAE and Qatar, forcing Omani employers to raise compensation levels.
– Public sector wages increased signifi cantly in Gulf countries in recent years, as governments were under pressure to distribute part of the windfall oil revenues to citizens and compensate for rising costs of living. For example, a 70% wage increase is budgeted for federal employees in the UAE in 2008, public sector pay rises of 20-30% were announced in the UAE in 2007 and of 15% in Bahrain and Oman. 2006 saw a 20-40% public sector wage increase in Qatar, and in 2005 signifi cant pay rises were recorded in Saudi Arabia and the UAE in addition to lump sum payments in Kuwait and Bahrain. The degree to which such pay rises spill over to the private sector depends on the number of new public sector jobs created and whether the private sector relies on nationals, which is mainly the case in Oman and Bahrain, but less so in the other GCC countries.
Table 4 Major components in GCC countries’ CPI baskets
Weight of selected items Kuwait Qatar Oman Saudi Arabia UAE
Food 19.0 18.1 30.4 26 14.4
Rents/housing 26.7 20.7 21.4 18 36.1
Transport/telecommunications 16.1 23.4 22.2 16 14.9
Sources: National sources.
Notes: The composition of the selected items may vary between countries, e.g. food may comprise beverages and tobacco in some cases. No data available for Bahrain.