A Scalable Architecture for Real-Time Monitoring
of Large Information Systems
Mauro Andreolini, Michele Colajanni, Marcello Pietri
University of Modena and Reggio EmiliaVia Vignolese, 905/b - 41125 Modena, Italy
Email: {mauro.andreolini,michele.colajanni,marcello.pietri}@unimore.it
ABSTRACT
Data centers supporting current cloud-based ser-vices are characterized by a huge number of hard-ware and softhard-ware resources, often cooperating in complex and unpredictable ways. Understanding the state of these systems for management and service level agreement reasons requires novel monitoring architectures because fully centralized systems do not scale to the required number of flows while pure peer-to-peer architectures cannot provide a global view of the system’s internal state. To make matters worse, these services should be provided over short, quasi real-time intervals. We propose a novel moni-toring architecture that, by combining a hierarchical approach with decentralized monitors, addresses the aforementioned challenges. We evaluate its scal-ability by means of an analytical models that is validated through a set of experimental results.
Index Terms—Large Scale; Distributed; Data Center; Monitoring; Cloud; Scalability.
I. INTRODUCTION
Cloud Computing is the most used model to support the processing of large data volumes using clusters of commodity computers. For example, according to [1], already in 2008 Google processed about 20 petabytes of data per day through an average of 100.000 MapReduce jobs spread across approximately 400 machines in September 2007, crunching 11.000 machine years in a single month. This dramatic increase in resource utilization is not unique to Google, but rather to most competitors in the cloud computing arena. As of late 2010, Hadoop [2] clusters at Yahoo span 25000 servers, and store 25 petabytes of application data, with the
largest cluster being 3500 servers [3]. Cloud SQL Server uses Microsoft SQL Azure [4] to deploy an Internet scale relational database service viable to clusters of thousands of nodes.
These large infrastructures are monitored through a multitude of services that extract and store mea-surements about the performance and the utilization of specific hardware and software resources. The resource sampling interval is usually kept constant and described in terms of its frequency. The be-havior of each resource can be described through the tuple (resource name, sampling interval, time series). In this paper, we refer to this tuple with the name resource data stream. For example, Sony uses the closed-source Zyrion Traverse database [5] to claim the monitoring of over 6000 devices and applications over twelve datacenters across Asia, Europe and North America. The virtual data layer within the solution collects half a million resource data streams every five minutes. This scenario opens important challenges in the design of an advanced monitoring infrastructure:
1) it must be able toscale to at least one million
of heterogeneous resource data streams within reasonable real-time constraints which will not be uncommon in the near future;
2) itmust not have any single point of failure to ensure service continuity.
We state that none of the existing solutions fully addresses all these issues. In particular, fully central-ized monitors cannot scale to the desired number of resource data streams. For example, the proto-type system introduced in [6], which uses Ganglia and Syslog-NG to accumulate data into a central
MySQL database, shows severe scalability limits at only 64 monitored nodes, each one collecting 20 metrics every 30 seconds. Here, the main bottleneck is related to the increasing computational overhead occurring at high sampling frequencies. On the other hand, lowering the sampling frequency (commonly, once every five minutes) can make it difficult to spot rapidly changing workloads. Current decentralized, per-data-center, hierarchical monitors such as Gan-glia [7] are limited to computing efficiently averages of measures spanning over several nodes. However, the complexity of current workloads in modern data centers calls for more sophisticated processing, such as the identification of correlations among different resource data streams, or the detection of anomalies in the global system state. Finally, the vast majority of current monitoring infrastructures, including OpenNMS [8], Zabbix [9], Zenoss [10] and Cacti [11] are not designed to be resilient to failures. If, for any reason, any software module fails (due to a bug, insufficient computing resources, human mistake) it must be restarted manually. In a very large system it is surprisingly easy for a system administrator to miss these failures and to keep a monitor running incorrectly (and producing garbage resource data streams) for extended periods of time. To address these challenges, in this paper we propose an architecture for monitoring large-scale network infrastructures hosted in data centers. Each data center is equipped with its own decoupled monitoring infrastructure; each monitor adopts a hi-erarchical scheme to ensure scalability with respect to the number of monitored resources. The internal operations of the monitor are geared towards two objectives: to provide real-time access to single performance samples or graphs, and reduce the expected time for the user to retrieve more sophis-ticated analysis. The latter goal is obtained through a batch-oriented subsystem that will be detailed in the following section. Every single component in the infrastructure is designed to be resilient to failures. In particular, whenever possible, we enrich the existing software modules with redundancy and failover mechanisms. Otherwise, we automatically restart the modules in case of failure.
Due to reasons of space, in this paper we focus only on the local acquisition and analysis subsystem and leave the other discussion to a future paper.
Our preliminary analysis reveals that the per-cluster architecture is able to:
• collect 2946 resource data streams (from 128
probes) on a single monitored node every sec-ond with a resources utilization <10%;
• collect 377088 resource data streams per
sec-ond from 128 different monitored nodes using a single collector node;
• collect and process over three millions resource
data streams per second.
The rest of this paper is organized as follows. Section II describes the design decisions support-ing the aforementioned requirements, provides the architecture of the monitoring infrastructure, moti-vates the choice of the software components and discusses various implementation details. Section III investigates the theoretical scalability limits of the proposed architecture. Section IV evaluates the current state-of-the-art in the area of large-scale system monitoring. Finally, Section V concludes the paper with some remarks.
II. ARCHITECTURE DESIGN
The early decisions that have inspired the design of the proposed architecture share two important goals: to dominate the complexity of the monitoring problem and to avoid single points of failure. The huge problem size makes it literally impossible to deploy any kind of centralized infrastructure. Even worse, service centralization would not be fault-tolerant. For these reasons, each cluster is equipped with an independent monitor infrastructure. In our opinion, this is the only viable alternative to scaling to an arbitrary number of data centers. This strategy is carried out only in the most advanced hierarchical monitoring systems.
In order to scale to millions of data streams per sample interval, it is mandatory to shift preliminary computations (such as the sampling of a resource and performing sanity checks on the sampled data) as close as possible to the edge of the monitored infrastructure. Failure to do so would result in a sys-tem that unnecessarily processes potentially useless data. Ideally, the resource data streams should be initially filtered (or marked as invalid, anomalous) on the monitored nodes. The resulting streams can be sent to a storage system. This approach scales be-cause the checks are, usually, computationally
inex-pensive and the monitored nodes are, usually, much more than those dedicated to the monitoring infras-tructure. Pushing frequent and preliminary checks towards the edge of the monitored infrastructure is currently done by Ganglia and Astrolabe [12]. Since the size of the sampled data is a crucial factor in large monitoring systems that can severely impact the network bandwidth, we also perform live compression of the resource data streams.
Every time new samples are added to the re-source data stream, an extra overhead is paid due to data storage. As previous literature shows, in this scenario characterized by frequent, small, ran-dom database requests [13], write operations to secondary storage do suffer from scalability issues. To reduce this overhead, write operations should be grouped and batched to secondary storage. We believe that the map-reduce paradigm [14] is well suited to this purpose. The adoption of map-reduce also allows to perform sophisticated analysis over the collected resource data streams in a scalable fashion with commodity hardware (or even in a leased platform such as Amazon EC2). On the other hand, the most advanced monitors compute at most moving averages of regular windows of past samples. To the best of our knowledge, this paper represents one first step towards a richer analysis in a quasi real-time scenario.
To avoid single points of failure and to en-sure service continuity, we enforce redundancy of every component of the monitoring architecture. Whenever possible, we deploy our solutions using software that can be easily replicated. In other cases, we wrap the component through custom scripts that detect failures and restart it, in case.
At the lowest level of infrastructure, a set of hard-ware and softhard-ware resources can be associated to subnets, racks, distinct production areas, and logical or physical clusters. Each resource is monitored by a probe process that is responsible for collecting peri-odically performance and/or utilization samples. On each monitored node, a collection agent receives the samples from several probes, performs preliminary validity checks on them, updates the resource data streams and sends them in a coded form (usually, a compression) to a dedicated collector node.
The collector node is the main component of the distributed cluster data filter. It receives the
filtered and coded resource data streams, performs the necessary decompression and stores them for further analysis or a real-time plot. In the latter case, processing stops and the user is able to see immedi-ately the behavior of the resource data stream. In the former case, data is made available to the distributed analyzer system. Its purpose is to compute more sophisticated models on the resource data streams, such as identification of the relevant components in the system, trend analysis, anomaly detection and capacity planning. The goal of these actions is to provide a “reduced view” of the entire cluster by discarding the negligible data streams in terms of system management. At the end of the analysis, the resulting resource data streams are persistently stored and available as (key, value) pairs, where “key” is a unique identifier of a measure and “value” is usually a tuple of values describing it (for exam-ple timestamp, host name, service/process, name of the monitored performance index, actual value).
Fig. 1. Monitored node
We have used exclusively open source tools that can be modified and adapted for our goals. The operating system adopted in the prototype is GNU/Linux (we used Debian, Ubuntu and Fedora in different experimental testbeds), enhanced with the software packages from the Cloudera repository (CDH4). The languages used for the deployment of our modules are Bash (v4.2.36) and C (where efficiency is needed, such as in our modified mon-itor probes). The batch processing framework is Hadoop [2], version 2.0. Our choice is motivated by the dramatic scalability improvement with respect to traditional RDBMS-based data storage
architec-tures under random, write intensive data access patterns [15]. Other frameworks like Traverse [5] and Microsoft SQL Azure [4] are proprietary, or are not adequate to supports long-term network growth [7], [16].
The collection agent. Each monitored node (scheme in Figure 1) is equipped with an indepen-dent collection agent. Its main duty is to ensure that each hardware and software resource of interest is continuously monitored. To this purpose, each resource has associated a probe process that collects a set of indexes (such as response time, throughput and utilization) at constant time intervals. Both parameters (performance indexes and sampling in-terval) are fully configurable by the user. Probing is performed through standard, off-the-shelf mon-itoring tools (vmstat, pidstat, sar); the associated performance indexes include CPU utilization, disk and network bandwidth, number of page faults and memory usage, both per-process and system-wide. We have modified the nethogs code to measure also per-process bandwidth consumption, which was natively not available in batch form. The output of each probe process is piped into a C program (called agent). This module keeps a constant, configurable window of past samples representing the resource data stream and performs preliminary sanity checks on it. These checks are executed through dynamic, pluggable modules that receive in input the data stream and respond with TRUE or FALSE. If at least one check fails, the stream is tagged as invalid, but it is never discarded; this facilitates later de-bugging operations. Currently, the following checks are implemented: missing value, value out of range, sequence of null values. The pre-processed streams are coded (in our prototype, GZIP-compressed) and finally forwarded to the selected monitor node of the distributed cluster data filter. The selection of the monitor node is made by a specific module of the agent (Figure 1, comm.s), which ensure the best monitor choice and the relative availability. This choice is made on the basis of reachability and the workload of the collector nodes. For this purpose, each monitored node knows a subset of all collector nodes in the cluster. Each sample has the following record format:
<index> <timestamp> <value> <monitored host> <tag> .. <tag>
where “index” is the name of the desired per-formance or utilization index, “timestamp” is the sampling instant in UNIX time format, “value” is the sampled value returned from the probe, “moni-tored host” is the symbolic name or the IP address of the host executing the probe, and “tag” is an information cookie of the form “name=value” that enriches the description (there can be multiple tags). Some example records are displayed below:
block.in 1345742145 3 host=webserver12 check=true cpu.user 1345742115 9 host=node67 check=true gproc.net.rxkBs 1345742120 3.21000003814 iface=eth0
host=client45 pid=1130 name=apache2 check=true
Each component (probe, agent) is wrapped by a BASH script that restarts it in case of exit with an error status. After a preconfigured number of restart failures, a warning alert is sent to the administrator of the corresponding service.
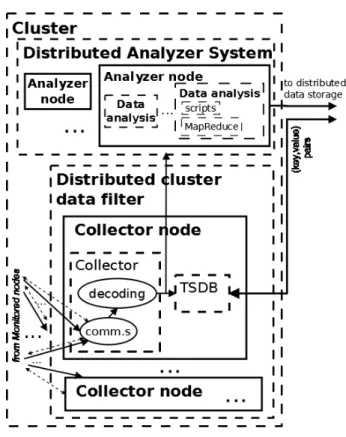
Fig. 2. Cluster collection, filtering and analysis
The distributed cluster data filter.The resource data streams gathered by the collection agent are sent to the Distributed cluster data filter, shown in Figure 2. Here, a collector process receives the compressed and filtered resource data streams. The received streams are decoded and sent to two
different storage: one for real-time plotting of the resource data streams, and one for later, non-real-time processing. If needs be, several collectors can be added to scale the acquisition process to the desired number of resource data streams. The collector is designed to scale up to thousands of streams, provided that the limitations on the maxi-mum number of TCP connections and open files be raised. In GNU/Linux, this can be easily achieved by recompiling the Linux kernel and the GNU C library.
The former storage is handled by
OpenTSDB [17], a software for the storage and configurable plotting of time series. We have chosen OpenTSDB because it is open-source, scalable, and interacts with another open-source distributed database, HBase [18]. It retains time series for a configurable amount of time (defaults to forever), it creates custom graphs on the fly, it allows to plug it into an alerting system such as Nagios [19]. The OpenTSDB’s secret ingredient that helps to increases its reliability, scalability and efficiency is asynchbase. It is a fully asynchronous, non-blocking HBase [18] client, written from the ground up to be thread-safe for server apps. It has far fewer threads and far less lock contention; it uses less memory and provides more throughput especially for write-heavy workloads. The latter storage, called data sync, receives data destined to further processing, performed by the following subsystem. To enhance the performance of the storage engine, we have chosen to pack the resource data streams in larger chunks (64KB by default) and write them asynchronously to a distributed file system that can be scaled to the appropriate size by easily adding backend nodes. The distributed file system we have chosen is the Hadoop Distributed File System (HDFS). It creates multiple replicas of data blocks and distributes them on compute nodes throughout a cluster to enable reliable, extremely scalable computations. It is also designed to run on commodity hardware, is highly fault-tolerant, provides high throughput access to application data and is suitable for applications that have large data sets.
The distributed analyzer system. The dis-tributed analyzer system is composed by a set of analyzer nodes (Figure 2). Each analyzer node runs
arbitrary batch jobs that analyze the resource data streams. Typical analyses include:
1) computing moving averages of resource data streams, in order to provide a more stable representation of an internal resource’s status; 2) correlating several resource state
representa-tions in order to exclude secondary flows; 3) computing prediction trends of resource
rep-resentations on different time scales.
The batch jobs first read the necessary resource data streams (map) from the distributed cluster data filter and runs the appropriate scripts (reduce). The result is a reduced set of (key, value) pairs that is written to the distributed data storage. The goal shared by these operations is to compute a reduced state information that is able to tell whether the service is about to misbehave or not and, in the former case, also to tell which resource is the culprit. The different analyzer functions also produce the status of each node and cluster, and few figures of merit that show the health status of the entire data center (longer term predictions, principal component anal-ysis, capacity planning).
We have chosen the Pig framework for the imple-mentation of the analysis scripts. Pig offers richer data structures over pure map-reduce, for example multivalued and nested dictionaries. Each Pig script is compiled into a series of equivalent map-reduce scripts that process the input data and write the results in a parallel way. We implemented scripts to aggregate data both temporally and spatially (over nodes). Further analysis include anomaly detections, trend analysis and supports for capacity planning on a longer time scale.
The distributed data storage. The reduced streams representing the system state must be writ-ten into a database. The data storage must scale with an increasing number of data streams, must be fault tolerant and should be oriented to time series management. We have chosen Apache HBase [18] as the distributed analysis storage for many reasons, which include the homogeneity and the reuse of components. Apache HBase is a distributed column-oriented database built on top of HDFS, designed from the ground-up to scale linearly just by adding nodes. It is not relational and does not support SQL, but thanks to the proper space management proper-ties, it is able to surpass a traditional RDBMS-based
system by hosting very large and sparsely popu-lated tables on clusters implemented on commodity hardware. In our architecture, the HBase storage is responsible to preserve all the analyzed information about nodes, clusters and datacenter.
III. ANALYSIS
In this section we evaluate the scalability of the proposed architectures in terms of number of monitored resource data streams. In particular, we find out:
• how many resource data streams can be
moni-tored per physical host (intra-node scalability);
• how many physical hosts can be monitored
(inter-node scalability).
We have used two different hardware platforms, Amazon EC2 and Emulab. In the next paragraphs we will only present the results on the Amazon EC2 platform, due to high similarity with Emulab ones. The backing storage is shared across the instances (EBS). The theoretical network connectivity is up to 1Gbps. The virtual machines are running instances of the popular TPC-W benchmark suite (one for client, one for the application server, one for the DBMS). The application server is Tomcat (v6.0), while the DBMS is MySQL (v5.1). In the monitored node, one probe is dedicated to system-related per-formance monitoring (essentially, through the output of the vmstat and sar monitors). The remaining probes are process-related (through the output of the pidstat and nethogs2 monitors). Ths system probe collects 25 difference performance indexes, while each process probe collects 23 different metrics. The sampling interval is configured at t = 1s for each probe.
TABLE I
AVERAGE RESOURCE UTILIZATION OF THE COLLECTION AGENT
Number of Number of CPU Main memory Network probes metrics (%) (%) (%) 1 25 0.3 0.4 0.005 2 48 0.5 0.5 0.009 4 94 1.1 0.6 0.019 8 186 1.8 0.9 0.041 16 370 2.9 1.4 0.085 32 738 4.1 2.6 0.173 64 1474 6.0 4.8 0.352 128 2946 9.8 9.3 0.681 256 5890 23.1 18.3 1.392 A. Intra-node scalability
In this first scenario, we evaluate how many resource data streams (metrics) can be handled on a single monitored node. We use one collector node and one analyzer node running a single script that computes the moving average for every resource data stream. The detail of the resources of the moni-tored node is the following: micro instance, 613 MB memory, Up to 2 EC2 Compute Units (Dual-Core AMD Opteron(tm) Processor 2218 HE, cpu 2600 MHz, cache size 1024 KB), EBS storage, dedicated network bandwidth of 100 Mbps per node.
Table I reports the average resource consumption of the collection agent as a function of the number of resource data streams monitored. From the table we see that the most used resources is the CPU. At 128 probes, the CPU utilization is about the 10%. This threshold is commonly used as the largest fraction of resource utilization that administrators are comfortable devoting to monitoring. Lacking any more principled standard, we have adopted this as our target maximum resource utilization for the monitoring system. Thus, on a single monitored node, it is reasonable to collect 128 probes for a total of 2946 resource data streams per second.
B. Inter-node scalability
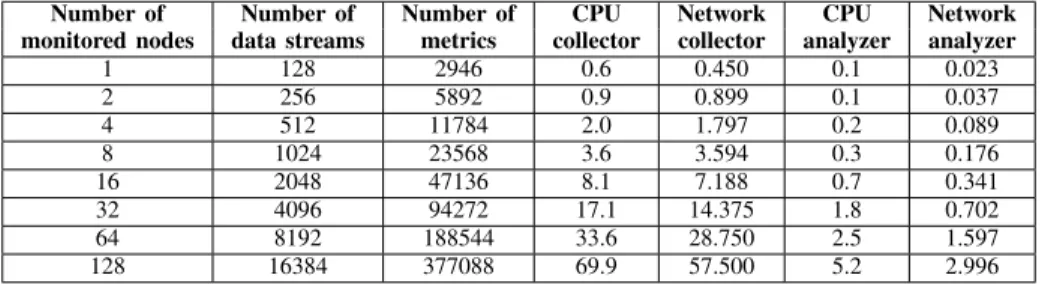
In the next experiment, we add monitored nodes with the same probe setup and measure the resource consumption of the collector and the analyzer node. Table II reports the average resource consumption of the collector and analyzer nodes as a function of the number of the monitored nodes. From the table we see that the most used resource is the CPU of the collector node. We have run experiments up to a maximum of the most used resources is the CPU (mainly due to the decompression effort of multiple heterogeneous packets). At 128 monitored hosts, the CPU of the collector node is saturated. In this sce-nario, the system is monitoring 128∗128 = 16384
resource data streams and 2946 ∗ 128 = 377088
metrics.
We have added collector nodes and incremented the number of monitored hosts to evaluate the scal-ability of the distributed cluster data filter. Table III reports the average resource utilization across the collector nodes.
TABLE II
AVERAGE RESOURCE UTILIZATION OF THE COLLECTOR AND THE ANALYZER NODE
Number of Number of Number of CPU Network CPU Network monitored nodes data streams metrics collector collector analyzer analyzer
1 128 2946 0.6 0.450 0.1 0.023 2 256 5892 0.9 0.899 0.1 0.037 4 512 11784 2.0 1.797 0.2 0.089 8 1024 23568 3.6 3.594 0.3 0.176 16 2048 47136 8.1 7.188 0.7 0.341 32 4096 94272 17.1 14.375 1.8 0.702 64 8192 188544 33.6 28.750 2.5 1.597 128 16384 377088 69.9 57.500 5.2 2.996 TABLE III
AVERAGE RESOURCE UTILIZATION OVER THE DISTRIBUTED CLUSTER DATA FILTER
Number of Number of Number of Number of CPU Network CPU Network monitored data metrics collector collector collector analyzer analyzer nodes streams nodes (AVG) (AVG) (AVG) (AVG)
128 16384 377088 1 69.6 57.539 5.2 2.996
256 32768 754176 2 70.4 57.890 6.2 3.209
512 65536 1508352 4 71.1 58.020 5.5 3.007
1024 131072 3016704 8 70.7 57.970 5.1 2.891
We kept adding collectors up to 1024 monitored nodes. We also had to add more HDFS and HBASE nodes to support the write throughput after 256 nodes. In this scenario, one hour of experiment produces more then 30 GB of data only for the real-time subsystem, monitoring 128∗1024 = 131072
different streams per second (or about 130000 dif-ferent processes). We have also measured the total network bandwidth in about 60 MB/s and we have monitored 2946∗1024 = 3016704 metrics.
IV. RELATEDWORK
The oldest log collection framework is syslog, which supports streaming logs across the network. System activity report is another popular system monitor used on most UNIX-like systems. Hawk-eye [20] is a monitor for grid systems. Nagios [19] and Cacti [11] are a popular alerting and monitoring system respectively, which has inspired, among the others, OpenNMS [8], Zabbix [9], Zenoss [10], GroundWorks [21] and Hyperic [22]. Hyperic is currently collecting and analyzing more then 9000 resources and 11000 metrics per minute at hi5, hun-dreds of servers with different OSs and applications which produce more then 6500 metrics per minute at MOSSO, and more then 37000 resources and 20000 metrics per minute at CONTEGIX. Zabbix claims the monitoring of up-to 100000 monitored
devices and up-to one million of metrics (no time unit is reported), and thousands of checks per sec-ond. It requires a database (MySQL, PostgreSQL, Oracle or SQlite) to store the collected metrics. Zenoss currently manages networks as large as 32,000 devices. These and other centralized prod-ucts alone cannot cope with the challenges presented in this paper. In particular, their scalability is of-ten severely hindered by a RDBMS backend, they cannot be easily balanced, they are not designed to be fault tolerant. In other words, centralized solutions represent a serious scalability bottleneck and introduce single point of failure.
The rise of datacenter-scale distributed systems has made these problems particularly glaring, and in recent years several newer hierarchical systems have been developed, among these Ganglia [7]. Hierar-chical monitors overcome some of the limitations of centralized solutions at the cost of overall system manageability, which now depends on different site specific administrators. Further, the root node in the system may present a single point failure similar to the centralized model.
Astrolabe [12] is a hybrid solution that com-bines a hierarchical scheme with an unstructured P2P routing protocol for distributed communication. While it is highly scalable and resilient, its man-ageability is a complex task since it incurs a lot
of network traffic. Unstructured systems do not put any constraints on placement of data items on peers and how peers maintain their network connections. Resource lookup queries are flooded to the directly connected peers, which in turn flood their neigh-boring peers. Queries have a TTL (Time to Live) field associated with maximum number of hops, and suffer from non-deterministic result, high network communication overload and non-scalability [23].
V. CONCLUSIONS
In this paper, we have proposed a novel archi-tecture for monitoring large-scale network infras-tructures hosted in data centers. These choices are mandatory when you have to support gathering and analysis operations of huge numbers of data streams coming from cloud system monitors. The proposed architecture is already integrated with on-line analyzers working at different temporal scales. Our preliminary experiments show the potential scalability limits of the monitoring system: more than 3M of resource data streams per data center, per second. All these operations of data streams are carried out within real-time constraints in the order of seconds thus demonstrating that huge margins of improvement are feasible.
We are currently studying an hybrid solution (both hierarchical and peer-to-peer) in a WAN em-ulated scenario. Finally, we are studying adaptive random sampling techniques to further reduce the number of performance samples collected at each monitored node.
REFERENCES
[1] Jeffrey Dean, Sanjay Ghemawat, “MapReduce: simplified data processing on large clusters,” Communications of the ACM, vol. 50th anniversary issue: 1958 - 2008s, no. 51, p. issue 1, 01/2008.
[2] “Apache Hadoop,” 2006, – http://hadoop.apache.org/.
[3] K. Shvachko, H. Kuang, S. Radia, and R. Chansler, “The hadoop distributed file system,” Mass Storage Systems and Technologies, IEEE / NASA Goddard Conference on, vol. 0, pp. 1–10, 2010.
[4] “Microsoft sql azure,” 2009, – http://www.microsoft.com/windowsazure/sqlazure/.
[5] “A scalable streaming log aggregator,” 2008, – http://www.zyrion.com/company/whitepapers/Zyrion Traverse. [6] C. E. A. Litvinova and S. L. Scott, “A proactive fault tolerance
framework for high-performance computing,” in Proceedings of the 9th IASTED International Conference on Parallel and Distributed Computing and Networks (PDCN2010), ser. PDCN 2010. Calgary, AB, Canada: ACTA Press, Feb. 16-18 2010. [7] F. D. Sacerdoti, M. J. Katz, M. L. Massie, and D. E. Culler,
“Wide area cluster monitoring with ganglia,”Cluster Comput-ing, IEEE International Conference on, vol. 0, p. 289, 2003. [8] “Opennms, world’s first enterprise grade network management
application platform,” 2002-2012, – http://www.opennms.org. [9] “Zabbix, the enterprise-class monitoring solution for everyone,”
2001-2012, – http://www.zabbix.com.
[10] “Zenoss, transforming it operations,” 2005-2012, – http://www.zenoss.com.
[11] “Cacti, the complete rrdtool-based graphing solution,” 2009-2012, – http://www.cacti.net.
[12] R. Van Renesse, K. P. Birman, and W. Vogels, “Astrolabe: A robust and scalable technology for distributed system moni-toring, management, and data mining,” ACM Transactions on Computer Systems, vol. 21, no. 2, pp. 164–206, May 2003. [13] M. Andreolini, M. Colajanni, and R. Lancellotti, “Assessing
the overhead and scalability of system monitors for large data centers,” inProceedings of the First International Workshop on Cloud Computing Platforms, ser. CloudCP ’11, New York, NY, USA, 2011, pp. 3:1–3:7.
[14] J. Dean and S. Ghemawat, “MapReduce: Simplified data processing on large clusters,” in OSDI, 2004, pp. 137–150. [Online]. Available: http://www.usenix.org/events/osdi04/tech/ dean.html
[15] J.-S. Leu, Y.-S. Yee, and W.-L. Chen, “Comparison of map-reduce and sql on large-scale data processing,” Parallel and Distributed Processing with Applications, International Sym-posium on, vol. 0, pp. 244–248, 2010.
[16] E. Imamagic and D. Dobrenic, “Grid infrastructure monitoring system based on nagios,” in Proceedings of the 2007 workshop on Grid monitoring, ser. GMW ’07. New York, NY, USA: ACM, 2007, pp. 23–28. [Online]. Available: http://doi.acm.org/10.1145/1272680.1272685
[17] “Opentsdb, a distributed, scalable time series database,” 2010-2012, – http://opentsdb.net.
[18] “Apache HBase,” 2007, – http://hbase.apache.org/. [19] “Nagios enterprises,” 2009-2012, – http://www.nagios.org. [20] D. Thain, T. Tannenbaum, and M. Livny, “Distributed
comput-ing in practice: the condor experience.”Concurrency - Practice and Experience, vol. 17, no. 2-4, pp. 323–356, 2005.
[21] “Groundworks, the open platform for it monitoring,” 2012, – http://www.gwos.com.
[22] “Hyperic, open source systems monitoring, server monitoring, and it management software,” 2012, – http://www.hyperic.com. [23] Q. Lv, P. Cao, E. Cohen, K. Li, and S. Shenker, “Search and replication in unstructured peer-to-peer networks,” in Proceed-ings of the 16th international conference on Supercomputing (ICS2002), New York, NY, USA, 2002, pp. 84–95.