No. 2000-20 December 2000
Philippine Institute
for Development Studies
Rosario G. Manasan
*P
olicy
N
otes
PIDS Policy Notes are observations/analyses written by PIDS researchers on certain policy issues. The treatise is holistic in approach and aims to provide useful inputs for decisionmaking.
Basic Education:
Improving Quality
and Quantity
__________
*The author is a Senior Research Fellow at the Philippine Institute
for Development Studies.
T
here is no doubting the value placed oneduca-tion in the Philippines and the central role it plays in Filipino society. Its importance is en-shrined in the Constitution which mandates that the education sector should receive the highest pri-ority in the central government budget.
On the surface, the Philippines has achieved sig-nificant gains in the education sector. Enrolment in the elementary school system expanded by 2.5 percent yearly between 1985-1998 while that in the secondary school
system increased by more than 3 percent annually. Clearly, the growth of enrolment in basic education has outpaced that of population growth, not a small feat considering that the Philippine population growth rate remains to be one of the highest in the region. Consequently, the coun-try posted a participation rate1 of 95 percent at the
el-ementary level and 64 percent at the secondary level in school year (SY) 1997-1998 compared to 85 percent and 55 percent, respectively, in SY 1990-1991 (Figure 1).
The public sector served the bulk of students at both the elementary and secondary levels (92 percent and 72 percent, respectively) while in contrast, the private sec-tor dominated the tertiary level, accounting for 76 per-cent.
However, while access to education has been greatly broadened, the quality of basic education continues to
0 20 40 60 80 100 1990-91 1991-92 1992-93 1993-94 1994-95 1995-96 1996-97 1997-98 Y e a r E lementary S e c o n d a ry
Figure 1. Participation rates in elementary and secondary schools, 1990/91 - 1997/98
be in question. Although the mean percentage scores (MPS) in both the National Elementary Assessment Test (NEAT) and the National Secondary Assessment Test (NSAT) have shown marked improvements, they persist to be low. In fact, they are significantly lower than the passing rate of 70 percent (Figure 2). Moreover, the coun-try ranked very close to the bottom in the Third Interna-tional Mathematics and Science Study given in 1996. At the same time, more than 30 percent of students who start first grade never reach sixth grade and slightly less than 30 percent of those who start first year high school do not make it to fourth year. In sum, more than half of those who start grade 1 do not reach the final year of secondary school.
how much money there is but how it is spent.
In this regard, this Policy Notes issue looks more closely into the matter of education finance and manage-ment, focusing more on the basic education sector.
Management
Intrasectoral prioritization. Prior to 1994, the De-partment of Education, Culture and Sports (DECS) had the sole responsibility for policy formulation, planning, budgeting, program implementation and coordination in all levels of formal and nonformal education in the Philip-pines. It also supervised all education institutions in both the public and the private sectors.
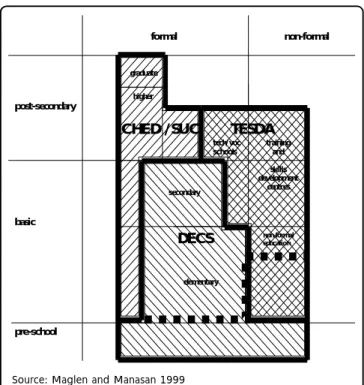
During the Aquino administration, Congress created an Education Committee (EDCOM) which recommended the “trifocalization” of the organizational structure in the education sector. Under this policy which took effect in 1994/1995, oversight for the education sector is now provided by three distinct bodies: the DECS for basic edu-cation; the Technical Education and Skills Development Authority (TESDA) for technical and vocational education and training; and the Commission on Higher Education (CHED) for higher education (Figure 3).
All three agencies are in charge of policy formula-tion, planning, programming, coordinaformula-tion, supervision of public and private education institutions, and standard setting in each of their respective subsectors. While the DECS and the TESDA run their own schools and training centers, the CHED has no direct hand in the operation of any state college or university.
The CHED is attached to the Office of the President and composed of full-time commissioners, all appointed by the President of the Philippines. On the other hand, the TESDA took over the functions and responsibilities of the former National Manpower and Youth Council (NMYC), the DECS’ Bureau of Vocational and Technical Education and the former Office of Apprenticeship under the De-partment of Labor and Employment (DOLE). Organization-ally, the TESDA is attached to the DOLE.
The clamor to improve the quality of basic educa-tion is naturally translated to an ever-increasing pressure on government resources given the fact that the Philip-pine Constitution ordains that basic education should be provided free by the state. The question, then, is how to meet the unrelenting demand for more places in the ba-sic education system (as a result of high population growth) and, at the same time, improve quality within a government budget constraint that is already stretched to the limit. If there were more money to go around, then perhaps the easiest way to simultaneously address the quantity and quality issue in basic education is to assign an even bigger share of the government budget to educa-tion. However, there is indeed a fiscal constraint. Thus, the enduring and more important question is not so much
0 10 20 30 40 50 60 1993-94 1994-95 1995-96 1996-97 1997-98 1998-99 Year Percentage Score NEAT NSAT
Figure 2. Mean percentage score in NEAT and NSAT
On the whole, trifocalization is aimed at improving policymaking, planning and programming at the subsector level as each one of the three lead agencies is given the principal responsibility for its respective areas of con-cern. In particular, the establishment of the CHED and the TESDA has allowed the DECS to concentrate its at-tention on basic education. Despite this development, Figure 3 highlights the fact that the three agencies are still not focused exclusively on the concerns of their re-spective subsectors. For instance, the DECS does not only operate and supervise elementary and secondary schools but also continues to operate some vocational schools even as it is engaged in nonformal education. Meanwhile, state universities and colleges provide a dis-proportionately large percentage of total enrolment at the elementary and secondary levels in their laboratory schools.
Moreover, the gains that have been achieved with the more focused and better-informed management struc-ture at the subsector level have been made at the
ex-pense of intersectoral and intrasectoral coordination. In this regard, it has been noted that the formulation and coordination of policy at the overall sectoral level (as opposed to the subsector level) and the prioritization of the different subsectors in the allocation of resources have deteriorated since the implementation of the trifocalization policy (ADB and World Bank 1999). Poor prioritization of competing demands in the education sector is perhaps best illustrated in the proliferation in the number of state universities and colleges and the increasing budget share of higher education in the 1990s despite the general agreement that basic education should receive the highest priority.
Thus, better coordination amongst the three agen-cies, with perhaps DECS taking the lead role, is called for in order to address functional overlaps and avoid du-plication and/or inconsistency of policies, plans, and pro-grams. However, another agency should be given the prin-cipal role in setting budgetary priorities for the entire edu-cation sector. Perhaps the National Economic and Devel-opment Authority (NEDA) could take on this role. For one, the NEDA, being at the helm of the development plan-ning function, is knowledgeable about the workings of the education sector and its linkages with the rest of the other sectors. At the same time, not being an integral part of the education sector itself, it can effectively serve as the arbiter in the prioritization of the competing needs of the different subsectors. Lastly, being a member of the Development Budget Coordinating Committee (DBCC), which decides on sectoral budget ceilings, it is in a posi-tion to strategically secure the funding support needed by the education sector as a whole.
Management structure at the DECS. In principle, the authority structure at the DECS is hierarchical and highly centralized. All central office bureaus and major field offices (i.e., the regional offices) report directly to the Secretary of Education (CHEG 2000a). The line of authority extends from the DECS central office through the 16 regional offices, to 134 division offices, 2,150 district offices, some 36,000 public elementary schools and almost 4,000 public secondary schools.
formal non-formal post-secondary basic pre-school pre-school centres lab schools lab schools graduate higher CHED / SUC secondary elementary DECS TESDA tech/ voc schools training and skills development centres non-formal education
Figure 3. Trifocalization of education sector management and budgeting
“All authority in the department emanates from the Secretary of Education. The Secretary has authority over technical, financial, physical, personnel, tactical and stra-tegic matters affecting public education delivery. He man-dates technical standards on curriculum, organization of classes, textbooks, building designs, teachers’ items and others. He appoints personnel. He directs instructions on any operational matters” (DAP 1997).
In practice, many of these functions are delegated to the Regional Directors and, more recently, to the Divi-sion Superintendents. While deciDivi-sions on matters related to learning/teaching standards emanate from the DECS central office, most of the decisions on personnel mat-ters are made at the regional and division offices. More specifically, the determination of the total number of days in the school year, the language of instruction for spe-cific subjects, and the maximum class size are made by the DECS central office (CHEG 2000b). On the other hand, the choice of a textbook for each subject is largely a decision of the DECS regional offices with consultations from the division offices and, in some cases, the schools are consulted. Bidding, meanwhile, is managed by the central office but the regional office pays the suppliers. In contrast, the appointment and promotion of teachers/ principals, redeployment of teachers, and disciplining of erring teachers/employees are the responsibility of re-gional and division offices.
Budgeting in the basic education sector (DECS).
Although regional offices of the DECS prepare budget proposals yearly with inputs from the division offices, these are generally trimmed down at the central office. Because of this, there is a tendency for regional offices to inflate their budgetary requests (DAP 1997). There-upon, the DECS budget that is finally proposed by the central office to the Department of Budget and Manage-ment (DBM) is many times removed from the proposals of the regional offices and division offices.
On the whole, the allocation of maintenance and operating expenditures (MOOE) to the various DECS re-gional offices and the individual division offices under
each one follows a simple capitation rule. That is, the DECS central office distributes the MOOE budget to the different operating units in direct proportion to student enrolments. Since all division offices, regardless of size, are mandated to have a uniform organizational and staff-ing structure, said fundstaff-ing formula is said to work against school divisions with small enrolment since these divi-sion offices have to contend with less discretionary re-sources (CHEG 2000c). This will be discussed in more detail in a later section showing the resource allocation for the input mix. Suffice it to say at this instance that for certain school divisions, per student MOOE has been re-duced to half its initial value in real terms between 1993 and 1997.
"Although regional offices of the DECS
prepare budget proposals yearly with inputs
from the division offices, these are generally
trimmed down at the central office ... The
DECS budget that is finally proposed by the
central office to the DBM is many times
removed from the proposals of the regional
offices and division offices."
Moreover, the deconcentration that was started in the 1980s has hardly reached the level of the division and district, much less the level of the school, particu-larly with respect to budget execution. Up to 1999, the DBM did not release funds appropriated in the name of the division offices (and the autonomous high schools) under the General Appropriations Act (GAA) directly to these units. Instead, the DBM regional offices released the corresponding allotment advice and cash allocation for the division offices and autonomous high schools to the DECS regional offices which then in turn released sub-allotments and funding checks to the said operating units.
Consequently, a number of Division Superintendents had claimed that the budgets of the division offices,
par-ticularly those portions referring to nonpersonnel expen-diture items, were not known to them prior to the actual release of the sub-allotments and funding checks. The division offices did not also maintain separate books of accounts and instead simply operated on a cash advance basis relative to the regional offices. Alternatively, they receive resources “in kind.” In instances when cash re-sources are transferred, meanwhile, the sub-allotments and funding checks come with specific instructions re-garding the use of the funds that are available. As such, there is very little room for autonomous decisionmaking at the level of the division.
Starting fiscal year 2000, the DECS, together with the DBM, has started a system whereby funds are re-leased directly to the division offices and the autono-mous high schools. However, only those units that have one accountant/bookkeeper and one disbursing officer are deemed eligible to take advantage of this arrange-ment.
Even with the direct release system now being pi-loted at the division level, resource allocation decision at the level of the school will continue to be seriously limited. This is so because the allotments for the district offices and the elementary schools, particularly with re-spect to nonpersonnel cost, remain under the control of the division offices. The CHEG (2000a) report noted that in most divisions, the district offices and the elementary schools receive supplies and materials “in kind” even as the division offices pay for the utility bills of the elemen-tary schools and the travel expenses of district supervi-sors.
It has been argued that the direct release system which will “bring money lower in the organization” has the advantage of being supportive of the school-based management initiative (CHEG 2000a). In terms of gov-ernment cash management, it offers the added advan-tage of reducing the cash float, i.e., the amount of cash which sits unused in the bank account of government agencies. However, the direct release system requires the presence of adequate and competent financial
per-sonnel at the level of the division and schools, and the strengthening of the management information system of the DECS regional offices and central office to enable them to carry out their monitoring and evaluation func-tions effectively.
In summary, the schools which are at the frontline of the public education system exercise very limited au-tonomy. This is in sharp contrast to the current world-wide shift towards the school-based management frame-work where schools are given the primary responsibility in deciding how schools should use scarce resources and how students are taught. At present, initiatives to introduce this more decentralized framework have been started and therefore need to be supported. Under these initiatives, decisionmaking will be brought closer to the school and community.
Specifically, the division will be assigned budget preparation, procurement of instructional materials, in-service training and project management and implemen-tation. Over time, more responsibilities will be transferred to district offices and, eventually, schools. To prepare the school principals for their more active role, they will be provided with in-service training on school improve-ment planning and manageimprove-ment. It is anticipated that school principals will be involved in a more substantive manner in the hiring of teachers, the selection and pur-chase of instructional materials, and determination of school size and enrolment. They will also prepare their budgets and receive direct releases from DBM regional
"...The schools which are at the frontline of
the public education system exercise very
limited autonomy. This is in sharp contrast
to the current worldwide shift towards the
school-based management framework
where schools are given the primary
responsibility in deciding how schools
should use scarce resources and how
students are taught."
offices.2 They are also groomed to provide instructional
leadership in schools. Lastly, a School Improvement and Innovation Facility will be established so as to encourage schools and teachers to introduce instruction-related in-novations.
Composition of government spending on
education: elementary level versus secondary
and tertiary levels
Efficiency issue. Between 1986 and 1997, public expenditure on education expanded in areas where the private sector seemed to be thriving, thus effectively un-dermining the private sector’s share in the education market (ADB and World Bank 1999). In particular, the share of the secondary level in total general government spending in education expanded. The same is true in the case of the tertiary level but to a more limited extent (Figure 4).
The expansion of the public sector at the second-ary level accompanied the nationalization of barangay
high schools and the Constitutional mandate for free secondary education. There is some evidence that pub-lic schools are now “crowding out” private schools as the number of students enroled in private secondar y schools actually decreased in absolute terms between 1992 and 1998.
For the budget allocation to the tertiary level, mean-while, its share in total general government spending stayed fairly constant in the 20 percent range during most of the 1990s despite the fiscal adjustment measures imposed during said period.3 This came about with the
surge in the creation of state universities and colleges (SUCs) during this period. The incentive structure that drives the unabated increase in the number of SUCs stems from: (1) the political goodwill that a legislator gen-erates by sponsoring the establishment of a SUC; and (2) the higher salary and status that the staff of a sec-ondary/vocational school derives with its conversion into a SUC.
These developments are inconsistent with what is generally perceived to be the appropriate role of govern-ment in the education sector, i.e., greater involvegovern-ment in basic education since larger positive externalities are as-sociated with elementary level.
Cost effectiveness: private versus public provision.
The public sector consistently underperforms the private sector in terms of student achievement scores, specifi-cally in the NEAT and NSAT. However, in the remarkable improvements exhibited by both sectors in recent years, the rate of improvement in public schools has been greater than that in private schools.
Low quality elementary and secondary education in the public sector is accompanied by high operating unit costs. Table 1 indicates that public schools at both the elementary and secondary levels do not compare favorably with their private counterparts in terms of both internal efficiency indicators (as measured by the cohort survival rate, repetition rate, drop-out rate, and comple-tion rate) and quality of educacomple-tion (as measured by
__________
2The legal and organizational requirements for implementing these
proposals are the subject of the ADB TA No. 3115-PHI on Decentraliza-tion of Basic EducaDecentraliza-tion Management. Said TA is also tasked to recom-mend the phasing in over time of the various proposals.
3However, the share of tertiary education in general government
edu-cation finance declined somewhat starting in 1997. 0 10 20 30 40 50 60 70 80 1986 1994 1997 1998 Year Percentage Share
Elementary Secondary Tertiary
Figure 4. General government spending on education by level (percentage share)
achievement scores). The relative cost-effectiveness of private elementary and secondar y education became more evident in 1997 when the private-public operating unit cost ratios declined to levels that were about 30 percent lower than the private-public ratio of mean per-centage scores (MPS) in the NEAT/NSAT. Note that the private-public ratios of the internal efficiency indicators for both elementary and secondary schools exceed that of the operating unit costs by a significantly larger pro-portion.
Given this finding, the need to shift the emphasis at the secondary level away from the further expansion of public education provision towards greater financial support for private education (in locations where feasible) becomes apparent. In line with this, a means-tested sub-sidy program aimed at improving the access of poor
stu-and World Bank 1999). Moreover, the ESC subsidy cov-ers only 68 percent of the average tuition in private schools. This amount appears to be too low to bring the cost of secondary education within the reach of the poor. In addition, on the part of private schools, delays in the processing of claims and the release of payments dis-courage them from participating in this scheme.
Equity issue. The contraction of the share of the elementary level in total general government expenditure and the concomitant rise in the share of the secondary and tertiary levels is likely to benefit the rich more than the poor. This is so because the participation rate of children from poor households in secondary and tertiary education is lower than that of children from better-off households. That is, while there is a small difference in the participation rates across income groups for grade 1 (97.3 percent of children from the poorest third of house-holds and 99.7 percent of children from the richest third), the gap in the participation rate in sixth grade widens (75 percent for children from the poorest third and 95 percent of children from the richest third of households). By third year high school, the participation rate for chil-dren from the poorest third of households drops to 33 percent compared to 75 percent for children coming from the richest third (Filmer and Pritchett 1998).
Input mix: personnel versus nonpersonnel inputs
Allocation of public monies is likewise inefficient in still another area. This refers to the lopsided distribution dents to secondary education will be necessary. The
Edu-cation Service Contracting Scheme (ESC) can be the ba-sis for providing these subsidies. However, the ESC has to be improved. At present, the ESC is not targeted to-wards the poor and does not differentiate between a stu-dent who cannot find a place in a public school and one who chooses a private school for other reasons (ADB
Elementary Secondary
Performance Indicators 1994 1997 1994 1997
Internal Efficiency Indicators
Repetition ratea 6.09 5.05 2.40 2.60
Drop-out ratea 3.15 1.93 1.48 1.25
Completion rate 1.39 1.39 1.13 1.16
Cohort survival rate 1.40 1.30 1.12 1.19
MPS in NEAT/NSAT 1.30 1.24 1.30 1.21
Operating unit cost 1.24 0.88 1.11 0.89
aRefers to inverse of the indicator. This conversion ensures that all
the performance indicators are such that higher scores refer to better performance.
Source: Maglen and Manasan 1999.
Table 1. Comparative school performance indicators in basic education (ratio of private to public indicators)
"...The need to shift the emphasis at the
secondary level away from the further
expansion of public education provision
towards greater financial support for private
education (in locations where feasible)
becomes apparent ... A means-tested
subsidy program aimed at improving the
access of poor students to secondary
education will be necessary."
of the DECS budget in favor of personal services at the expense of maintenance and other operating expendi-tures. Without doubt, the underfunding of nonsalary re-current expenditures contributed to the poor quality of basic education in the public sector.
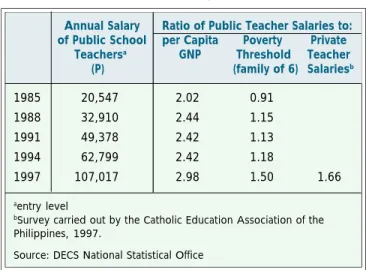
Teacher remuneration. Personnel services is the single biggest item in the DECS budget, the share of which rose from 74.3 percent in 1990 to 87.7 percent in 1999 (Table 2). The dramatic rise in personnel expenditure is largely attributable to adjustments in the salaries of pub-lic school teachers that were implemented by the govern-ment in the late 1980s and most of the 1990s. Between 1985 and 1997, the remuneration of government teach-ers went up by a multiple of 5 in nominal terms and by a multiple of 3 in real terms. In 1997, the entry level sal-ary of a public school teacher was 70 percent higher than his/her private school counterpart (Table 3). More-over, even by international standards, public school teacher salaries appear to be on the high side. To wit, teacher remuneration as a ratio of GNP per capita in the Philippines was equal to 3.0 in 1997 compared to an “Asian” mean of around 2.5 at the primary level.4
cation, the increase in the number of teachers (teachers holding position titles Master Teachers I-II and Teachers I-III) in government schools did not keep pace with the growth of enrolment in the 1990s. At the elementary level, the number of teachers rose by 1.4 percent yearly on the average vis-à-vis a 2.3 percent growth in enrolment. In comparison, the number of public school teachers in the secondary level grew by 4.4 percent yearly compared to a 5.3 percent growth in enrolment. Consequently, the student-teacher ratio in public elementary schools went up from 31 in SY 1981-1982 to 34 in 1996-1997 while in public secondary schools, it increased from 29 to 34.
Teacher deployment. During this period, there was also no commensurate attempt to rationalize the deploy-ment of teachers. Thus, teacher productivity did not ap-preciably increase in line with salary improvements. This is clearly shown in the wide disparity between the aver-age class size and the averaver-age student-teacher ratio in public elementary and secondary schools. In SY 1997-1998, for instance, the average class size in government elementary and secondary schools were 41 and 50, re-spectively, while the average student-teacher ratios were 35 in public elementary schools and 34 in public sec-ondary schools. These figures imply that while there may be a surplus in the total number of teachers when reck-oned on a nationwide basis, some geographical areas
Annual Salary Ratio of Public Teacher Salaries to:
of Public School per Capita Poverty Private
Teachersa GNP Threshold Teacher
(P) (family of 6) Salariesb 1985 20,547 2.02 0.91 1988 32,910 2.44 1.15 1991 49,378 2.42 1.13 1994 62,799 2.42 1.18 1997 107,017 2.98 1.50 1.66 aentry level
bSurvey carried out by the Catholic Education Association of the
Philippines, 1997.
Source: DECS National Statistical Office
Table 3. Nominal and comparative changes in public teacher remuneration, 1985-1997
Given budget constraints, high teacher salaries naturally limit the government’s capacity to hire new teach-ers to cope with ever-expanding enrolments. In basic
edu-Expenditure Types 1990 1993 1995 1997 1999 Personnel Services 74.34 82.63 79.34 83.96 87.69 MOOE 16.49 15.05 10.12 8.65 8.85 Of which GASTPE 4.34 3.89 2.61 - 1.10 Capital Outlay 9.17 2.31 10.54 7.90 3.47 Total 100.00 100.00 100.00 100.00 100.00
Source: Maglen and Manasan 1999.
Table 2. Percentage distribution of central government expenditures in basic education, 1990-1999
__________
4The ratio for the Philippines came from Maglen and Manasan
(1999) while the ratio for the average Asian country came from Lewin (1997).
may suffer a teacher shortage because of problems in the deployment of public school teachers. One problem is related to the constraints imposed under the Magna Carta for Public School Teachers with regards to the re-assignment of teachers across geographical borders. Another relates to the current practice of assigning teach-ers to do administrative/clerical functions (that should otherwise be assigned to lower level positions) at the school and district offices. Officials of the DECS point out that this practice came about because of the diffi-culty in securing the approval of the DBM for nonteach-ing positions. Such a practice unnecessarily adds up to costs as clerical salaries are 30 percent lower than teacher salaries in government. The potential saving that would be generated by adopting a “teachers-teaching only” deployment is sizeable – about P2.3 billion per year.
Nonsalary recurrent expenditures. The growth in teacher salaries was accommodated at the expense of maintenance and other operating expenditures (MOOE), i.e., nonpersonnel recurrent expenditures, whose share in the DECS budget was halved from 16.5 percent in 1990 to 8.8 percent in 1999 (Table 2). Because of this, per student MOOE declined in real terms from P510 in 1990 to P175 in 1997 (Figure 5). The squeeze on MOOE has resulted in the short supply of key educational in-puts like textbooks, teaching/instructional materials, science laboratory equipment and supplies, and school desks as well as provisions for teacher training and main-tenance of school buildings. It is likely that this turn of
events contributed to the poor quality of education ser-vices in public schools. It could also partly explain why the achievement scores of students from public schools are lower than those from private schools even if teach-ers in public schools are better remunerated (and pre-sumably better qualified) than their private sector coun-terparts, particularly towards the latter part of the 1990s. In 1998, the textbook/student ratio stood at 1:6 in public elementary schools and 1:8 in public secondary schools, a far cry from the DECS target of 1:1. To reach the target, P6.6 billion would have been required in 1999 but the actual budget was only P480 million, just suffi-cient for a textbook/student ratio of 1:4.
At present, every student at the elementary level is required to have 8 textbooks. In the short term to the medium term, there is a need to consider whether or not all 8 are really necessary. If the number of textbooks needed by each student were cut from 8 to 6, for in-stance, it is estimated that the 1999 DECS budget would yield a textbook/student ratio of 1:3 instead of 1:4.
Another way of addressing the problem would be to require nonpoor students to buy their own textbooks. The public elementary school system currently provides places to more than 90 percent of total enrolment. Out of this, it is a fact that a substantial portion (around 65 percent) of those enrolled in public schools can afford to purchase their own textbooks. Adopting this approach will thus bring down the budget requirement needed to achieve a 1:1 ratio to P987 million. However, means-tested assistance would be essential for students from low-income fami-lies and a community-based approach to means-testing would increase its effectiveness and reduce the associ-ated costs.
Summary and conclusion
The need to improve access to and the quality of education in the country, especially in basic education, has been raised in a number of studies over the years. To address these concerns, this Policy Notes recommends the following: 0 100 200 300 400 500 600 1990 1991 1992 1993 1994 1995 1996 1997 Year
Per Student MOOE
P e r Student M O O E
Figure 5. Evolution of per student MOOE in basic education, 1990-1997 (pesos at 1993 prices)
] better coordination amongst DECS, TESDA and
CHED, with perhaps the DECS taking the lead role for purposes of dealing with functional overlaps and duplica-tion and/or inconsistency in policies, plans and programs in the education sector;
] need for another agency, perhaps the NEDA, to
serve as an arbiter in the intrasectoral budget prioritization in the entire education sector;
] support of current initiatives to strengthen
au-tonomous decisionmaking at the level of the divisions and the schools, particularly in the area of budgeting;
] shift in public financing towards the elementary
education subsector where larger positive externalities exist, away from the secondary and tertiary education subsectors;
] shift in the emphasis at the secondary level,
away from the further expansion of public education pro-vision towards greater financial support for private edu-cation in the light of low quality and high unit cost of public secondary schools;
] redesign of the ESC scheme to function as a
means-tested subsidy program aimed at improving the access of poor students to secondary education;
] improvement of teacher deployment by
review-ing the provisions of the Magna Carta for Public School Teachers that relate to the reassignment of teachers to other jurisdictions;
] improvement of teacher deployment by
allow-ing the DECS to hire needed nonteachallow-ing personnel;
] review of the number of textbooks that are
re-quired for each grade level; and
] charging of fees to nonpoor students for the
use of textbooks. 44
Bibliography
Asian Development Bank and World Bank. 1999. Philippine educa-tion for the 21st century. The 1998 Philippine educaeduca-tion sector study. Manila.
Canadian Higher Education Group (CHEG). 2000a. Models of decen-tralization: technical report. Working draft for the Decentraliza-tion of Basic EducaDecentraliza-tion Management (ADB TA No. 3115-PHI). ———. 2000b. Analysis of Form 7: general survey on decentralization
of specific powers/functions. Working draft for the Decentraliza-tion of Basic EducaDecentraliza-tion Management (ADB TA No. 3115-PHI). ———. 2000c. Planning the decentralization of basic education: a
de-velopment approach. Working draft for the Decentralization of Basic Education Management (ADB TA No. 3115-PHI). Development Academy of the Philippines. 1997. Policies, trends and
issues in Philippine education. Bangkok, Thailand: UNESCO. Filmer, Deon and Lant Pritchett. 1998. The effect of household wealth
on educational attainment around the world: demographic and health survey evidence. Policy Research Working Paper No. 1980. Washington, D.C.: World Bank.
Lewin, Keith. 1997. Educational development in Asia: issues in plan-ning, policy and finance. Asian Development Review 15 (2). Maglen, Leo and Rosario G. Manasan. 1999. Education costs and
financing in the Philippines. Technical Background Paper No. 2 in Philippine education for the 21st century: the 1998 Philippine education sector study. Asian Development Bank and World Bank.
For further information, please contact
The Research Information Staff Philippine Institute for Development Studies NEDA sa Makati Building, 106 Amorsolo Street
Legaspi Village, Makati City Telephone Nos: 8924059 and 8935705;
Fax Nos: 8939589 and 8161091 E-mail: [email protected]
[email protected] The Policy Notes series is available online at