STANFORD INSTITUTE FOR ECONOMIC POLICY RESEARCH
SIEPR Discussion Paper No. 09-023
The Effects of Performance-Based Teacher Pay on Student Achievement By
Sally Hudson Stanford University
July 2010
Stanford Institute for Economic Policy Research Stanford University
Stanford, CA 94305 (650) 725-1874
The Stanford Institute for Economic Policy Research at Stanford University supports research bearing on economic and public policy issues. The SIEPR Discussion Paper Series reports on research and policy analysis conducted by researchers affiliated with the Institute. Working papers in this series reflect the views
of the authors and not necessarily those of the Stanford Institute for Economic Policy Research or Stanford University.
Pay on Student Achievement
Sally Hudson
§Honors Thesis
Advisor: Professor Caroline Hoxby
July 30, 2010
Abstract
I evaluate the effects on student achievement of the Teacher Advancement Program (TAP), a school-level intervention that offers teachers professional development resources and performance-based compensation. Because TAP typically targets low-performing schools, assignment to the intervention is non-random. I use synthetic control matching methods to identify appropriate comparison units. I then use a difference-in-differences model to estimate the effects of TAP on state achievement exam scores in reading and mathematics. I find that students in TAP schools outperform students in comparison schools by roughly 0.15 standard deviations in mathematics. I find smaller and less precisely estimated effects on reading achievement.
Keywords: teacher pay, performance-based pay, synthetic control matching
§I am indebted to Caroline Hoxby for her support and guidance – both during this project and
throughout my Stanford career. I wish to thank Glenn Daley at TAP for assembling data on TAP schools and offering regular feedback throughout my work, as well as the dedicated data specialists in the Departments of Education of the states involved in this study. I gratefully acknowledge financial support from the Stanford Fund and the Department of Economics Summer Undergraduate Research Assistant Program.
Introduction
For the vast majority of U.S. public school teachers, pay is a function of just two variables. Take the highest academic degree a teacher has earned and the number of years she has spent teaching, and together they determine her salary. More than 96 percent of public school districts pay teachers according to a single salary schedule of this form (Podgursky 2007).
Though educational attainment and teaching experience are the primary deter-minants of teachers’ salaries, recent economic literature has established that neither factor is a significant predictor of teacher quality. Students of teachers with graduate degrees perform no better on average than students of teachers without them, and the effects of experience on student achievement appear insignificant in all but the first two years of a teacher’s career (Aaronsonet al. 2007, Rivkin et al. 2005, Rockoff 2004). Payments for teacher education and experience also come at great expense to public schools. The average school spends more than 20 percent of its teacher wage bill on automatic salary augmentations for education and experience alone (Ballou and Podgursky 2002).
In light of evidence that current contracts reward teachers for inputs unrelated to student achievement, political pressure to reform teacher compensation schemes is mounting. Many reformers have called on schools to tie teacher pay directly to student performance. Under a performance-based pay scheme, schools would use test scores, classroom evaluations, and other measures of teacher productivity to deter-mine teacher pay. Since evidence on the effects of performance-based pay is still limited, the federal government has appropriated billions of dollars to finance and evaluate performance-based pay programs. In 2006, Congress created the Teacher Incentive Fund (TIF), an initiative that awards grants to districts and states that implement performance-based pay programs. The Department of Education has also allocated $4.35 billion for the Race to the Top Fund, a program that awards state-level
grants for major education reforms. The first round of grants were awarded in March for proposals from Delaware and Tennessee, both of which contained performance-based pay elements (U.S. Department of Education 2010).
But support for performance-based pay is by no means unanimous. Florida Gov-ernor Charlie Crist vetoed a bill in April that would have tied both teacher pay and tenure to measured student achievement (Gabriel and Cave 2010). Another mea-sure has been tabled in Georgia’s state legislature (Torres 2010). In both states, performance-based pay legislation has been met with staunch opposition from teach-ers’ unions. Many teachers question the potential for performance-based compensa-tion to improve public educacompensa-tion and fear its repercussions for existing employees.
Given the controversy over teacher compensation, it is critical that policy-makers draw on sound evidence from existing performance-based pay programs as they de-sign new reforms. Toward this end, I present an empirical evaluation of the Teacher Advancement Program (TAP), the largest performance-based pay intervention in the United States. Because TAP typically operates in low-performing schools, assign-ment to the intervention is non-random. I therefore use synthetic control methods to identify appropriate comparison units in this non-experimental setting. I then exploit variation in the timing of TAP participation to estimate the program’s effects on stu-dent achievement using a difference-in-differences framework. I find that stustu-dents in TAP schools outperform students in synthetic controls by roughly 0.15 standard de-viations on state achievement exams in mathematics. I find smaller and less precisely estimated effects on reading achievement.
In the following section, I describe the TAP model and its performance-based compensation scheme. I then review the existing literature on performance-based teacher pay and synthetic control methods. After describing my data sources and empirical strategy, I present my results. I conclude by comparing my results to those of other education reforms and providing some basic cost-benefit analysis.
Background on TAP
Launched in 1999 by the Milken Family Foundation, TAP is an education interven-tion aimed at helping schools recruit, train, and retain effective teachers. Arizona was the first state to implement TAP, selecting five schools to participate in the 2000-2001 school year. Since then, 17 states and the District of Columbia have implemented TAP in at least one school. TAP is currently active in 227 schools nationwide. These schools serve more than 85,000 students and employ more than 7,500 teachers.
Though TAP maintains a relationship with the Milken Family Foundation, it now operates under the administrative purview of the National Institute for Excellence in Teaching (NIET), a 501(c)(3) public charity established in 2005. The NIET receives financial support from both private and public sources, including the U.S. Depart-ment of Education. Participating schools fund TAP through their local budgets and external grants from programs like the Teacher Incentive Fund.
The TAP model has four essential elements: (1) multiple teaching career paths, (2) ongoing applied professional growth, (3) instructionally focused accountability, and (4) performance-based compensation.1 The goal of the first element is to
al-low schools’ strongest teachers to assume greater leadership roles without leaving the classroom altogether. TAP schools identify two types of specialized instructors called “Master” and “mentor” teachers. Master teachers work closely with administrators to measure and analyze student performance. They also observe classroom instruc-tion, lead teacher development groups, and teach model lessons. Mentor teachers assist other members of the TAP leadership team in evaluating teachers and pro-viding regular feedback about instructional practices. Master and mentor teachers are selected through competitive, performance-based assessments conducted by both internal and external evaluators, and they are compensated for their additional work. In the 2009-2010 school year, TAP recommended salary augmentations ranging from
$10,000 - 20,000 for Master teachers and $5,000 - 12,000 for mentor teachers.
The second TAP element is ongoing applied professional growth. These programs may vary some across schools so that each school can focus on the specific needs of its teachers and students. In general, TAP schools organize teachers in “cluster groups” by grade and subject. Master teachers lead these groups in instructional exercises, peer feedback sessions, and examining data on student achievement.
The third TAP element is instructionally focused accountability. Principals and Master teachers perform classroom evaluations of every instructor at least four to six times each year. At least half of these evaluations must be unannounced. Evaluators assess teachers using the TAP Instructional Rubric, a set of clearly defined standards that promote specific teaching practices. To ensure objectivity, TAP administrators train and certify evaluators annually and track the reliability of ratings across eval-uators. Every evaluation includes immediate feedback for the instructor after the session. Teachers then use the results to guide their professional development and cluster group work.
TAP schools also use instructional evaluations to determine performance-based compensation, the fourth TAP element. Schools calculate performance awards using three measures of teacher performance: instructional evaluations, teacher-level value added scores, and school-level value added scores. Schools derive individual evalua-tion scores from the Rubric described above. These scores are then averaged across all evaluations to produce a single score between 1 and 5.
To calculate value-added scores, schools outsource data from standardized achieve-ment exams to SAS Institute Inc., a for-profit software and analytics firm. The SAS Institute uses SAS!R EVAAS!R, a value-added model developed by Dr. William Sanders of the University of Tennessee. In calculating value-added scores, SAS!R EVAAS!R first estimates average annual achievement growth in each grade and sub-ject using test scores from a reference population of both TAP and non-TAP
teach-ers. It then uses a fixed effects model to estimate how students of each TAP teacher perform relative to these average growth figures. SAS!R EVAAS!R only calculates value-added scores for teachers with at least 10 student test score observations in the given year. Teachers who serve students in multiple tested subjects or grades receive separate fixed effect estimates for each group. These estimates are then weighted by group size to determine a single estimate for each teacher.2
SAS!R EVAAS!R converts each teacher’s value-added estimate to a discrete score from 1 to 5. Teachers with fixed effect estimates more than two standard errors below the reference average earn a score of 1. Teachers whose estimates fall between one and two standard errors below the average receive a score of 2. Teachers who earn a score of 3 have estimates within one standard error of the average, while scores of 4 and 5 are awarded to teachers whose estimates are at least one and two standard errors above the average, respectively. SAS!R EVAAS!R uses a similar procedure to calculate school-level value-added estimates and assigns each TAP school a score from 1 to 5, as well.
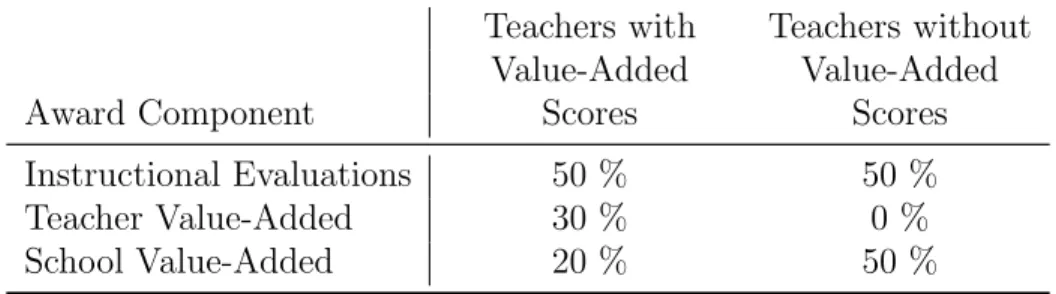
Each teacher’s total performance award is then determined as follows. TAP schools contribute a fixed dollar amount for each teacher toward a pool of bonus funding. This amount typically ranges from $2500 - 3000. Schools create separate pools for teachers with and without individual value-added scores so that all teachers can qualify for the same total bonus regardless of whether they teach tested subjects. Table 1 displays how schools allocate funding for each award component within these pools. For all teachers, 50 percent of the bonus pool is allocated for awards based on instructional evaluations. For teachers without individual value-added scores, the remaining 50 percent is dedicated to school value-added awards, while teachers with value-added scores can qualify for both individual and school-level bonuses.3
2For a more thorough discussion of the SAS!R EVAAS!R model, see Solmonet al. (2006).
3Administrators in some TAP schools also receive awards for school-level performance, but these funds are drawn from a separate pool.
Table 1: Portion of Pool Reserved for Each Award Component Teachers with Teachers without
Value-Added Value-Added
Award Component Scores Scores
Instructional Evaluations 50 % 50 %
Teacher Value-Added 30 % 0 %
School Value-Added 20 % 50 %
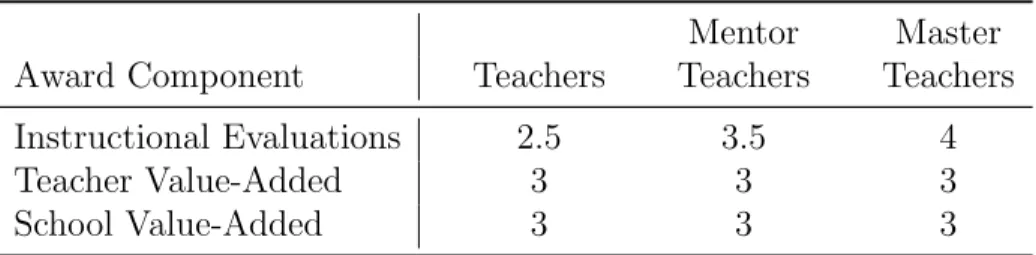
Teachers must qualify for each component of their bonus separately. Table 2 presents the minimum qualifying scores for each component by teacher type. Note that Master and mentor teachers must attain higher instructional evaluation scores than traditional teachers to qualify for the instructional component of their bonus. Teachers who qualify for a given component split the corresponding portion of the bonus pool. For example, all teachers who earn an individual value-added score of 3 or higher split the 30 percent of funding allocated for these bonuses. Higher scores earn teachers a greater share of the pool. I omit the explicit calculations here and present a detailed example in Appendix 1.
There are several key points to highlight when considering how TAP’s performance awards affect teachers’ incentives. First, TAP uses absolute measures of performance to determine bonuses rather than relative rankings so as not to encourage competition among teachers. Still, every additional teacher who qualifies for a bonus reduces the award value for every other qualifying teacher since they each receive a share of the same pool of funding. Indeed, as the Appendix example illustrates, teachers’ bonuses may depend heavily on the performance of their colleagues. Second, TAP errs on the side of awarding lots of bonuses since all teachers with scores of 3 or higher qualify for value-added awards. That said, teachers with higher scores earn larger bonuses, so there are incentives to both meet and exceed the qualifying thresholds. Finally, TAP instructs schools not to publicize the list of bonus recipients or the size of their awards. All teachers know if their school qualifies for a value-added bonus, but they
Table 2: Minimum Qualifying Scores for Performance Awards Mentor Master Award Component Teachers Teachers Teachers Instructional Evaluations 2.5 3.5 4
Teacher Value-Added 3 3 3
School Value-Added 3 3 3
should not know the bonus status of their colleagues. Consequently, TAP’s compen-sation scheme should not create any social stigma or rewards based on who earns bonuses.
Literature Review
Performance-Based Teacher Pay
I now review the existing literature on performance-based teacher pay. Though few empirical evaluations have been conducted, the theoretical implications of performance-based pay are fairly straightforward. Lazear (2003) proposes two primary mechanisms through which performance-based pay may improve student achievement. First, per-formance awards increase the return to teacher income of activities that improve mea-sured achievement, thereby incentivizing teachers to invest time and effort in these activities. Second, awards increase the expected value of wages for high-performing teachers, so these individuals should be more likely to seek jobs at schools that of-fer performance-based pay. Consequently, performance awards may affect both the productivity of existing faculty and the composition of new faculty at participating schools.
Most of the existing literature on performance-based pay has focused on the first of these channels. Glewwe et al. (2008) analyze the short-term effects of merit pay using a randomized intervention in rural Kenyan primary schools. The program
offered bonuses to teachers based on their schools’ average scores on district-wide ex-ams. Awards ranged in value from 21 to 43 percent of the average teacher’s monthly salary. The authors find that students in treatment schools scored 0.14 standard deviations higher on average than students in control schools. Achievement gains exceeded 0.34 standard deviations in geography and history, subjects which required the most rote memorization, the authors argue. Though the program succeeded in improving student performance, its effects were short-lived. The authors find no sig-nificant differences in achievement between treatment and control schools after the intervention was discontinued.
Muralidharan and Sundararaman (2009) conducted a more complex randomized trial in rural India. They assigned treatment schools to two separate interventions. Teachers in 100 schools were offered awards based on school-level performance, while teachers in 100 other schools were offered awards based solely on their own students’ test scores. In both cases, awards were valued at roughly 3 percent of a typical teacher’s annual salary. At the end of the program’s second year, students in treat-ment schools outperformed students in control schools by 0.16 and 0.28 standard deviations in language and mathematics, respectively. The authors find the largest achievement gains in teacher-level incentive schools, suggesting that individual incen-tives are more effective than group incenincen-tives in improving teacher performance. The authors also identify significant achievement gains in subjects for which no awards were offered, suggesting that performance-based pay may generate positive spillovers. Other authors have attempted to estimate the effects of performance-based pay using non-experimental methods. Lavy (2002, 2009) analyzes two merit pay inter-ventions in Israeli high schools. Both interinter-ventions determined awards through rank-order tournaments, paying bonuses to only the top performers. The first intervention was aimed at reducing schools’ drop out rates and raising their pass rates on high school matriculation exams. The top one-third of schools demonstrating
improve-ments received lump sum awards to be distributed evenly among their teachers. The largest awards were valued at roughly 3 percent of the average teacher’s salary. Lavy finds these group incentives induced significant reductions in drop out rates, but had no significant effects on exam performance. The second intervention offered teachers individual awards for their students’ matriculation exam scores. Bonuses were sub-stantially larger in the second tournament, ranging in value from 6 to 25 percent of the average teacher’s annual salary. Lavy identifies significant improvements in mean exams scores following the second intervention. His findings reinforce the notion that awards based on individual teacher performance may have stronger effects on student achievement than awards based on group-level outcomes, though it is difficult to ac-count for the difference in bonus sizes.
All of the aforementioned studies estimate the short-run effects of performance-based pay on the productivity of existing faculty. Few studies have attempted to document the long-run effects of performance-based pay on the employment of high-performing teachers, largely because few merit pay interventions have lasted long enough to allow for gradual changes in teacher sorting. Indeed, there is so little vari-ation in teacher pay in the United States that few reliable studies on the relvari-ationship between offered salaries and teacher quality have been conducted. Hoxby and Leigh (2004) offer evidence that the absence of differentiated teacher pay has driven many high-aptitude4 individuals out of teaching. The authors decompose the incentives
to leave teaching into two factors: the “pull” of higher wages in other occupations and the “push” of pay compression in teaching. Using variation in unionization laws to capture the “push” effect, they estimate that pay compression accounts for 80 percent of the reduction in the country’s share of highest aptitude teachers. Their results suggest that performance-based pay differentiation may provide incentives for high-aptitude individuals to pursue careers in teaching.
In this paper, I do not attempt to identify the mechanism(s) through which TAP’s performance awards affect student achievement, though there is reason to believe my estimates capture both the short-run and long-run effects proposed by Lazear (2003). Several of the schools in my sample have been employing TAP for more than eight years, allowing time for local teachers to adjust their employment decisions in re-sponse to differential pay. None of the studies cited earlier present results from more than two intervention years. Moreover, unlike schools in these temporary experi-ments, most TAP schools intend to continue providing performance awards for the foreseeable future, offering teachers who move to TAP schools a longer time horizon on which to collect higher pay.
Synthetic Control Matching
The methods employed in existing evaluations of performance-based pay interven-tions are not suitable for analyzing the effects of TAP. Unlike the programs in Kenya and India, TAP is not randomly assigned to participating schools. TAP typically operates in schools with low-performing and economically disadvantaged students, as I demonstrate in the Data section. The intervention in Lavy (2009) also targeted low-performing schools, but that program was explicitly assigned based on an ob-served measure of school performance. Consequently, Lavy is able to use regression discontinuity methods to estimate the difference in achievement outcomes for schools just above and below the threshold for assignment to treatment.5 Since TAP does
not explicitly select schools based on observable characteristics, I cannot use these methods to evaluate its effects.
Instead, I rely on synthetic control methods to compare achievement outcomes in TAP schools to those of untreated schools. Synthetic control matching first appeared in the literature in Abadie and Gardeazabal (2003) and was later formalized and re-5Lavy also identifies measurement error in the variable used to assign treatment, which, in effect, produces a randomized treatment sample.
fined in Abadieet al. (2007). Synthetic control methods allow researchers to estimate the effects of interventions in which assignment to treatment is both non-random and non-deterministic. The basic idea behind synthetic control matching is that a com-bination of several untreated units can often provide a better comparison for each treated unit than any single unit can alone. Consider a hypothetical TAP school named George Washington Elementary. George Washington has certain observable characteristics, such as its racial and ethnic composition and its student-teacher ratio. It is unlikely that another school in George Washington’s area has exactly the same traits. Some potential comparison schools may have more minority students, some fewer; some may have more students per teacher; some fewer. The goal of synthetic control matching is to combine data from all potential comparison schools to generate a synthetic school that is as similar as possible to George Washington Elementary prior to the TAP intervention.
More formally, consider a hypothetical intervention in a region withN+1 schools. Suppose for the sake of simplicity that school t is the only treated school. Let Xt be a k ×1 vector of pre-intervention characteristics for school t, and let XU be a
k×N matrix that contains the same variables for theN untreated schools. The basic synthetic control algorithm proposed in Abadie et al. (2007) attempts to solve the following optimization problem:
min W∈RN + "Xt−XUW" s.t N ! i=1 Wi = 1 (1)
That is, the algorithm identifies the vector of non-negative weights that minimizes the distance between the observed characteristics of the treated school and the untreated schools. Each component Wi captures the extent to which school i contributes to the synthetic version of school t. These weights are then used to generate data for synthetic schoolt in the post-intervention period. The actual algorithm implemented
in Abadieet al. (2007) contains several additional refinements, allowing in particular for synthetic control matching based on trends in pre-intervention characteristics. The primary advantage of synthetic control matching is that it does not rely on ad hoc selection of appropriate comparison units. Ad hoc selection was common in evaluations of school interventions prior to the advent of more sophisticated quasi-experimental methods. Ladd (1996), for example, attempts to estimate the effects of a short-lived performance award program in the Dallas Independent School District by comparing test scores from students in Dallas to test scores from Austin, El Paso, Forth Worth, Houston, and San Antonio. Though each of these cities resembles Dallas along some traits, it is unclear which city provides the most appropriate control for the Dallas intervention. Synthetic control matching would have provided an objective measure of the extent to which each of proposed comparison cities resembled Dallas in the pre-intervention period.
To date, synthetic control methods have been used to study a wide variety of interventions, policies, and shocks. Abadie and Gardeazabal (2003) use synthetic control matching to estimate the effects of terrorist conflict on the Basque economy in Spain. Moser (2005) constructs a synthetic Switzerland to analyze the impact of Swiss patent laws. Abadie et al. (2007) study the effects of a large-scale tobacco control program in California in their seminal paper on synthetic control methods. More recently, Fitzpatrick (2008) uses synthetic control matching to analyze the effects of universal pre-kindergarten on student achievement in Georgia.
Data
I draw my sample from the 11 states that currently employ the TAP model as de-scribed in the Background section.6 They are Arkansas, Colorado, Indiana, Louisiana,
Minnesota, North Carolina, Ohio, Pennsylvania, South Carolina, Tennessee, and Texas. The Louisiana Department of Education was unable to provide complete achievement data for most of its TAP-affiliated districts, many of which were affected by Hurricane Katrina, so I exclude Louisiana TAP schools from my sample. The remaining 10 states provide an initial sample of 199 TAP schools.
I further exclude schools on the basis of several data restrictions. Because the syn-thetic control algorithm matches schools based on their observed characteristics prior to the intervention, I must exclude all schools for which there are no pre-TAP data. This eliminates schools that implemented TAP during their first year of operation or prior to the first year of available achievement data. I must also exclude schools for which there are no post-intervention data. This eliminates all schools that introduced TAP in the 2009-2010 school year since test scores from the current year have yet to be released. Lastly, I exclude schools that do not serve grades in which students take state achievement exams. This typically eliminates primary schools and high schools that begin with grade 11. The final sample contains 151 schools. Of these, 135 were active TAP schools during the 2008-2009 school year. Table 3 summarizes the distribution of these schools across states and years.
I match TAP schools to synthetic controls using achievement and demographic data from statewide assessments in each of the 10 sampled states. In all states, I use grade-level mean scale scores in reading and mathematics from the same examinations TAP schools use to determine performance awards. Table 27 in Appendix 2 lists the examinations used in each state, along with the grades and years for which scores are 6Illinois also operates schools that are affiliated with TAP, but these schools have implemented a modified version of the TAP model described earlier and are therefore excluded from my analysis.
Table 3: Active TAP Schools by State and Year State 2002 2003 2004 2005 2006 2007 2008 2009 Arkansas 2 1 1 Colorado 4 9 14 14 15 15 15 Indiana 3 7 7 7 11 11 11 Minnesota 3 8 10 16 15 North Carolina 1 Ohio 1 5 12 12 Pennsylvania 3 9 South Carolina 5 5 5 7 9 15 35 39 Tennessee 3 4 4 Texas 2 7 9 28 All States 5 12 21 31 41 68 106 135 Notes: Year column-headings refer to the spring term of each school year (i.e. 2002 is the 2001-2002 school year).
available. In keeping with federal requirements, state assessment data also identify the number of test-takers in each grade by race, gender, disability, English language proficiency, and eligibility for free and reduced-price school lunches. Some states have moved more slowly than others to comply with these reporting requirements. Con-sequently, grade-level demographic data from Arkansas, Indiana, and Tennessee are unavailable for several of the years I study. I therefore report separate results for states with and without these data.
I supplement demographic data from state achievement exams with school-level demographic data from two sources: the Common Core of Data and the Private School Universe Survey (PSS). Both databases are maintained by the National Center for Education Statistics. The Common Core of Data surveys all U.S. public schools; the PSS surveys U.S. private schools. Both datasets disaggregate school enrollment by grade, race, and gender and contain data on student-teacher ratios. The free and reduced-price lunch data are missing for most observations in Indiana and Pennsyl-vania, so I obtain these variables directly from their state Departments of Education.
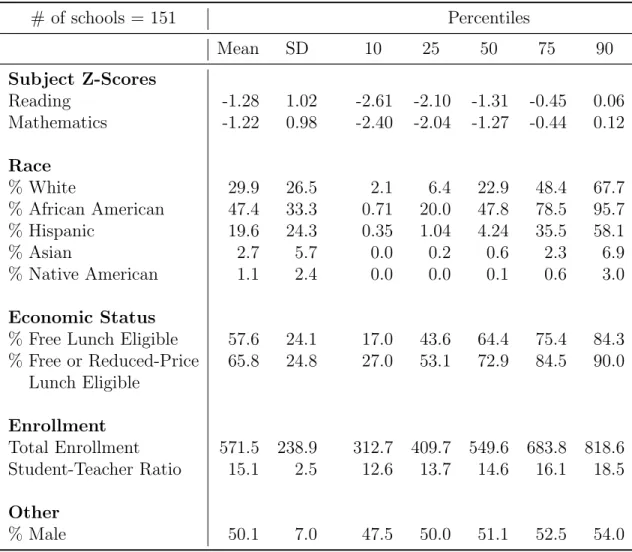
Table 4: Pre-TAP Descriptive Statistics for All TAP Schools # of schools = 151 Percentiles Mean SD 10 25 50 75 90 Subject Z-Scores Reading -1.28 1.02 -2.61 -2.10 -1.31 -0.45 0.06 Mathematics -1.22 0.98 -2.40 -2.04 -1.27 -0.44 0.12 Race % White 29.9 26.5 2.1 6.4 22.9 48.4 67.7 % African American 47.4 33.3 0.71 20.0 47.8 78.5 95.7 % Hispanic 19.6 24.3 0.35 1.04 4.24 35.5 58.1 % Asian 2.7 5.7 0.0 0.2 0.6 2.3 6.9 % Native American 1.1 2.4 0.0 0.0 0.1 0.6 3.0 Economic Status
% Free Lunch Eligible 57.6 24.1 17.0 43.6 64.4 75.4 84.3 % Free or Reduced-Price 65.8 24.8 27.0 53.1 72.9 84.5 90.0 Lunch Eligible Enrollment Total Enrollment 571.5 238.9 312.7 409.7 549.6 683.8 818.6 Student-Teacher Ratio 15.1 2.5 12.6 13.7 14.6 16.1 18.5 Other % Male 50.1 7.0 47.5 50.0 51.1 52.5 54.0 Notes: Variables are first averaged at the school-level over all available pre-TAP years. School-level averages are then weighted by total enrollment to produce the values reported above. Reading and mathematics scores are reported as z-scores standardized at the state-grade-year level and then averaged over tested grades within each school.
I present descriptive statistics for the full sample of TAP schools in Tables 4 and 5. Tables 17-26 of Appendix 2 contain descriptive statistics for TAP schools in each state. Prior to the introduction of TAP, the average TAP school scores near its state’s 10th percentile in both reading and mathematics. The bottom 10 percent of TAP schools are among the 1 percent of worst-performing schools in their states, while the top 10 percent of TAP schools score just above their state means. The average TAP school is majority non-white and economically disadvantaged, as measured by
Table 5: Pre-TAP Descriptive Statistics for All TAP Schools # of schools = 134 Percentiles
Mean SD 10 25 50 75 90 % Special Education 9.8 5.2 3.9 5.4 9.2 13.9 17.4 % LEP 9.6 14.2 0.0 0.4 2.7 13.5 36.9 Notes: Excludes 17 TAP schools in Arkansas, Indiana, and Tennessee as these states do not report special education and LEP data prior to TAP. Variables reported in Table 4 are omitted as their values are similar to the full sample results.
students’ eligibility for free and reduced-price school lunches. The distribution of lim-ited English proficiency (LEP) students among TAP schools is strongly right skewed, with a small number of schools serving student bodies that are nearly half LEP. Not surprisingly, TAP schools in Texas and Colorado serve more Hispanic students on average than TAP schools nationwide, though TAP schools in Minnesota have the highest fraction of LEP students.
Empirical Methodology
Synthetic Control Matching
I match TAP schools to synthetic controls using the synth package for STATA developed by Abadie, Diamond, and Hainmueller. The synth command requires the user to specify an outcome variable, a set of predictor variables, and a “donor pool” of candidate control units for each treated unit. I generate separate synthetic controls for reading and mathematics outcomes in order to allow the effects of TAP to vary across subjects. In practice, however, both specifications tend to identify the same control schools with similar weights.
Each set of predictor variables contains school-level demographic traits and grade-level z-scores. At minimum, demographic variables include total enrollment,
student-teacher ratio, and share of enrollment by gender, race, and eligibility for free and reduced-price school lunches. I also include the share of students enrolled in special education and LEP programs for all states except Arkansas, Indiana, and Tennessee. In several of the sampled states, the set of tested grades expands during the study period. I incorporate z-scores from these additional grades as they become available. Minnesota, for example, did not administer tests in grades 6 and 8 until 2006. I therefore match Minnesota middle schools using grade 7 test scores through 2005 and grades 6, 7, and 8 thereafter.
The initial donor pool for each TAP school contains all non-TAP schools serving the same grade range in its state.7 Because the synth command requires that pools
contain no more than 75 schools, I further restrict each pool to schools that fall within a standard deviation of the given TAP school on all predictor variables. If the resulting pool is still too large, I impose successively tighter bounds until the pool is sufficiently small. Though pools may contain as many as 75 schools, the synthetic control algorithm rarely draws on every candidate control supplied. The median number of schools used to generate each synthetic control is five.
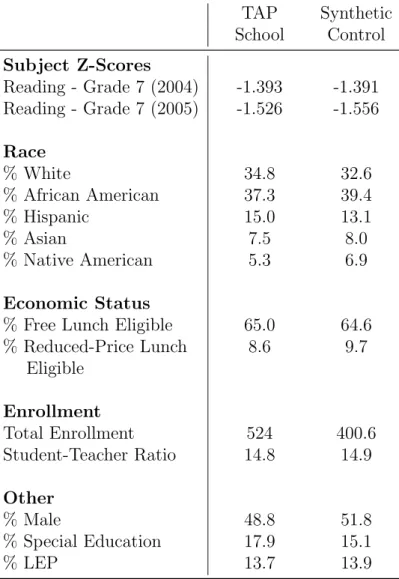
The synth command produces a vector of weights that indicates the extent to which each candidate control school contributes to the synthetic control. I use these vectors to generate demographic and achievement data for synthetic control schools. Formally, each datum for a given synthetic control is a linear combination of the corresponding data from its donor pool, where the synth output vector supplies the scalar weights. Table 6 presents summary statistics for an example TAP school and its synthetic control. Note that z-scores are matched year-by-year to ensure that the treated and synthetic control schools follow the same trend in achievement prior to TAP. Total enrollment is typically the most poorly matched predictor variable, as it is in Table 6.
7Indiana has implemented TAP in two Catholic archdiocese. For these TAP schools, I further restrict donor pools to Christian parochial schools.
Table 6: Example Synthetic Control Match Northeast Middle School - Minneapolis, MN
TAP Synthetic School Control Subject Z-Scores Reading - Grade 7 (2004) -1.393 -1.391 Reading - Grade 7 (2005) -1.526 -1.556 Race % White 34.8 32.6 % African American 37.3 39.4 % Hispanic 15.0 13.1 % Asian 7.5 8.0 % Native American 5.3 6.9 Economic Status
% Free Lunch Eligible 65.0 64.6 % Reduced-Price Lunch 8.6 9.7 Eligible Enrollment Total Enrollment 524 400.6 Student-Teacher Ratio 14.8 14.9 Other % Male 48.8 51.8 % Special Education 17.9 15.1 % LEP 13.7 13.9
Notes: Demographic variables are averaged over the pre-TAP period.
Difference-in-Differences Estimation
I use synth scalar weights to generate panel data for each synthetic control at the school-grade-year level. I then exploit variation in the timing of TAP participation to estimate the effect of TAP on measured achievement using a difference-in-differences model. I estimate models of the following general form :
Zgist =α+βIiTAP+γIitactive+δ(IiTAP×Iitactive) +% (2)
where Zgist is the z-score for grade g of school i in state s and year t. The dummy variable ITAP
i takes the value 1 if school i is a TAP school and 0 if school i is a synthetic control. The dummy variable Iactive
it indicates whether the TAP program was active in school i’s matched pair during year t. That is, if school i is a TAP school, then Iactive
it is 1 if school i employed TAP in year t. If school i is a synthetic control, then Iactive
it is 1 if the corresponding treated school employed TAP in year
t. The difference-in-differences estimator is δ, the coefficient on the interaction term
ITAP
i ×Iitactive. This parameter captures the effect on achievement of being a TAP school when TAP is actively in place.
I improve upon this baseline specification by including grade, school, state, and year controls. Formally, I estimate
Zgist =α+βIiTAP+γIitactive+δ(IiTAP×Iitactive) +Xgitθ+φg+σs+τt+% (3)
whereXgit is a vector of grade and school-level demographic controls andφg, σs, and
τt are grade, state, and year fixed-effects, respectively. Note that this specification allows for the inclusion of all schools that ever participated in TAP, including those that have discontinued the intervention. In order to determine whether the effects of TAP differ for schools that have and have not sustained the program, I estimate
equation (3) both with and without schools that discontinue TAP. I also analyze whether the effects of TAP vary with the duration of the program by estimating (3) with one and two-year lagged outcomes.
Though the synth algorithm attempts to generate synthetic controls that follow the same trend in achievement as their treated counterparts prior to the interven-tion, a perfect match is not always possible, especially in schools with several treated grades. I therefore use a detrended difference-in-differences estimation model to ac-count for differential linear trends in TAP achievement. I first estimate the pre-TAP achievement trend for each school by regressing subject z-scores on a full set of school dummies interacted with a discrete time variable for all years prior to the intervention. Formally, I estimate
Zgist =λ1(d1×t) +λ2(d2×t) +· · ·+λN(dN ×t) (4)
where di is a dummy for school i, and t = 0 for the year 2000, t = 1 for 2001, and so on. The estimated coefficient ˆλi capture the pre-TAP trend in achievement for school i. I use these estimates to predict achievement in each school during the post-TAP period: ˆZtrend
gist = ˆλit. I subtract these predicted z-scores from the observed values to obtain detrended z-scores: ˆZdetrend
gist =Zgist −Zˆgisttrend. I then re-estimate the specification in (3) using the detrended z-scores:
ˆ
Zgistdetrend =α+βIiTAP+γIitactive+δ(IiTAP×Iitactive) +Xgitθ+φg +σs+τt+% (5)
Results
I present estimates from the baseline difference-in-differences model in Tables 7 and 8. The dependent variables in both tables are subject z-scores, so coefficient estimates measure the fraction of a standard deviation by which test scores in TAP
Table 7: Difference-in-Differences Estimates, Reading Specification (1) (2) (3) (4) TAP Dummy -0.37*** -0.23*** -0.21*** -0.23*** (0.12) (0.08) (0.07) (0.07) Active Dummy 0.20** 0.04 0.08* 0.05 (0.09) (0.05) (0.05) (0.05) Interaction Term 0.08 0.04 0.06 0.11* (0.14) (0.08) (0.06) (0.06) Total Enrollment 0.0008*** 0.0003 0.0001 (0.0002) (0.0001) (0.0001) Student-Teacher Ratio -0.02* 0.01 0.02 (0.01) (0.01) (0.01) % Male 0.23 -0.88** -1.15* (0.38) (0.42) (0.62) % White 3.84 -3.02 -4.52 (3.25) (3.72) (4.11) % African American 1.98 -4.85 -6.47 (3.26) (3.72) (4.10) % Hispanic 2.61 -4.96 -6.03 (3.24) (3.73) (4.10) % Asian 0.88 -5.49 -6.55 (3.24) (3.74) (4.10) % Native American -2.56 -7.99** -9.31*** (3.43) (3.91) (4.31) % Free Lunch Eligible -1.85** -1.13* -1.60**
(0.76) (0.67) (0.73) % Free or Reduced-Price 0.70 -0.18 0.42 Lunch Eligible (0.68) (0.61) (0.71) % Special Education -0.84 (0.90) % LEP -1.08*** (0.33) Constant -1.05*** -3.31 3.65 5.22 (0.07) (3.29) (3.78) (4.09) Grade Fixed Effects No No Yes Yes State Fixed Effects No No Yes Yes Year Fixed Effects No No Yes Yes # of TAP Schools 151 147 147 134 AdjustedR2 0.032 0.509 0.588 0.573
Notes: Standard errors are clustered at the school-level and presented in parentheses.
* p <0.1
** p <0.05
Table 8: Difference-in-Differences Estimates, Mathematics Specification (1) (2) (3) (4) TAP Dummy -0.32*** -1.56** -0.15** -0.17** (0.12) (0.08) (0.07) (0.08) Active Dummy 0.18** 0.03 0.01 0.002 (0.09) (0.05) (0.05) (0.05) Interaction Term 0.17 0.10 0.10 0.13* (-1.04) (0.08) 0.05) (0.08) Total Enrollment 0.0009*** 0.0005 0.0004* (0.0002) (0.0001) (0.0002) Student-Teacher Ratio -0.01 0.02 0.01 (0.01) (0.01) (0.01) % Male 0.27 -0.56 -1.22** (0.38) (0.42) (0.61) % White 1.96 1.31 1.24 (3.28) (4.15) (4.89) % African American -0.32 -0.79 -1.15 (3.29) (4.14) (4.87) % Hispanic 0.50 -0.31 -0.52 (3.26) (4.14) (4.88) % Asian 0.37 0.33 0.12 (3.28) (4.14) (4.86) % Native American -5.60* -3.47 -3.88*** (3.39) (4.47) (5.19) % Free Lunch Eligible -1.62** -0.88 -1.04**
(0.71) (0.70) (0.80) % Free or Reduced-Price 0.97 -0.03 0.36 Lunch Eligible (0.66) (0.66) (0.77) % Special Education -0.22 (0.82) % LEP -0.10 (0.40) Constant -1.04*** -1.70 -0.57 -0.27 (0.08) (3.29) (4.20) (4.90) Grade Fixed Effects No No Yes Yes State Fixed Effects No No Yes Yes Year Fixed Effects No No Yes Yes # of TAP Schools 151 147 147 134 AdjustedR2 0.026 0.480 0.527 0.511
Notes: Standard errors are clustered at the school-level and presented in parentheses.
* p <0.1
** p <0.05
schools and synthetic controls differ. In both reading and math, the coefficient esti-mates for the interaction term are not significant at any conventional level in columns (1), (2), and (3). When controls for special education and LEP enrollment are added in column (4), estimates for both subjects are significant at the 90 percent level. The estimated effect is 0.11 in reading and 0.13 in math. That is, TAP is associated with an improvement of roughly one-tenth of a standard deviation on examinations in both subjects.
Most coefficient estimates for the demographic covariates are not statistically sig-nificant, with the exception of the controls for the fraction of male, Native American, and free lunch eligible enrollment. Estimated coefficients for all three of these vari-ables are large and negative. The fraction of LEP enrollment also appears to have a significant negative effect on reading achievement, though no effect in math. These general results persist in the other specifications I estimate, so I omit demographic covariate results from the remaining tables in order to focus attention on the coeffi-cients of interest.
Tables 7 and 8 offer one other important result. In all four specifications in each subject, the coefficients on the TAP dummy variable are negative and highly signifi-cant. Given that synthetic controls are matched based on pre-TAP achievement, we should not expect to find significant coefficient estimates for the assignment to treat-ment dummy. These results suggest that the synthetic control algorithm could not perfectly match pre-intervention achievement trends for several TAP schools. Indeed, as Figures 1 and 2 indicate, the pre-TAP achievement trends for synthetic controls are often slightly higher than the trends for their corresponding TAP schoosl.8 Figures
1 and 2 plot pre-TAP trends in z-scores for TAP schools against the trends for their synthetic controls. Observations below the 45 degree line indicate pairs in which the 8Inspection of individual pairs reveals that these matches may have been unavoidable. Several TAP schools have such low test scores and negative achievement trends in the pre-intervention period that virtually any weighted-average of candidate controls would result in synthetic test scores that are strictly higher in both level and trend
Figure 1: Pre-TAP Trends in Reading Z-Scores
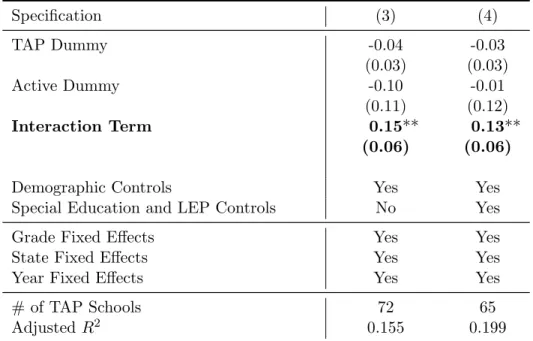
Table 9: Detrended Difference-in-Differences Estimates, Reading Specification (3) (4) TAP Dummy -0.04 -0.03 (0.03) (0.03) Active Dummy -0.10 -0.01 (0.11) (0.12) Interaction Term 0.15** 0.13** (0.06) (0.06)
Demographic Controls Yes Yes Special Education and LEP Controls No Yes
Grade Fixed Effects Yes Yes
State Fixed Effects Yes Yes
Year Fixed Effects Yes Yes
# of TAP Schools 72 65
AdjustedR2 0.155 0.199
Notes: Standard errors are clustered at the school-level and presented in paren-theses.
* p <0.1
** p <0.05
***p <0.01
synthetic control has a higher pre-TAP trend in achievement than its associated TAP school. These observations account for the negative coefficient estimates on the TAP dummy variables in Tables 7 and 8.
The results from Tables 7 and 8 motivate the use of detrending to remove the effect of differential pre-TAP achievement trends. I present estimates from the de-trended difference-in-differences model in Tables 9 and 10. Estimated effects in both subjects are positive and significant at the 95 percent level. The estimated effects with the full set of demographic controls are slightly higher than the original esti-mates: 0.13 in reading and 0.15 in mathematics. It is reassuring that the detrended point estimates are similar to those from the original specifications. Detrending does not substantially alter the estimated effect of TAP; it offers more precise estimates by removing the noise from pre-TAP achievement trends.
Table 10: Detrended Difference-in-Differences Estimates, Mathematics Specification (3) (4) TAP Dummy -0.05 -0.02 (0.03) (0.03) Active Dummy 0.02 0.13 (0.11) (0.11) Interaction Term 0.18*** 0.15** (0.06) (0.07)
Demographic Controls Yes Yes
Special Education and LEP Controls No Yes
Grade Fixed Effects Yes Yes
State Fixed Effects Yes Yes
Year Fixed Effects Yes Yes
# of TAP Schools 72 65
AdjustedR2 0.063 0.062
Notes: Standard errors are clustered at the school-level and presented in paren-theses.
* p <0.1
** p <0.05
***p <0.01
To assess how the effects of TAP vary with the program’s duration, I also estimate the difference-in-differences model with one and two-year lagged outcomes. I compare these results to the previous estimates in Table 11. The lagged math effects are both significant at the 95 percent level, with point estimates of roughly 0.2. Neither of the lagged reading estimates is significant at any conventional level.
The results in Table 11 suggest two general conclusions. First, students in TAP schools outperform students in comparison schools by roughly 0.15 standard devia-tions on statewide mathematics assessments. These results are robust to several spec-ifications of the model, including detrending and lagged outcomes. Second, TAP’s effect on reading achievement is both smaller and less precisely estimated. This is a typical result in empirical evaluations of education interventions – and for good rea-son. Schools simply have smaller and more variable influence over students’ reading ability. While children develop their language skills both at home and in school,
chil-Table 11: Results of Difference-in-Differences Estimation Reading Mathematics Diff-in-Diff 0.109* 0.127* (0.065) (0.075) Detrended Diff-in-Diff 0.134*** 0.152** (0.068) (0.083)
One Year Lag 0.051 0.218**
(0.074) (0.086)
Two Year Lag 0.076 0.244**
(0.098) (0.108) Notes: Standard errors are clustered at the school-level and pre-sented in parentheses. All specifications include the full set of demographic controls along with year, state, and grade fixed ef-fects.
* p <0.1
** p <0.05
*** p <0.01
dren tend to learn math almost exclusively through their schoolwork. For whatever reason, families just spend less time teaching math outside of school. Consequently, schools tend to have more direct control over math skills than reading ability. The unobserved variation in students’ home language learning generates noise in reading achievement data, resulting in imprecise estimates of reading effects.
Conclusions
In order to provide some context for my estimates, I conclude by comparing my results to those of other education interventions. First, note that my results are sim-ilar in magnitude to those obtained from experimental performance-based pay trials conducted outside the United States. Muralidharan and Sundararaman (2009) find effects of 0.16 and 0.28 standard deviations in reading and mathematics, respectively,
and Glewwe et al. (2009) find effects ranging from 0.14 to 0.34 standard deviations across several subjects. The similarities between our results suggest that performance-based pay can have positive effects on teacher productivity in a variety of different cultural and economic settings.
Second, TAP’s effect on achievement is large relative to other education interven-tions in the U.S. Consider the effect of class size reducinterven-tions, one of the most popular education reforms schools have attempted. In terms of expenditures, reducing class size has been the single most prominent education reform in the U.S. in the last 50 years.9 Experimental estimates from the now famous Project STAR find that a 10
percent reduction in class size led to an average improvement of 0.06 standard devi-ations on the Stanford Achievement Test (Krueger 1999).10 The estimated effect of
TAP on mathematics achievement is more than twice as large.
Moreover, TAP is inexpensive relative to class size reductions. The average per pupil cost of implementing TAP is $450. A 10 percent reduction in class size, mean-while, typically requires a 10 percent increase in per pupil expenditures (Hoxby 2000). Given average per pupil spending, it follows that a 10 percent reduction in class size costs about $1,150 per pupil. Combining these estimates with the results from Project STAR, we find that TAP offers more than twice the effect of class size reductions at roughly 40 percent of the cost per pupil.
It is important to note that the results I present in this paper make no attempt to explainhow TAP influences student achievement. They do not isolate the effect of TAP’s performance awards from the impact of other program components. Disentan-gling the effect of performance awards from other TAP elements is difficult because funding for bonuses is not randomly assigned to TAP schools. Schools determine for 9Class size reductions from 1960 to 2005 account for about half of the total increase in per pupil expenditures.
10These results are actually larger than many estimates of class size effects since Project STAR had several problems with attrition and non-random assignment. For a thorough discussion see Lehrer (2004).
themselves how much funding to dedicate to bonus pools, so award values may be driven by other factors that influence TAP’s impact, such as administrators’ overall support for the program. Since bonus funding is endogenously determined, I do not attempt to estimate how the effect of TAP varies with the size of offered awards at this time. Given that teacher training programs have historically proven ineffective, however, there is reason to believe that TAP’s effects on student achievement are due in large part to its performance-based compensation scheme.
Finally, when considering the policy implications of my results, it is crucial to remember that any effective incentive scheme will elicit the behavior it rewards. TAP rewards teachers for improving students’ scores on state achievement exams, so it should not be surprising that students of TAP teachers score higher on these tests. To expect otherwise, we would have to believe that teachers either do not value TAP’s bonuses or are unable to improve measured achievement. My estimates show that rewarding teachers for student outcomes can affect the outcomes students achieve, but they say nothing about what kind of achievement ought to be rewarded or how it should be measured. Deciding what counts as productive education is a complex task. Measuring desired outcomes is another challenge altogether. Some kinds of produc-tive teaching may be more difficult to measure and reward than others. These are all questions that must be addressed, and they will not have easy answers. Still, evidence that performance-based pay for teachers can affect student achievement should moti-vate educators and policy makers alike to design compensation schemes that reward the outcomes they desire most.
References
Aaronson, Daniel, Lisa Barrow, and William Sander, “Teachers and Student
Achievement in the Chicago Public High Schools,”Journal of Labor Economics, 2007, 25 (1), 95–135.
Abadie, Alberto, Alexis Diamond, and Jens Hainmueller, “Synthetic
Control Methods for Comparative Case Studies: Estimating the Effect of California’s Tobacco Control Program,” January 2007. NBER Working Paper 12831.
and Javier Gardeazabal, “The Economic Costs of Conflict: A Case Study of
the Basque Country,”The American Economic Review, 2003, 93 (1), 113–132.
Ballou, Dale and Michael Podgursky, “Returns to Seniority among Public
School Teachers,”The Journal of Human Resources, 2002,37 (4), 892–912.
Delaware and Tennessee Win First Race to The Top Grants, March 29 2010. U.S. Department of Education Press Release.
Fitzpatrick, Maria D., “Starting School at Four: The Effect of Universal
Pre-Kindergarten on Children’s Academic Achievement,” The B.E. Journal of Economic Analysis & Policy, 2008, 8 (1), 1–38.
Gabriel, Trip and Damien Cave, “Florida Governor Splits With G.O.P. on
Teacher Pay,”New York Times, April 15 2010.
Glewwe, Paul, Alaka Holla, and Michael Kremer, “Teacher Incentives,” June
2008. Unpublished Manuscript.
Hoxby, Caroline M., “The Effects of Class Size on Student Achievement: New
Evidence from Population Variation,”The Quarterly Journal of Economics, 2000, 115 (4), 1239–1285.
and Andrew Leigh, “Pulled Away or Pushed out? Explaining the Decline of
Teacher Aptitude in the United States,” The American Economic Review, 2004, 94 (2), 236–240.
Krueger, Alan B., “Experimental Estimates of Education Production Functions,” The Quarterly Journal of Economics, 1999,114 (2), 497–532.
Ladd, Helen F., “The Dallas School Accountability and Incentive Program: An
Evaluation of Its Impacts on Student Outcomes,” October 1996. Duke University. Unpublished Manuscript.
Lavy, Victor, “Evaluating the Effect of Teachers’ Group Performance Incentives on
Pupil Achievement,”The Journal of Political Economy, 2002,110 (6), 1286–1317. , “Performance Pay and Teachers’ Effort, Productivity, and Grading Ethics,” American Economic Review, 2009, 99(5), 1979–2011.
Lazear, Edward P., “Teacher Incentives,”Swedish Economic Policy Review, 2003,
10, 179–214.
Lehrer, Steven, “Estimating Dynamic Treatment Effects from Project STAR,”
2004. North American Summer Meetings 252. Econometric Society.
Moser, Petra, “How Do Patent Laws Influence Innovation? Evidence from
Nineteenth-Century World’s Fairs,”The American Economic Review, 2005, 95 (4), 1214–1236.
Muralidharan, Karthik and Venkatesh Sundararaman, “Teaching
Performance Pay: Experimental Evidence from India,” September 2009. NBER Working Paper 15323.
Podgursky, Michael J., “Teams versus bureacracies: Personnel policy,
wage-setting, and teacher quality in traditional public, charter, and private schools.,” Charter School Outcomes, 2007. Mahwah, NJ: Lawrence Erlbaum Associates.
and Matthew G. Springer, “Teacher Performance Pay: A Review,” Journal
of Policy Analysis and Management, 2007, 26 (4), 909–949.
Rivkin, Steven G., Eric A. Hanushek, and John F. Kain, “Teachers,
Rockoff, Jonah E., “The Impact of Individual Teachers on Student Achievement: Evidence from Panel Data,” The American Economic Review, 2004, 94(2), 247–252.
Solmon, Lewis, Todd White, Donna Cohen, and Deborah Woo, “The
Effectiveness of the Teacher Advancement Program,” 2006. National Institute for Excellence in Teaching.
TAP Evaluation and Compensation Guide, 2010. National Institute for Excellence in Teaching.
Torres, Kristina, “Teacher jobs evaluation bill sent back to committee despite
Appendix 1: Calculating TAP Bonuses
In this section, I present an explicit example to demonstrate how TAP performance awards are calculated. For the sake of simplicity, consider a school with just five teachers, all of whom have individual value-added data. Suppose these teachers earn the following scores for the three components of their awards:
Table 12: Scores for Example Calculations
Instructional Teacher School Evaluations Value-Added Value-Added
Teacher A 2 2 3
Teacher B 2.5 3 3
Teacher C 3 3 3
Teacher D 3 4 3
Teacher E 4.5 5 3
Note that instructional evaluation scores are rounded to the nearest 0.5, and all teachers have the same school value-added score. If the school allocates $3,000 in bonus funding for each teacher, then a total of $15,000 will be available for awards. As discussed in the Background section, 50 percent of this pool will be used for instructional evaluation awards, 30 percent for teacher value-added awards, and 20 percent for school value-added awards.
I begin by calculating the instructional evaluation awards. As Table 13 indicates, each teacher’s score corresponds to a “pay ratio.” Pay ratios are used to weight scores so that teachers with higher scores earn larger shares of the award pool. Notice that the pay ratios are 0 for all scores less than 2.5 because 2.5 is the minimum qualifying score for an instructional evaluation bonus. To obtain the last column, multiply each score’s pay ratio by the number of teachers with that score. The “Total Shares” value is the sum of the values in this column. It indicates that a total of 10 shares will be paid for instructional evaluation bonuses. Half of the total pool is reserved for these bonuses, so each of the 10 shares is worth $750. Teachers C and D earned two shares
Table 13: Computing Instructional Evaluation Awards
Score # of Teachers Pay Ratio # of Teachers× Pay Ratio
1 0 0 0 1.5 0 0 0 2 1 0 0 2.5 0 1 0 3 2 2 4 3.5 0 3 0 4 0 5 0 4.5 1 6 6 5 0 7 0 Total Shares 10 Pool Value $7,500 Value Per Share $750
each, so they each receive bonuses of $1,500. Teacher E earned six shares, so she receives a bonus of $4,500.
I repeat this process to determine teacher value-added bonuses. Table 14 presents the calculations for these awards. Recall that 3 is the minimum qualifying score for a teacher value-added award, so pay ratios for all scores less than 3 are 0. The pool value for these bonuses is $4,500, which is 30 percent of the total pool. As the table indicates, 18 shares have been earned, so each share is worth $250. Teachers B and C receive bonuses of $250 for earning one share, Teacher D receives $1,500 for six shares, and Teacher E receives $2,500 for 10 shares.
All teachers earn the same share of the their school’s value-added bonus. Table 15 indicates the fraction of bonus funds awarded for each value-added score. Since the school in this example earned a score of 3, it distributes 50% of the funds reserved for school value-added bonuses. The five teachers split these $1,500 evenly, so each teacher earns an additional $300 in school value-added awards.
I summarize the bonuses paid to each teacher in Table 16. These results highlight a few important facets of TAP’s compensation scheme. First, a teacher’s bonus may
Table 14: Computing Teacher Value-Added Awards
Score # of Teachers Pay Ratio # of Teachers× Pay Ratio
1 0 0 0 2 1 0 0 3 2 1 2 4 1 6 6 5 1 10 10 Total Shares 18 Pool Value $4,500 Value Per Share $250
depend heavily on the performance of her colleagues. High-performing instructors like Teacher E can potentially earn large individual bonuses if their fellow teachers are relatively unsuccessful. These incentives could attract high quality teachers to struggling schools where they are likely to be among a small group of bonus earners. By extension, the financial incentives for high-performing teachers to help improve the scores of low-performing teachers may be small at best. Suppose Teachers A and B were to increase their value-added scores so that the overall school value-added score became 4. Teacher E’s school-level bonus would increase to $450, but this gain would be more than offset by reductions to her individual bonuses. Granted, these reductions would be smaller in an example that included more teachers, but the underlying principle would persist. Even though teachers’ performance is measured on absolute scales, teachers’ bonuses depend on their relative performance among their colleagues. This is not to say that TAP’s compensation scheme provides teachers
Table 15: Computing School Value-Added Awards
Score Fraction of Funds Awarded Value of Funds Awarded
1 0 % 0
2 0 % 0
3 50 % $1,500
4 75 % $2,250
Table 16: Calculated Bonuses
Instructional Teacher School
Evaluations Value-Added Value-Added Total
Teacher A 0 0 $300 $300
Teacher B 0 $250 $300 $550
Teacher C $1,500 $250 $300 $2,050
Teacher D $1,500 $1,500 $300 $3,800
Teacher E $4,500 $2,500 $300 $7,300
with perverse incentives. Every teacher stands to earn more if he performs better, so TAP should encourage all teachers to improve their instruction. Still, it would be incorrect to say that TAP’s performance awards do not provide incentives for competition among teachers in the same school.
Appendix 2: State-Level Tables
Table 17: Pre-TAP Descriptive Statistics – Arkansas
# of schools = 2 Mean SD Minimum Maximum
Subject Z-Scores Reading -0.43 0.29 -0.61 0.05 Mathematics -0.22 0.17 -0.33 0.06 Race % White 61.5 35.0 4.4 82.9 % African American 26.1 42.2 0.2 94.9 % Hispanic 6.0 3.6 0.1 8.3 % Asian 3.8 2.0 0.6 5.1 % Native American 2.5 1.5 0 3.5 Economic Status
% Free Lunch Eligible 60.3 13.7 52.0 82.7 % Free or Reduced-Price 73.6 10.6 67.1 90.9 Lunch Eligible Enrollment Total Enrollment 490.0 164.6 221.6 590.8 Student-Teacher Ratio 16.3 0.3 15.9 16.4 Other % Male 48.2 3.2 43.0 50.2
Table 18: Pre-TAP Descriptive Statistics – Colorado
# of schools = 15 Mean SD Minimum Maximum
Subject Z-Scores Reading 0.20 0.85 -1.45 1.49 Mathematics 0.25 0.71 -0.90 1.37 Race % White 56.8 18.9 21.2 84.0 % African American 0.9 0.8 0.2 2.5 % Hispanic 40.2 21.0 7.2 77.9 % Asian 1.7 1.8 0.3 5.5 % Native American 0.5 0.3 0 1.2 Economic Status
% Free Lunch Eligible 17.7 12.4 2.2 41.8 % Free or Reduced-Price 23.9 15.5 3.5 51.5 Lunch Eligible Enrollment Total Enrollment 526.0 288.7 178.4 1057.3 Student-Teacher Ratio 15.1 1.4 12.0 16.8 Other % Male 52.1 2.0 47.9 57.5 % Special Education 9.5 2.5 5.5 15.1 % LEP 31.7 21.1 1.1 70.3
Table 19: Pre-TAP Descriptive Statistics – Indiana
# of schools = 11 Mean SD Minimum Maximum
Subject Z-Scores Reading -0.28 1.14 -2.84 0.77 Mathematics -0.10 1.14 -2.58 1.11 Race % White 82.6 26.6 0.3 98.2 % African American 11.6 25.2 0 99.1 % Hispanic 4.6 10.8 0.3 51.4 % Asian 1.1 1.1 0 3.5 % Native American 0.04 0.1 0 0.2 Economic Status
% Free Lunch Eligible 13.7 21.5 0.1 68.6 % Free or Reduced-Price 18.0 26.0 0.3 82.0 Lunch Eligible Enrollment Total Enrollment 437.8 188.9 159.5 671.0 Student-Teacher Ratio 18.0 2.8 12.1 22.5 Other % Male 52.7 2.6 48.7 56.9
Table 20: Pre-TAP Descriptive Statistics – Minnesota
# of schools = 19 Mean SD Minimum Maximum
Subject Z-Scores Reading -2.21 0.83 -3.08 0.24 Mathematics -1.95 0.72 -2.91 -0.03 Race % White 16.7 13.1 1.8 49.8 % African American 44.7 15.0 25.6 85.3 % Hispanic 22.8 19.7 1.1 58.9 % Asian 11.6 10.2 0.4 41.0 % Native American 4.1 3.0 0.4 12.1 Economic Status
% Free Lunch Eligible 71.7 12.7 35.2 86.6 % Free or Reduced-Price 79.2 12.2 43.7 93.5 Lunch Eligible Enrollment Total Enrollment 651.7 269.5 242.3 1284.5 Student-Teacher Ratio 16.0 2.3 12.3 23.0 Other % Male 50.9 2.5 46.1 56.9 % Special Education 13.6 3.2 9.1 19.2 % LEP 33.4 12.7 10.4 55.2
Table 21: Pre-TAP Descriptive Statistics – North Carolina
# of schools = 1 Mean SD Minimum Maximum
Subject Z-Scores Reading -0.34 — — — Mathematics -0.31 — — — Race % White 23.2 — — — % African American 51.1 — — — % Hispanic 16.7 — — — % Asian 6.2 — — — % Native American 0.3 — — — Economic Status
% Free Lunch Eligible 43.2 — — — % Free or Reduced-Price 53.1 — — — Lunch Eligible Enrollment Total Enrollment 931.3 — — — Student-Teacher Ratio 13.8 — — — Other % Male 49.1 — — —
Table 22: Pre-TAP Descriptive Statistics – Ohio
# of schools = 12 Mean SD Minimum Maximum
Subject Z-Scores Reading -2.03 0.48 -2.91 -1.07 Mathematics -1.87 0.38 -2.47 -1.15 Race % White 20.2 23.8 0.5 73.3 % African American 72.5 25.6 13.9 98.5 % Hispanic 3.4 5.7 0.04 20.8 % Asian 1.4 1.3 0.1 4.7 % Native American 0.2 0.2 0 0.6 Economic Status
% Free Lunch Eligible 70.6 12.2 47.4 92.5 % Free or Reduced-Price 76.7 11.2 55.4 96.1 Lunch Eligible Enrollment Total Enrollment 450.8 119.5 243.3 604.0 Student-Teacher Ratio 17.7 2.3 15.0 23.3 Other % Male 51.1 2.4 45.7 54.2 % Special Education 18.7 4.3 6.3 24.4 % LEP 4.5 7.4 0 28.0 % Gifted 14.5 7.7 1.9 23.9
Table 23: Pre-TAP Descriptive Statistics – Pennsylvania
# of schools = 9 Mean SD Minimum Maximum
Subject Z-Scores Reading -1.97 0.27 -2.43 -1.49 Mathematics -2.09 0.28 -2.53 -1.29 Race % White 0.1 0.2 0 0.7 % African American 91.6 19.8 10.4 99.8 % Hispanic 7.9 19.6 0.1 88.7 % Asian 0.2 0.3 0 0.9 % Native American 0.03 0.04 0 0.1 Economic Status
% Free Lunch Eligible 44.4 19.0 0 71.2 % Free or Reduced-Price 50.8 22.2 0 87.1 Lunch Eligible Enrollment Total Enrollment 538.9 195.7 207.3 817.5 Student-Teacher Ratio 18.0 1.9 14.4 21.0 Other % Male 44.5 5.5 35.2 51.6 % Special Education 12.4 4.2 8.5 23.7 % LEP 1.9 7.7 0 35.5
Table 24: Pre-TAP Descriptive Statistics – South Carolina
# of schools = 46 Mean SD Minimum Maximum
Subject Z-Scores Reading -1.44 0.92 -3.08 0.91 Mathematics -1.36 0.92 -2.87 0.69 Race % White 29.0 21.2 0.2 97.9 % African American 66.9 22.3 0.3 99.3 % Hispanic 2.4 3.0 0 16.4 % Asian 0.7 0.1 0 4.9 % Native American 0.9 3.0 0 16.3 Economic Status
% Free Lunch Eligible 70.4 13.0 38.8 90.0 % Free or Reduced-Price 78.8 11.7 54.3 95.3 Lunch Eligible Enrollment Total Enrollment 519.0 143.3 134.7 799.5 Student-Teacher Ratio 13.7 1.4 9.9 16.1 Other % Male 51.7 1.9 40.3 56.8 % Special Education 10.0 3.6 0.5 16.0 % LEP 2.1 3.1 0 16.0
Table 25: Pre-TAP Descriptive Statistics – Tennessee
# of schools = 4 Mean SD Minimum Maximum
Subject Z-Scores Reading -0.36 0.21 -0.79 -0.11 Mathematics -0.33 0.16 -0.58 -0.12 Race % White 64.3 14.1 36.5 80.0 % African American 28.5 9.2 17.6 46.0 % Hispanic 5.6 4.6 1.6 17.0 % Asian 1.5 1.5 0.4 4.9 % Native American 0.2 0.1 0.1 0.2 Economic Status
% Free Lunch Eligible 55.5 14.3 35.9 70.9 % Free or Reduced-Price 62.2 12.6 45.7 79.6 Lunch Eligible Enrollment Total Enrollment 685.0 235.1 270.8 879.8 Student-Teacher Ratio 15.7 1.9 13.4 18.2 Other % Male 34.8 2.2 33.1 40.5
Table 26: Pre-TAP Descriptive Statistics – Texas
# of schools = 29 Mean SD Minimum Maximum
Subject Z-Scores Reading -0.84 0.49 -1.60 0.36 Mathematics -0.85 0.53 -1.92 0.51 Race % White 19.4 15.7 1.9 80.5 % African American 28.2 26.5 0.4 89.5 % Hispanic 51.3 22.9 8.4 93.4 % Asian 1.0 1.4 0 6.0 % Native American 0.2 0.3 0 2.1 Economic Status
% Free Lunch Eligible 59.9 17.8 0 90.9 % Free or Reduced-Price 70.6 17.5 0 96.8 Lunch Eligible Enrollment Total Enrollment 620.2 199.0 57.5 969.6 Student-Teacher Ratio 14.2 2.0 4.5 20.5 Other % Male 52.0 3.1 48.3 74.6 % Special Education 5.6 2.2 1.3 15.8 % LEP 4.4 3.8 0.08 14.1 % Gifted 7.3 2.8 0.3 15.8
T able 27: State Ac hiev emen t Examinat ions State Examination Grades T ested Av ailable Y ears Ark ansas Augmen ted Benc hmark Exams 3 -8 2005 -2009 Colorado Colorado Studen t Assessmen t Program 3 -10 20 02 -2009 Indiana Indiana Statewide T esting for Educational Progress 3 -10 2000 -2009 Minnesota Minnesota Comprehensiv e Assessmen t (I and II) 3 -11 2001 -2009 North Carolina North Carolina End-of-Grade T ests 3 -8 2003 -2009 Ohio Ohio Ac hiev emen t T ests 3 -8 2004 -2009 Ohio Graduation T ests 10 2005 -2009 P ennsylv ania P ennsylv ania System of Sc ho ol Ass essme n t 3 -11 2004 -2009 South Carolina P almetto Ac hiev em en t Chall enge T ests 3 -8 2001 -2008 P almetto Assessmen t of St ate Standards 3 -8 2009 T ennessee T ennessee Compre hensiv e Assessmen t Program 3 -10 2004 -2009 T exas T exas Assessmen t of Kno wledge and Sk ills 3 -11 2003 -2009