Centre for Research and Analysis of Migration Department of Economics, University College London Drayton House, 30 Gordon Street, London WC1H 0AX
Discussion Paper Series
CDP No 05/11
Migration and Education
Centre for Research and Analysis of Migration
Department of Economics, Drayton House, 30 Gordon Street, London WC1H 0AX Telephone Number: +44 (0)20 7679 5888
Facsimile Number: +44 (0)20 7679 1068
CReAM Discussion Paper No 05/11
Migration and Education
Christian Dustmann* and Albrecht Glitz†
* CReAM, University College London † CReAM, Universitat Pompeu Fabra
Non-Technical Abstract
Sjaastad (1962) viewed migration in the same way as education: as an investment in the human agent. Migration and education are decisions that are indeed intertwined in many dimensions. Education and skill acquisition play an important role at many stages of an individual’s migration. Differential returns to skills in origin- and destination country are a main driver of migration. The economic success of the immigrant in the destination country is to a large extent determined by her educational background, how transferable these skills are to the host country labour market, and how much she invests into further skills after arrival. The desire to acquire skills in the host country that have a high return in the country of origin may also be an important reason for a migration. From an intertemporal point of view, the possibility of a later migration may also affect educational decisions in the home country long before a migration is realised. In addition, the decisions of migrants regarding their own educational investment, and their expectations about future migration plans may also affect the educational attainment of their children. But migration and education are not only related for those who migrate or their descendants. Migrations of some individuals may have consequences for educational decisions of those who do not migrate, both in the home and in the host country. By easing credit constraints through remittances, migration of some may help others to go to school. By changing the skill base of the receiving country, migration may change incentives to invest in certain types of human capital. Migrants and their children may create externalities that influence educational outcomes of non-migrants in the destination country. This chapter will discuss some of the key areas that connect migration and education.
Keywords: Migration, Education, Human Capital, Return Migration, Immigrant Selection,
1
Migration and Education
Christian Dustmann and Albrecht Glitz
1Handbook of the Economics of Education, Vol. 4
Edited by E. A. Hanushek, S. Machin and L. Woessmann
Abstract: Sjaastad (1962) viewed migration in the same way as education: as an investment in the human agent. Migration and education are decisions that are indeed intertwined in many dimensions. Education and skill acquisition play an important role at many stages of an individual’s migration. Differential returns to skills in origin- and destination country are a main driver of migration. The economic success of the immigrant in the destination country is to a large extent determined by her educational background, how transferable these skills are to the host country labour market, and how much she invests into further skills after arrival. The desire to acquire skills in the host country that have a high return in the country of origin may also be an important reason for a migration. From an intertemporal point of view, the possibility of a later migration may also affect educational decisions in the home country long before a migration is realised. In addition, the decisions of migrants regarding their own educational investment, and their expectations about future migration plans may also affect the educational attainment of their children. But migration and education are not only related for those who migrate or their descendants. Migrations of some individuals may have consequences for educational decisions of those who do not migrate, both in the home- and in the host country. By easing credit constraints through remittances, migration of some may help others to go to school. By changing the skill base of the receiving country, migration may change incentives to invest in certain types of human capital. Migrants and their children may create externalities that influence educational outcomes of non-migrants in the destination country. This chapter will discuss some of the key areas that connect migration and education.
Keywords: Migration, Education, Human Capital, Return Migration, Immigrant Selection, Second-generation Immigrants
1 We would like to thank Jérôme Adda, Andrew Mountford, Ian Preston and Yoram Weiss for helpful
comments, and Andrew Aitken, Gianandrea Lanzara, Anna Raute and Anna Rosso for excellent research assistance.
2 Table of Contents
1. Introduction ... 4
2. Empirical Evidence ... 7
2.1 Educational Attainment of Migrants ... 7
2.2 Migration and Acquisition of Education ... 13
2.3 Return Migration ... 17
2.4 The Next Generation ... 20
3. The Migrant ... 23
3.1 The Migration Decision and Human Capital Investment... 23
3.2 A Simple Model of Return Migration and Investment in Human Capital ... 26
3.2.1 Skill Enhancement and Return Decisions of Migrants ... 28
3.2.2 Skill Investment in the Home County ... 31
3.2.3 The Migration Decision ... 32
3.3 Implications of the Model ... 33
3.3.1 The Optimal Investment in Skills and the Optimal Migration Duration ... 33
3.3.2 Permanent Migration ... 34
3.3.3 Temporary Migration ... 36
3.3.4 Choosing the Optimal Migration Period and Investment in Human Capital ... 37
3.3.5 Choosing the Optimal Investment in Learning in the First Period ... 40
3.4 Empirical Studies ... 43
3.4.1 Assimilation and Adaptation ... 43
3.4.2 Extensions of the Basic Approach ... 48
3.4.3 Return Migration ... 53
3.4.4 Language ... 56
3.4.5 Downgrading and Ethnic Networks ... 62
3
4. The Effect of Migration on the Skill Base and Educational Attainment of Non-Migrants . 66
4.1 The Selection of Migrants ... 67
4.1.1 A Multiple Skill Model of Migrant Selection ... 69
4.1.2 Skill Prices, Productive Capacity and Selection ... 75
4.1.4 Explaining Different Selection Patterns ... 77
4.2 Selection and Return Migration ... 82
4.3 Learning, Multi-Dimensional Skills, and Return Migration ... 84
4.4 Empirical Studies ... 90
4.4.1 Emigration and Human Capital Investment in the Sending Country ... 90
4.4.2 Immigration and Human Capital Investment in the Receiving Country ... 95
5. The Children of Immigrants ... 98
5.1 Immigrants and Intergenerational Mobility ... 101
5.2 A Model of Intergenerational Mobility of Immigrants ... 105
5.3 Empirical Evidence ... 109
5.3.1 Schooling Outcomes of Immigrant Children ... 110
5.3.2 Intergenerational Transmission of Human Capital ... 113
5.3.3 Intergenerational Transmission and Language ... 117
5.3.4 Intergenerational Transmission and Ethnic Networks ... 118
6. Conclusion ... 120
4
1. Introduction
Starting with homo erectus about 2 million years ago, the first humans were organised in groups of hunters and gatherers. These groups were nomadic, and the economic foundation of their existence was making migrations a necessity, forcing them to move continuously according to food supplies. Constant migration was the normality. Today, populations that pursue a nomadic lifestyle are the exception. The abandonment of the hunting and gathering lifestyle by humans about 10,000 years ago, when this lifestyle was replaced by agriculture, changed the technology of subsistence production. It led to social and political structures that built on non-nomadic forms of economising. If migrations took place nevertheless, then for two main reasons: either because people were forced to move by natural disasters or man-made circumstances (such as persecution due to distinct political or religious views), or because economic prospects seemed more favorable in other regions. Immigrant-receiving countries today draw distinctions between these two different motives for movement. The Geneva Convention of 1951 defines a refugee as any person “who owing to a well-founded fear of being persecuted for reasons of race, religion, nationality, membership of a particular social group or political opinion, is outside the country of his nationality and is unable or, owing to such fear, is unwilling to avail himself of the protection of that country – or return to it”. Its signatories committed to not sending an individual back into a situation of possible persecution. According to United Nations figures, 7.1 percent of all international migrants in
2005 are refugees from their countries of origin.2
2 Source: United Nations, Department of Economic and Social Affairs, Population Division. International
5
In this chapter, we will deal mainly with migrations due to the second motive: movements that are due to individual decisions based on some optimising considerations. We will focus our discussion on international migrations, although much of what we discuss also
holds for migrations within national borders.3 Deliberate migrations are driven by economic
motives and considerations, and can therefore be subjected to economic analysis and investigation. Hicks noted in his Theory of Wages in 1932 (p. 76) that it is differences in net economic advantages, chiefly differences in wages, [that] are the main causes of migration.
Education, in turn, is a main determinant of wages, both in the country of origin and
the potential destination country.4 Although the decisions about how much education to
obtain and whether to migrate are often sequential, individuals may in many cases make these choices simultaneously, choosing education at home with a view to migrating later. Once migrated, choices about skill acquisition in the host country are crucial for the economic pay-off of the migration decision. These investment decisions are, in turn, related to future migration plans and therefore the forms that migrations take over the individuals’ life cycles. Furthermore, acquisition of education may be the sole reason for a migration – student migrations are an example. Some countries, such as the U.S., the UK and Australia, are established “learning centres”, offering educational products to an international market. The acquisition of skills abroad that are more productive at home may also take place on the job – for instance through the acquisition of language skills or learning of particular production technologies. Thus, individual migration decisions and decisions about educational
3
We follow the convention in most of the literature in economics, and define an “immigrant” as an individual that resides and works in a country other than the country where he/she was born. This is the standard definition of immigrants in the Anglo-Saxon countries; however some countries (like Germany) define immigrants based on nationality rather than country of birth.
4 We will use the terms country of destination and host country, and the terms country of origin and home
6
attainment are strongly intertwined, and we will shed light on this relationship in the third section of the chapter.
But migrations may also affect educational attainments of those who do not choose to move, both in the destination and the origin countries. Migrations may lead to a change in the skill base of both sets of countries, affecting average levels of education and possibly generating educational externalities and new incentives for human capital investments. For instance, if immigration is selective in the sense that only better able individuals move, then this may enhance the skill base in the destination country, while it may deplete the skill base in the country of origin, with consequences for the populations of those who have chosen not to move. However, there may be situations where migration enhances the skill base of both countries. Immigration may lead to a specialisation of non-migrant workers in the destination country in areas where they have a competitive advantage. It may also lead to an improvement of the economic situation of migrants’ families, for instance through remittances, thus enabling children to attend school instead of working. Remittances may also help to create educational infrastructures that foster educational attainment of those who do not have family members who migrate. We will discuss immigrant selection and the interrelation between migration and education of those who do not move in the fourth section of this chapter.
Finally, migration is a long-term process, with many immigrants bringing their children with them or founding families in their host countries. In this context, it is important to understand how the children of immigrants are accommodated by the host country’s education system and how they perform in it relative to native children? What is the role intergenerational transmission of human capital plays for the longer run integration process and how does it affect the immigrants’ long-term convergence to the native population? These are key questions in the current debate about immigration, in particular in those
7
countries that only recently received large immigrant populations. We will discuss the educational achievement of the children of immigrants and their intergenerational mobility in the fifth section of this chapter.
There are therefore three related cornerstones to this chapter. These cover the key economic aspects of the individual migration decision, their connection to education and skill selection of immigrants, and the nature of intergenerational spillovers. The analysis of these three cornerstones provides a comprehensive overview of the economic connections between migration and education.
Before considering these three inter-related areas in detail, we begin in Section 2 by setting the scene with the presentation of some empirical evidence about immigrant populations in OECD countries, their educational attainment, their labor market performance, and how they compare to natives and to those in their home countries who decided not to move. We will demonstrate the large diversity of immigrant populations in different countries, which is often due to historical reasons, such as colonial pasts, historical trade links, or particular recruitment policies at earlier points in time. At the same time, the descriptive evidence we present shows many common features across populations of immigrants in different destination countries. Some of these features we will return to later in the individual sections that deal with the migrant, the non-migrants, and the children of immigrants where we will embed them into a more structural framework. In order to ensure comparability, we focus on OECD countries for which detailed and standardised data are available.
2. Empirical Evidence
8
When thinking about the educational attainment of migrants, two points of reference naturally come to mind, the educational attainment of the migrants relative to the native population in the destination country, and the educational attainment of the migrants relative to their compatriots who remained in their country of origin. To provide an overview, Table 1a shows the educational attainment of the foreign-born (FB) population in the 10 most
important immigrant receiving OECD countries around the year 2000.5 These 10 countries
together host 86 percent of the around 76 million foreign-born individuals aged 15 and older that live in one of the 28 OECD countries for which data are available (data for Chile and Iceland are not available). Not surprisingly, given the heterogeneity in countries of origin and migration policies in place, there is substantial variation in the educational composition of the foreign-born population across destination countries. In Canada, for example, only 22 percent of the foreign-born aged 25-64 report lower secondary education (“low education”) as their highest educational attainment, while in France, Italy and Spain about 50 percent of the foreign-born have at most completed lower secondary education. At the other end of the educational spectrum, the share of foreign-born individuals with tertiary education (“high education”) exceeds 30 percent in Australia, Canada, the UK and the U.S., whereas in Germany and Italy, this share is below 20 percent. The composition of the foreign-born population in terms of their educational attainment becomes particularly relevant when seen in relation with the educational attainment of the native-born population (NB). Based on such comparisons, one can broadly divide the OECD destination countries into a group
5 We report OECD data for the year 2000, as these are the most recent ones that include comparable information
on educational attainment. With the exception of Germany and France, the overall stocks of migrants have further increased across the OECD countries listed in Table 1a between the year 2000 and 2008, with an overall growth rate of approximately 37 percent (based on data from the International Migration Database). The most noticeable change over this period took place in Spain where the foreign-born population more than tripled to around 6.4 million in 2008. However, with the exception of Japan, whose stock of foreign workers increased particularly fast in this period, the countries listed in Table 1a remain the main OECD destination countries also in 2008.
9
characterised by a high-skilled foreign-born population consisting of Australia, Canada, and the UK, and a group characterized by a low-skilled foreign-born population consisting of France, Germany, the Netherlands, Switzerland, and the U.S., with Spain’s and Italy’s foreign- and native-born populations showing relatively comparable educational structures. For example, in Australia, Canada and the UK, the share of the foreign-born population with high education exceeds the share of the native-born population with high education by 5.5 percentage points, 7.3 percentage points and 16.1 percentage points, respectively. On the other hand, in France, Germany and the U.S., the share of the foreign-born population with low education exceeds the share of the native-born population with only low education by
14.6 percentage points, 25.5 percentage points and 22.8 percentage points, respectively.6
[Table 1a: Educational Attainment of Immigrants in receiving countries]
But the relative educational attainment of the foreign-born in their destination countries is only one side of the coin. The other natural comparison group consists of the migrants’ compatriots who have remained in their country of origin. Table 1b provides some evidence for the 11 biggest immigrant-sending countries within the group of OECD
countries.7 Though again subject to substantial variation, a prominent feature in these figures
6 For a detailed analysis of worldwide international mobility by educational attainment, see Docquier and
Marfouk (2006).
7 The figures are constructed from OECD data by aggregating across all OECD countries all foreign-born by
country of origin, restricting the sample of origin countries to OECD countries, and then selecting the 11 countries from which the largest number of foreign-born individuals originated. Since not all potential countries of origin are separately recorded for each OECD country, this is not entirely accurate, but, given that for each OECD country the most important countries of origin are separately reported (and often many more), this procedure should correctly pick up the 11 biggest OECD immigrant-sending countries. Of course there are additional important non-OECD countries of origin such as (in descending order) China, India, the Philippines, Russia, and Vietnam for which, however, we do not observe the educational attainment of the population in the home country in the OECD data.
10
is that for the majority of origin countries, the share of movers with high education is substantially larger than the share of stayers with high education. For example, while about 23 percent, 22 percent, and 34 percent of the native-born British, French, and Americans still living in their country of birth have high education (Column (7)), the corresponding shares among the group of those who left these countries are 40 percent, 40 percent and 61 percent (Column (4)), respectively. It appears that for these countries of origin, the better-educated individuals are the more mobile ones. However, for other countries the picture looks different. For example, for Mexico, the main source country of U.S. immigration, the share of movers with only low education is relatively similar to that of the stayers (around 70 percent), whereas the share of movers with high education (around 7 percent) is significantly lower than in the group of stayers (15 percent). Turkey, which is the main country of origin for Germany, and Portugal exhibit similar patterns. For these countries, those who decide to emigrate appear to come predominantly from the middle of the educational spectrum.
[Table 1b: Educational Attainment of Emigrants in Sending Countries]
The aggregate figures in Table 1a and Table 1b conceal the substantial variation in immigrants’ educational attainment that exists across origin countries for any given destination country (Table 1a) and across destination countries for any given origin country (Table 1b). Focusing on the former, Table 2 shows for each of the 10 main immigrant-receiving OECD countries the foreign-born populations with the highest and lowest educational attainment. For instance, looking at the last row of the table, of all the main countries of origin of immigration to the U.S., the foreign-born originating from Mexico are the least well educated with about 69 percent having only low education (Column (3)). On the other hand, the most highly educated group in the U.S. are Indians of whom around 75
11
percent have high education (Column (8)). For Germany, the country of origin with the highest share of immigrants with only low education is Turkey with 73 percent (Column (3)), compared to French immigrants of whom only 9.8 percent have low education (Column (1)). The (unweighted) standard deviations reported in Columns (5) and (10) provide a summary measure of the extent of educational heterogeneity of each countries’ immigrant population across different countries of origin, showing that in many cases a given destination country attracts immigrants with high educational background from some countries, but with poor educational background from other countries.
[Table 2: Variance/Min/Max of Share of Tertiary/Primary Education, by Country of Immigration/Country of Origin]
Table 3 shows for each of the 11 main immigrant-sending countries in the OECD the destination countries that receive the highest and the lowest educated group of its emigrating population. For instance, looking at the first row of the table, only 5.0 percent of all Mexicans living in Sweden have low education (Column (1)), whereas this is the case for 69.0 percent of all Mexicans living in the U.S. (Column (3)). Similarly, only 7 percent of Poles living in the Czech Republic have high education (Column (6)) whereas the corresponding share in the UK is 48.7 percent (Column (8)). Clearly, highly heterogeneous subgroups of individuals from a given country of origin decide to move to specific host countries, as again summarised by the standard deviations reported in Columns (5) and (10). We will discuss possible reasons for these differences below.
[Table 3: Educational Attainment of same origin group in different destination countries]
12
The educational attainment of the foreign-born population serves as a key indicator of their performance in the host country’s labour market. However, even if the foreign-born population in a given host country is as well educated as the native-born population in terms of the level of formal qualification or completed years of schooling, they are unlikely to perform equally well in the labour market. The educational skills immigrants bring with them may not be easily transferable to the host country labour market (e.g. due to language deficiencies), and a highly skilled immigrant is unlikely to command the same wage as a native-born worker with the same educational background, at least in the first years after arrival.
We illustrate this in Column (1) of Table 4, which shows the median wage of the foreign-born relative to the median wage of the native-born in a selected set of OECD destination countries. Columns (2) to (4) show the corresponding wage ratios separately by education group. With the exception of Australia, the foreign-born earn overall less than the native-born, in particular in the U.S. where the median wage gap amounts to 21 percent. While in the lowest education group, immigrants tend to earn slightly more than comparable natives (with the exception of France and Sweden), they earn substantially less than natives in the medium- and high-education group. In Canada, France and Portugal, for example, immigrants with high education earn at least 10 percent less than natives with high education. Overall, wages of immigrants seem to rise more slowly with educational attainment than wages of natives, suggesting that immigrants face a lower return to schooling in the host country than natives do.
Columns (5) to (8) focus on the high education group and show relative wages of foreign-born men and women with high education, now distinguishing between individuals that received their tertiary education in their home country and those that received it in the host country. The difference between the relative returns reported here thus addresses, at least
13
in part, the issue of transferability of human capital from the origin to the destination
country.8 The less transferable the skills acquired in the home country, the lower their return
relative to the return obtained from domestically acquired tertiary education. With the exception of men in France and Australia, the figures show that wages are always higher for foreign-born graduates with host country specific tertiary education, in some cases even exceeding the wages earned by native-born graduates with tertiary education.
[Table 4: Relative Median Wage, by country and education level]
2.2 Migration and Acquisition of Education
As pointed out in the previous section, it is important to distinguish between education acquired in the home country before migrating, and education acquired in the host country. In particular minors, who arrive together with their parents, and young adults, who immigrate to attend one of the host country’s universities, add to their existing stock of human capital by acquiring further formal host country specific education. With education being a tradable good, some countries have specialized in its production. For instance, Australia’s third largest export article (after coal and iron ore) is international education.9
8 While a lack of transferability of human capital will be necessarily reflected in lower relative wage ratios, it
cannot be easily distinguished from differences in the quality of education obtained because of different educational systems and institutions in the origin and destination countries. Although the OECD data reported in Tables 1 to 4 are based on the International Standard Classification of Education (ISCED 1997) which, in principle, is based on the educational content of the programmes assessed rather than institutional idiosyncrasies, an accurate and consistent measurement of actual educational achievements across different countries remains difficult (see also Hanushek and Zhang, 2009).
9 In 2007/08, international education contributed 13.7 billion AUD to the Australian economy, measured
through export earnings, which is the sum of international student expenditure on tuition fees, goods and services related to living in Australia and tourism associated with visits from relatives (see http://www.idp.com/research/statistics/education_export_statistics.aspx).
14
This specialisation in the provision of educational services is apparent from Table 5, which shows for the 10 biggest immigrant receiving OECD countries the share of foreign students enrolled in tertiary education. Across all destination countries, foreign students constitute a significant fraction of the student population, with their share often exceeding 10 percent. In Switzerland and the UK, about one in five students is a foreign student, a fraction that increases further to around 45 percent when restricting attention to advanced research programs such as doctorates. In terms of absolute numbers, the UK and the U.S. are the two main destination countries for foreign students, hosting around 460 and 620 thousand students in 2008, respectively. Column (4) in Table 5 shows by how much the number of foreign students in tertiary education has changed over the decade between 1998 and 2008. Across the board, foreign student numbers have increased substantially. This is not only true in countries that started from a relatively low base such as Italy and the Netherlands (where student numbers increased by 160 percent and 200 percent, respectively) but also in countries that were already popular destinations in 1998 such as Australia, the UK and the U.S. (where numbers increased by 111 percent, 121 percent and 45 percent, respectively). Overall, in the ten OECD countries listed in Table 5, the number of foreign students increased by 80.8 percent between 1999 and 2008 which, given an increase in the corresponding overall stock
of immigrants over the same period of around 42.5 percent10, indicates that the acquisition of
formal education in foreign countries is not only a widespread phenomenon, but one that has also been rapidly gaining importance in recent years.
10
The calculation of this figure is based on data from the International Migration Database and refers to the change of the sum of the foreign-born population in Australia, Canada, France, the Netherlands, Spain, and the U.S. and the population with foreign citizenship in Germany, Italy, Switzerland and the UK between 1999 and 2008. The missing immigrant stocks for Canada and France were linearly extrapolated from available figures in 2001 and 2006 (Canada) and 1999 and 2006 (France).
15
The last column in Table 5 shows estimated retention rates of graduates in their host countries following the completion of their studies. While the calculation of these figures is not unproblematic (for details, see OECD, 2010), the estimates show that between 15 to 30 percent of all foreign graduates remain in their host countries after graduation, evidently to a
large extent for work purposes.11 These numbers suggest that the acquisition of education in
countries that have established themselves as “learning centres” is a main reason for migration, and that individuals choose to return to their countries of origin in order to apply the skills accumulated (see Dustmann et al., 2010a, for modeling of such migrations, and our discussion in Sections 3.2 and 4.3). Of course, these numbers may also partly be driven by regulations that do not allow individuals to remain after the completion of their studies. Indeed, in many countries, particularly in Europe, existing policies make it difficult for foreign students to stay and obtain a work permit. In recent years, the transition from study to work has been facilitated in many student destination countries, for example by enabling students to work while studying, or by extending the period granted to search for work following the completion of study (see ICMPD, 2006, for a comparative study on retention policies in a large number of industrialised countries). For instance, several countries have recently started to issue a special residence permit to foreign graduates for the purpose of seeking a job, including the UK (for one to two years, introduced in 2004/2005), Germany
(for one year, introduced in 2005) and France (for 6 months, introduced in 2006).12 Other
special provisions introduced to facilitate the transition from study to work for foreign
11 Retention rates are calculated as the number of international students who change their legal migration status
between 2006 and 2007, for example from “student” to “work” or to “family formation”, divided by the number of international students who do not renew their student permit. On average 61 percent of international students change their status for work-related reasons (OECD, 2010).
12 While in France and Germany these jobs have to correspond to the graduate’s qualification and are subject to
labour market testing, permit holders in the UK are free to take up any employment they like. Contrary to the U.S. and Canada, the applicants in these countries do not already need to have a job offer at hand.
16
graduates include the allocation of extra points for a degree from a national institution of higher education (Canada, Australia and New Zealand), a waiver of an obligatory work experience record (Australia and the Czech Republic), the exemption from the regular quota for “key workers” (Austria), and a specific category with a special quota for foreign graduates (Australia, Italy, U.S.). These policy changes are a reflection of the increasing global competition in attracting and retaining highly skilled workers. Kato and Sparber (2010) show that students are indeed responsive to such immigration policies. Studying the effect of the sharp reduction in the number of available H-1B visas – the primary means of legal employment for college-educated foreign nationals in the U.S. – in 2003, they find that this restrictive immigration policy has had a negative impact on the quality of prospective international applicants to U.S. colleges. The intuition is that only the high ability students are affected by the new policy since low ability foreign students are unlikely to find U.S. employment even in the absence of visa quotas. Faced with a reduced prospect of gaining access to the U.S. labour market after graduation, the “best and brightest” of the global talent pool appear to choose other host countries to provide them with both valuable education and the possibility of applying this education in the local labour market.
For the U.S., which is host to the largest number of foreign students in the world, there are no overall retention rates of graduate students available. However, Finn (2007) shows that for the group of foreigners who have earned a doctorate in an American university, the retention rate five years after they received their degree is around 65-70 percent. In a cross-country comparison, this is likely to be at the upper end of the spectrum of retention rates.
17
In terms of the students’ origin, there is once again substantial heterogeneity across destination countries. Looking at Table 6, three factors appear important for the choice of students where to obtain education: geographical distance, language, and former colonial ties. For instance, the majority of students in Australia (79.3 percent) originate from Asia, and in particular from China, which supplies a quarter of all foreign students. In Europe, Italy and Switzerland are countries that attract mostly foreign students from other European countries whereas France has a large share of students from its former colonies in Africa (43.5 percent of which 25.5 percent are from Morocco and 17.7 percent from Algeria), and Spain has a relatively large share of students from Spanish-speaking South America (40.7 percent of which 21.4 percent are from Colombia and 16.7 percent from Peru). In the two biggest student-receiving countries, the UK and the U.S., most foreign students originate from Asia (39.5 percent and 67.2 percent, respectively, of which 28.1 percent and 26.3 percent are from China).
Figure 1 shows the development of the overall number of foreign students studying in the 10 main OECD destination countries listed in Table 5 between 1999 and 2008. There is a clear upward trend, in particularly from 2001 onwards, with student numbers increasing from a little more than 1.2 million in 1999 to more than 2.2 million in 2008. Most of this increase is driven by increasing numbers of students from Asia and, to a lesser extent, Europe and Africa. Although we cannot tell from these data whether these students came to their destination countries for the sole purpose of studying, or whether they already arrived as young children with their parents and are expecting a more permanent stay, the important role of many destination countries in providing education to non-citizens is clearly discernible.
[Table 6: Origin of foreign students]
18
The figures in the previous section suggest that many migrations today are undertaken for the purpose of acquiring education. According to the International Passenger Survey, for example, about 40 percent of all migrants arriving in the UK in the year 2009 cited as their main reason for migration the desire to pursue formal studies, up from around 23 percent in the year 2000. Migrations of this type are likely to be temporary. But temporary migrations are a more general phenomenon and widespread also among classical labour migrations. There are about 2.5 million temporary workers arriving in the OECD countries per year, mostly seasonal workers and young working holiday-makers with work permits for a duration of less than one year (OECD, 2008). The temporary character of these migrations has important implications for the type of immigrants’ educational attainments and their investments in human capital as we will see in Section 3.3. While until recently the analysis of immigrants’ earnings and human capital investments has largely assumed migrations to be permanent, modern migrations seem to be characterized by different patterns. Indeed, numbers suggest that a large fraction of the foreign-born population will at some point return to their home country.
One way to study the time dimension of migration is to look at the duration of stay in the host country. Columns (1) to (3) of Table 7 show the share of the foreign-born population in the main OECD destination countries that have been in their host country for less than 5 years, more than 10 years, and more than 20 years. Clearly these cross-sectional figures can only be indicative of the temporary nature of migrations since, for example, a high share of short durations could be either due to actual short migration durations or due to a large number of very recent arrivals (as, for example, in the case of Italy and Spain). However, with the exception of France, the share of migrants that have already been living in their host countries for more than 20 years (and could therefore be considered as permanent) does hardly ever significantly exceed 50 percent. In the U.S., for example, only 35.7 percent of the
19
foreign-born population has already lived in the country for more than 20 years. As these figures may be driven by changing cohort sizes of the inflows of immigrants, it is useful to look at the outflows of the foreign populations from their host countries. Column (4) in Table 7 shows the outflow/inflow ratio of foreign nationals over the period 1998 and 2008. This ratio ranges from 9.8 percent in Australia, over 51.3 percent in Switzerland, to 86.0 percent in Germany. This suggests that there are indeed significant flows of foreign individuals out of their host countries. These out-migrations may be back to the countries of origin, but could also be to an alternative host country. Outflow/inflow ratios are still only a crude measure of return migration, as they do not necessarily relate to the same individuals. For a more precise measure, one requires data that follow immigrant entry cohorts over time. Column (5) in Table 7 provides some estimates of the share of foreign-born individuals that re-emigrate from their host country within the first 5 years of arrival. The estimates show the generally substantial extent of re-emigration, ranging from 19.1 percent in the U.S. to 39.9 percent in
the UK.13 Evidently, relatively short migration spells are a widespread phenomenon and,
although the destination of the re-emigrating population is generally not observable, one can
assume that a large fraction constitutes return migration to the country of origin.14 As we will
see later, this particular migration pattern has important implications for an immigrant’s
13 The OECD also provides corresponding re-emigration rates for Ireland (60.4 percent), Belgium (50.4 percent)
and Norway (39.6 percent). Additional studies that estimate comparable 5 year re-emigration rates are Borjas and Bratsberg (1996) for the U.S. (17.5 percent), Bijwaard (2004) for the Netherlands (35 percent), Shortland (2006) for New Zealand (23 percent), Dustmann and Weiss (2007) for the UK (40 percent males, 55 percent females), Bratsberg et al. (2007) for Norway (50 percent), Jensen and Pedersen (2007) for Denmark (55 percent), and Aydemir and Robinson (2008) for Canada (23.7 percent, males).
14 Nekby (2004) is one of the few who distinguishes between return migration and secondary migration to a
third country, using data for Sweden for the period 1991 to 2000. According to her results, the share that constitutes return migration is around 90 percent for Nordic immigrants, 70 percent for Western Europeans and North Americans, 50 percent for Eastern Europeans, 40 percent for Asians, and around 30 percent for Africans. Bratsberg et al. (2007) estimate the return migration share for Norway and find similar magnitudes. Over the period 1967 to 2003, the share of those who left Norway to return to their home country is 93 percent for Danes and Swedes, 86 percent for U.S. Americans, 87 percent for UK immigrants, 78 percent for Turks, 81 percent for Iraqis, 70 percent for Somalis, and 33 percent for Vietnamese immigrants.
20
behaviour both in the host and in the home country, and therefore requires particular attention. For an informative overview of the return migration issue including a detailed description of methodological approaches to measure it, see OECD (2008, Part III).
[Table 7: Return migration (after 5 years); ratio inflow/outflow]
2.4 The Next Generation
The focus of the descriptive evidence presented so far has been on the educational attainment and investment as well as the labour market performance of the working-age immigrant population. Given that a substantial fraction of immigrants will remain in the host country for a considerable amount of time, their children, whether born in the home country before arrival or thereafter, will spend a large part or even their entire childhood in the host country, passing through its educational system and making educational investment decisions along the way. These decisions have wider consequences, not only for the performance of this next generation of immigrants in both the host and – in the case of a later return migration – the home country, but also for the host country more generally, for example through the immigrants’ impact on the fiscal balance (see, for example, Storesletten, 2000, and Dustmann et al., 2010b) or their integration prospects (see, for example, Constant and Zimmermann, 2008). Given the often substantial differences in family backgrounds and language proficiencies, it is not surprising that in many destination countries immigrant children do significantly worse at school than their native counterparts. To illustrate this, we use data from the PISA (Programme for International Student Assessment) study that provides internationally comparable measures of proficiency in reading, mathematics and science of students aged 15 in 18 OECD countries, as well as information on a large set of
21
student and school characteristics.15 Table 8 shows the raw differences in test scores in
reading and mathematics between native children and children with an immigrant background, which include both children born abroad and children born in the host country. Both in reading and in mathematics, students with an immigrant background score significantly lower than native students. With an average native score in these tests of about 500, the test score gaps are substantial with a relative magnitude of around 10 percent in a number of countries (Germany, Italy, the Netherlands, and Switzerland). The only exceptions to these patterns are Australia, Canada and, to a lesser extent, the UK, where students with an immigrant background do as well as, or better (in the case of Australia), than their native student counterparts. An obvious explanation for this heterogeneity across destination countries is the difference in socio-economic characteristics between the corresponding immigrant populations, largely driven by the selectiveness of each host countries’ migration policies. Australia, Canada, and the UK are all countries that have been applying a point system to select the immigrants they admit which strongly favours individuals with characteristics conducive to their performance in the labour market, such as education and language skills. Through the intergenerational transmission of human capital, these beneficial characteristics are likely to be reflected in their children’s performance at school. For illustration, we report the test score gaps (relative to natives) of students with an immigrant background that do not speak the language of instruction at home in Columns (3) and (4) of Table 8. In all but three cases (Canada, Italy and Spain in mathematics), these gaps are substantially larger than the gaps for the entire immigrant student population. For example, in the UK, those who do not speak English at home score 36.5 points below the native average in reading and 26.6 points below the native average in mathematics while overall the test
22
score gaps only amount to 11.5 and 14.6 points respectively. We will analyse the role language and parents’ education play in explaining the achievement gaps between immigrant and native students more systematically in Section 5.3.
[Table 8: Pisa Results]
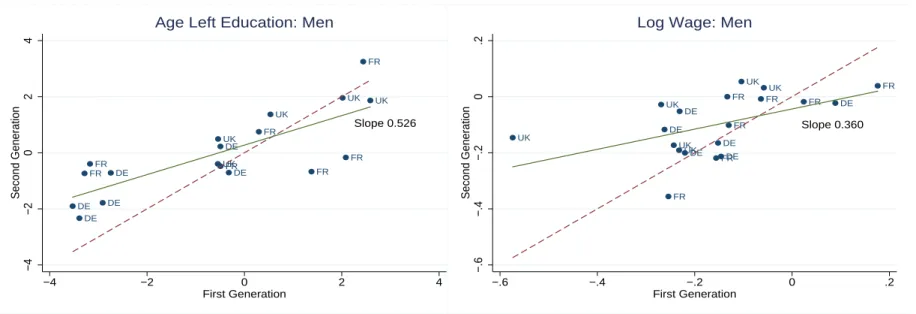
Do the lower test scores of immigrant children at age 15 carry over into their adulthood? One measure to assess this is to compare the average school leaving age of first- and second-generation immigrant adults relative to the native population. Figure 2 reproduces estimates for men obtained by Algan et al. (2010) for France, Germany and the UK using the latest available data sources. The corresponding results for women show broadly similar patterns. The differences in the average age left education shown in the left-hand side scatterplot are estimated coefficients on dummy variables for the main immigrant groups in each country, obtained from a censored linear regression. Additional controls in these regressions are a quadratic in year of birth, region dummies and time dummies. Each point represents the educational gap relative to natives of first-generation immigrants (x-axis) and second-generation immigrants (y-axis) for a particular country (or country group) of origin. For reference, we include a 45-degree line as well as a fitted linear regression line. The scatterplot shows that for those immigrant groups in Germany and France who started with the biggest disadvantage relative to natives there is some improvement in the educational attainment from one generation to the next (in the sense of a later age at which individuals leave education). However, there is still a significant difference in schooling remaining for these groups in the second generation. This persistence in educational differences between natives and immigrants translates into differences in labour market outcomes, as illustrated in the right-hand side scatterplot in Figure 2, which shows estimated relative earnings gaps, again taken from the Algan et al. (2010) study, where the only included control variables in
23
the estimated linear earnings equations are a quartic in potential experience, region dummies and time dummies. Most importantly, the regressions do not control for the differences in educational attainment illustrated in the left-hand side scatterplot. The figures show that for most immigrant groups there is some improvement in earnings from one generation to the next, in part due to the improved educational attainment. However, the majority of adult second-generation immigrants in these countries still experience a substantial wage disadvantage (of the order of 10 percent on average) relative to their native counterparts. Both scatterplots also reveal a significant correlation between first- and second-generation immigrants’ education levels and earnings. Despite some convergence, those immigrant groups that started with the biggest disadvantage relative to natives in the first generation continue to be the most disadvantaged in the second generation. We will get back to this issue in our discussion of intergenerational mobility of immigrants in Section 5.
[Figure 2: Trend Education of 2nd/1st generation immigrants, selected countries]
3. The Migrant
3.1 The Migration Decision and Human Capital Investment
In this section, we investigate the key drivers of individuals’ decisions of whether or not to emigrate, whether and when to return, and how these decisions interact with decisions about education and skill acquisition. In its simplest possible form, the migration decision is based on a comparison of expected lifetime earnings in the current region of residence and in an alternative region, to which the migrant has the possibility to emigrate. In most cases,
24
there is more than one possible destination region in the choice set of potential migrants. For
simplicity, we will abstract from that, and consider only one potential destination country.16
What are the factors that determine the emigration decision? Abstracting for the moment from amenities that arise from living in the home or potential host country, the decision problem of the potential migrant is based on the comparison of the net monetary returns of that decision. In the simplest possible model, where migrations are permanent and the acquisition of human capital is completed before the migration, these will depend on the skill prices in the origin and destination country, as well as the degree to which skills acquired in the origin country are transferable to the economy of the destination country. In a more dynamic setting, the migrant compares lifetime net discounted earnings in the two countries, allowing for the possibility that additional human capital investment is undertaken.
After migration, individuals will potentially acquire further skills in the host country. As skills obtained in the home country are not always fully transferable to the host country labour market, new immigrants should have lower earnings than natives, even when they belong to the same skill group as measured, for instance, by the years of schooling obtained. However, the subsequent transfer of existing skills, facilitated, for example, through the acquisition of complementary skills like language, and the acquisition of new skills lead to an increase in earnings, possibly at a faster rate than that of comparable native workers. A large literature has developed around measuring this process (starting with Chiswick’s 1978 seminal paper), and we will review some of this literature in Section 3.4.
As we have shown in Section 2, many migrations are temporary, with immigrants remaining for a limited amount of time in the host country, and then returning back home.
16 Papers by Dahl (2002), Grogger and Hanson (2008), Bishop (2008), Ortega and Peri (2009), Kennan (2010)
and Kennan and Walker (2010) consider the choice problem of individuals when deciding between more than one potential destination region.
25
This behaviour can be optimal despite consistently more favourable economic conditions in the destination country (see Dustmann, 2003, and Dustmann, 1994a, 1995, for an early analysis of different return motives). But if immigrants plan to return to their home countries (or to move on to a third country), then this may affect many aspects of their behaviour, including their human capital investment. In particular, any investment decisions into further skills will now depend not only on the return to these skills in the host country, but also on the return to these skills back in the home country. Differences in the expected duration of migration introduce heterogeneity into the earnings paths of immigrants that are identical in all other measurable characteristics (such as age, education, and past employment history). Thus, understanding the distinct forms of migration is key to understanding immigrants’ human capital investment behaviour.
Return decisions may be driven by preferences (if, for instance, the home country provides the migrant with amenities that are valuable itself or complementary to consumption) or purchasing power considerations (if, for instance, the host country currency has a high value in the home country). However, they may also be the outcome of an optimising strategy that consists of obtaining human capital in the destination country in order to apply it in the origin country. Examples of this type of human capital are university education or foreign language skills. In that case, return migration is the outcome of an optimal human capital investment plan over the individual’s life cycle. In addition, the possibility of a migration later in the individual’s life may already induce human capital investment in the home country. One reason may be that skills acquired at home have a high return in the host country. Another reason may be that skills acquired at home are a prerequisite for the possibility to acquire further valuable skills abroad, either directly because of minimum education requirements due to immigration policies or because of the sequential nature of skill accumulation.
26
3.2 A Simple Model of Return Migration and Investment in Human
Capital
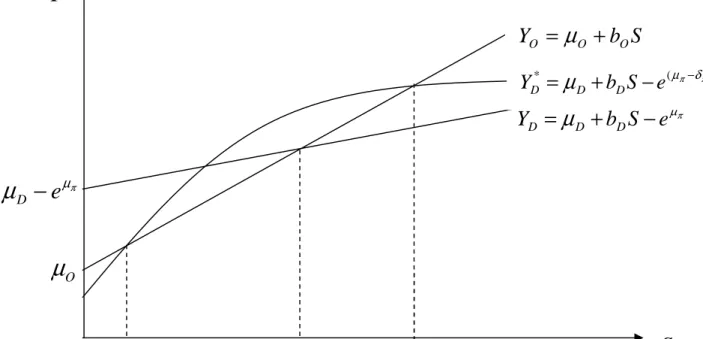
In what follows, we set up a simple model that serves to clarify some key ideas of migrants’ decision processes. The model shows how individuals reach a decision of whether or not to emigrate and how this decision is intricately linked to the human capital they accumulate over their life cycle. It illustrates how the possibility of a temporary migration affects optimal human capital investment profiles, what these profiles imply for individuals' earnings and their growth over time, and how these patterns depend on initial observable skills and ability. The model will also help us to structure the vast empirical literature that exists on migrants’ education- and skill investment decisions in their home and host countries. This literature has focussed particularly on the analysis of earnings profiles of immigrants as a reflection of their human capital investments, on how these profiles depend on the time horizon of the migration as well as the language proficiency of the migrant, and on the issues of skill transferability, skill downgrading, and the role of ethnic networks.
Figure 3: Timing of Model
Period 1 Length 1 t Period 2 Length 1 Period 3 Length T
27
Our model has essentially three periods. Life is finite and time flows continuously. The duration of life is T+2. We have illustrated the timing of the model in Figure 3. The first two periods are “learning periods”, and they are of unit length. In period 1, individuals live in the home country. In that period, individuals do not work, but can acquire education, and choose how much to acquire. Acquisition of education is costly, and individuals differ in their efficiency to acquire education. After the first period, individuals decide whether or not to
emigrate.17 In the second period, individuals live either in the home- or in the host country,
depending on whether they have chosen to emigrate after the first period. During this second period, individuals have another opportunity to acquire education. They divide their time between learning, and working in the labour market. Thus, abstracting from direct costs of education such as fees, the cost of acquiring further education is equal to the opportunity cost of forgone earnings. We think about this period as a period where post-secondary education is obtained. This may take the form of vocational training or college education. The third period has length T. If individuals decide not to emigrate after period 1, they will spend both the second and the entire third period in the home country. If individuals decide to emigrate, then they have the possibility to return to the home country either right after the second
period, or after a duration t in the host country, with t≤T. Therefore, the length of the
migration is given by t +1, and the remaining time in the home country after re-migration is
t
T− . A permanent migration corresponds to the case where t=T.
In case no migration takes place, individuals stay at home until death, which occurs at T . Although there is no explicit learning in the third period, we allow the return back in the home country of human capital acquired in the host country in period 2 to increase with the length of stay in the host country.
28
In our model, individuals make a number of choices. These choices are made at the start of the first period, and at the start of the second period. To solve the model, we first consider the decision problem at the start of the second period. In case that no migration takes place, the individual decides about the optimal investment in learning in the home country in period 2. In case a migration does take place, the individual decides about the optimal investment in learning in the host country as well as the optimal time to spend in the host country. Given these decisions, we then go back to the start of the first period, where individuals decide about the optimal investment in their education while they are still in the home country. This decision depends on the returns to any such investment in the future, given the optimal decisions about human capital investment and the duration of migration at the start of the second period. Finally, the migration decision is based on a comparison of the net present value of their lifetime earnings if migration does or does not take place.
We will first consider the decisions at the start of the second period. We will then consider the educational investment decision before a potential migration has taken place, and the migration decision itself.
3.2.1 Skill Enhancement and Return Decisions of Migrants
In case migration takes place, the individual maximises period 2 and period 3 earnings
by choosing the optimal investment in period 2, *
D
s , and the optimal time of return, *
t : (1) max ( , ) (1 ) [ ( ( , , ))] ( )[ ( ( ) ( , , ))] , X A s f t X t T X A s f X t s X t s FD D D O t s =
ω
− +ω
+ + −ω
+γ
,29
where
ω
j, j=O,D, is the rate of return to human capital X (acquired in the homecountry in period 1) in either origin country O or destination country D , s is the time
investment in human capital acquisition in the second learning period (the first period in the
host country in case of a migration), and t and T denote the time in the host country and the
total length of the last period of life, respectively. We assume throughout this section the typical case in which
ω
D >ω
O. The function f(s,A,X) translates human capital investments in the host country in the second periodinto skills, where A is the ability of the individual.
We make the following standard assumptions: fs >0, fss <0, fsA >0,
0 ) , , 0 ( , 0 = > f A X
fsX . This means that skills are produced with decreasing returns, and
that ability and the existing stock of human capital are complementary to the production of new human capital (see Ben-Porath, 1967, and, for empirical evidence of such
complementarity, Chiswick and Miller, 1994, or Friedberg, 2000). The parameter
ω
Oγ
(t) isthe rate of return to human capital, acquired in the host country, back in the home country.
Notice that γ(t) may increase with the time the migrant stays abroad after the second
learning period, which reflects the possibility that staying abroad increases immigrants’ rate of return on human capital in the home country through on-the-job learning. Note further that
if
O D
ω
ω
γ
(0)< , human capital acquired in the host country in the second period, is lessvaluable back home at the beginning of the third period than in the host country. Conversely,
if
O D
ω
ω
γ
(0)> , human capital acquired in the host country has a higher return back home.In case migration does not take place, the individual only decides about human capital investment in the second period, s : O*
30
(2) maxF (s) OX(1 s) T[ O(X g(s,A,X))]
O
s =ω − + ω + ,
where g(s,A,X) translates human capital investment in the home country in the
second period into skills and is subject to the same standard assumptions as f(s,A,X).
In this model, return migration is induced by the possibility to acquire human capital in the host country that is yielding a high rate of return in the home country (see Dustmann, 1994a, 1995, Borjas and Bratsberg, 1996, Domingues Dos Santos and Postel-Vinay, 2003,
and Dustmann et al., 2010a, for a similar formulation).18 A return to the home country may
happen at the beginning of the third period if
O D
ω
ω
γ
(0)> . An example are “studentmigrations”, where a migration takes place to acquire skills abroad that have a higher return
in the home country.19 Return migration can also be induced by a high return in the home
country to human capital acquired in the host country “on the job”.20 In our model, this is
18 We will only discuss human capital accumulation as a return motive in this chapter. There are other motives
for why immigrants may want to return, such as higher purchasing power of the host country currency in the home country, or consumption amenities in the home country. See Dustmann (1994a, 1995) for a detailed discussion.
19 There is relatively little direct empirical evidence on the returns of foreign education in the home country of
an immigrant after he or she returned. One obvious problem for empirical analysis is selection of both those who decide to study abroad and those who return to their home country, which makes it difficult to identify a causal effect. Oosterbeek and Webbink (2006) exploit a discontinuity in the awarding of a specific grant to Dutch students for studying abroad. Their OLS estimates show a wage gain for graduates who studied abroad of around 4 to 7 percent relative to graduates who did not. However, their RD estimates, though of broadly similar magnitude, are inconclusive due to large standard errors. Wiers-Jenssen and Try (2005) find a wage premium for Norwegian workers who graduated abroad of around 3.5 percent while Palifka (2003), using survey data covering a complete cohort of graduates from a single Mexican university, finds a premium of around 20 percent six months after graduation for graduates who spent at least some time studying abroad.
20 There is evidence that, for migrants who returned to their home country, work experience acquired abroad
enhances earnings by more than work experience acquired in the home country. Reinhold and Thom (2009) analyse earnings of Mexican emigrants who returned from the United States. They find that, for these immigrants, the labour market experience accumulated in the U.S. increases earnings by twice as much as experience accumulated in Mexico. Papers by Barrett and O’Connell (2001) and Iara (2006) report similar findings for Ireland and migrants who returned to Eastern Europe from Western European countries. Co et al. (2000) report a wage premium for having been abroad for female return migrants to Hungary.
31 reflected by γ'(t)>0. Even if O D
ω
ω
γ
(0)< so that an immediate return after period 2 is notoptimal, returning before T may be an optimal strategy.
3.2.2 Skill Investment in the Home County
After having chosen the optimal duration abroad t* and the optimal investment in
learning s*, where we denote the payoff of these choices as FD(t*,s*D) in case of emigrating
and ( O*)
O
s
F in case of not emigrating, we will now consider the first period problem. Before
making the migration decision, individuals have the possibility to acquire education in the
home country in the first period. To allow for this, we will make X, the human capital stock
after the first period, a function of first period investment i:X = X(i). We assume that skills
acquired in the first period are concave with respect to investment: Xi >0, Xii ≤0. The
choice of i will depend on the possibility of a future migration. In case of migrating, the value
function is then given by
(3) V maxFD(s*D(i),t*(i),i) C(i,A)
i
D = −
,
where C( Ai, ) is the cost of investing into education in the home country, which has
the properties Ci >0, Cii >0, CA <0, CiA <0: costs are increasing in investment, convex, and lower as well as increasing at a slower rate for high ability individuals. In case of
remaining in the home country, the value function is given by
(4) V maxFO(sO*(i),i) C(i,A)
i O
−
32
3.2.3 The Migration Decision
The choice whether or not to migrate will depend on the comparison of the optimal
value functions:
(5) V =max[VD −k +
η
D,VO +η
O].Assume that
η
j, j=O,D, are iid extreme value distributed error terms capturing heterogeneity in the choice, and k are the cost of migration. It follows that for a givenindividual the probability of a migration is given by
D O k V V migrate e + − + = 1 1 Prob .
Thus, if we assume that abilities follow a distribution G, with support [0,A], then the
proportion of individuals who migrate from country O to country D is given by
∫
= A migrate A dG A 0 migrate( ) ( ) Prob Proportion .This model is simple, but instructive, as it allows for a variety of cases that have been
studied in the empirical literature. For a permanent migration, the second period problem in
(1) corresponds to the simple human capital model that underlies the early empirical papers
on immigrant assimilation (see, for example, Chiswick, 1978). Adding the possibility of
return migration with a pre-determined migration period leads to more complex empirical
specifications, as we will illustrate below. The problem becomes even more difficult if the
migrant chooses the time of return optimally. The model also allows consideration of the
relationship between migration and return migration, and human capital accumulation in the
host country. It includes the special case of student migrations, where some countries are
“learning centres”, as documented in Table 5, and provide education that has a high return in
33
The choices made in the first period add additional insight into learning incentives
induced by migration possibilities. For instance, acquisition of education in the home country
in the first period may be a pre-requisite for acquiring further and higher education in the host
country in period 2. Furthermore, the model allows for the possibility that human capital in
the home country is acquired because it has a high return in the host country. In the following
section, we will explore some of the implications of this model for empirical work. We will
then discuss the empirical literature, using the model as a framework of reference.
3.3 Implications of the Model
3.3.1 The Optimal Investment in Skills and the Optimal Migration Duration
We first consider the problem of the individual at the beginning of the second period.
For those who do not migrate, the optimal investment in the second period s is simply *O
obtained by differentiating (2) with respect to s and equating the additional forgone earnings in the learning period from an extra unit of time investment, ωOX , to the benefit arising from a higher earnings potential in the subsequent period, ωOgsT.
For those who migrate, the problem at the beginning of the second period
corresponds to the decision about how much to invest in host country human capital, and
when and whether to return to the home country. The FOC’s are given by
(6-a) ( , ):− D + s[ D +( − ) ( ) O]=0 D t t T t f X ds t s dF ω γ ω ω (6-b) ( , ): (X + f(.))− (X + (t)f(.))+ (T −t) '(t)f(.)=0 dt t s dF O O D D γ ω γ ω ω .
The equilibrium condition for the optimal investment in human capital while being in
34
learning period from an additional unit of time investment (first term) must be equal to the
benefit arising from a higher earnings potential in the subsequent period (as in the case of no
migration). This, in turn, depends on the time spent in the host country t , on the increase in
productivity in the second period through investments in human capital in the first period fs,
and on the transferability of human capital acquired abroad to the home country labour
market γ(t), which may depend on the time spent in the host country.
The optimal migration duration derived from Equation (6-b) depends – for the
optimally chosen human capital investment – on a comparison between spending a marginal
unit of time in the host country, and spending the same unit of time back in the home country.
The individual chooses the optimal s and t simultaneously. The optimal human capital
investment *
D
s will change in response to changes in exogenous parameter (for instance the
rent on human capital ωD) directly, and indirectly, because any parameter change affects the optimal migration duration, t*, which in turn changes investment. Given our assumptions
about f(.) and γ(t), it is straightforwa