Old Dominion University
ODU Digital Commons
Mechanical & Aerospace Engineering Faculty
Publications Mechanical & Aerospace Engineering
2011
Simulation and Visualization Enhanced
Engineering Education- Development and
Implementation of Virtual Experiments in a
Laboratory Course
Sushil K. Chaturvedi
Old Dominion University, [email protected] Kaustubh A. Dharwadkar
Follow this and additional works at:https://digitalcommons.odu.edu/mae_fac_pubs
Part of theEducational Assessment, Evaluation, and Research Commons, and theEngineering Education Commons
This Conference Paper is brought to you for free and open access by the Mechanical & Aerospace Engineering at ODU Digital Commons. It has been accepted for inclusion in Mechanical & Aerospace Engineering Faculty Publications by an authorized administrator of ODU Digital Commons. For
more information, please [email protected].
Repository Citation
Chaturvedi, Sushil K. and Dharwadkar, Kaustubh A., "Simulation and Visualization Enhanced Engineering Education- Development and Implementation of Virtual Experiments in a Laboratory Course" (2011).Mechanical & Aerospace Engineering Faculty Publications. 87.
https://digitalcommons.odu.edu/mae_fac_pubs/87
Original Publication Citation
Chaturvedi, S. K., & Dharwadkar, K. A. (2011).Simulation and visualization enhanced engineering education - development and implementation of virtual experiments in a laboratory course.Paper presented at the 2011 ASEE Annual Conference and Exposition, Vancouver, British Columbia.
AC 2011-742: SIMULATION AND VISUALIZATION ENHANCED
ENGI-NEERING EDUCATION DEVELOPMENT AND IMPLEMENTATION OF
VIRTUAL EXPERIMENTS IN A LABORATORY COURSE
Sushil K. Chaturvedi, Old Dominion University
Dr Sushil Chaturvedi is a professor of Mechanical Engineering at Old Dominion University. His teaching and research interests are in the area of engineering eduaction and renewable energy conversion and conservation.
Kaustubh A. Dharwadkar
c
American Society for Engineering Education, 2011
P
Simulation and Visualization Enhanced Engineering Education –
Development and Implementation of Virtual Experiments in a
Laboratory Course
Keywords: Virtual labs, simulation, visualization, assessment
Abstract
This paper presents results from a National Science Foundation grant titled “Simulation and Visualization Enhanced Engineering Education”, funded by the EEC division. Although the scope of the project is quite broad, embracing a wide range of courses in three engineering disciplines, the present work describes the results obtained from application of simulation and visualization for development and implementation of web-based virtual engineering laboratories. The present work leverages the advancement in hardware and software technologies to map physical experiments into web-based virtual experiments that can be used to enrich student’s laboratory experience. Four physical experiments in the thermo-fluids laboratory course have been mapped into virtual experiments, and the newly created virtual experiments have been used by students to conduct pre-lab practice sessions prior to performing corresponding physical experiment sessions. By performing virtual experiments, students learn in more detail about the objectives, procedure and expected outcomes ahead of scheduled physical experiments. Use of virtual experiments in the supplementation mode makes students better learners, and the assessment results show that students are better prepared and get more out of physical laboratory sessions.
To test the efficacy of the proposed pre-lab practice session pedagogy, assessment instruments and statistical experimental designs have been developed and implemented to objectively determine whether implemented virtual experiments, used in supplementation mode, enhance student learning compared to the pre-implementation setting (without virtual experiments) and to test if the learning gains are statistically significant or not. The pedagogy of supplementation of physical experiments with pre-lab practice sessions with virtual experiments shows promise, based on results obtained in this project. Impact of various demographic factors such as gender, age, ethnicity, student level etc. on student learning was also analyzed.
P
Introduction
This paper presents results from a National Science Foundation grant titled “Simulation and Visualization Enhanced Engineering Education”. The overall goal of this project (NSF-0530365) is to enhance student learning process by implementing an undergraduate curricula transformation at Old Dominion University that integrates web-based simulation and visualization modules in several engineering science courses. Although the scope of the project is quite broad, encompassing a wide range of lecture and laboratory courses in three disciplines namely electrical, civil and mechanical engineering, the focus here is on efforts directed towards development, implementation and assessment of web-based virtual laboratory experiments that have been embedded in a junior-level thermo-fluids laboratory course in the mechanical engineering curriculum. Four physical experiments in the thermo-fluids laboratory course have been transformed into corresponding virtual experiments using modeling, simulation and visualization.
Convergence of several interrelated factors such as recent developments in computer and Internet technologies and their impact on students’ learning styles, changing student demographics, and emergence of cyber laboratory infrastructure as a cost-effective alternative to physical laboratories has catapulted virtual laboratories as a topic of critical importance to the engineering education enterprise. The learning style of a large percentage of engineering students has been shown to be predominantly visual [1]. This visual learning proclivity of current students has been further accentuated due to their extensive exposure to electronic visual devices such as computers, videogames etc. This factor has been a catalyst in recent years in development of educational tools such as virtual labs that are predominantly simulation and visualization-based. The demographics of students enrolled in many urban engineering institutions is also changing rapidly, with many students pursuing degree programs on a part-time basis. These students are increasingly seeking opportunities to take courses as well as entire degree programs in the anytime-anywhere mode on distance learning networks. To cater to growing needs of these distance learners, engineering institutions have begun undertaking the challenging task of developing web-based engineering programs in which all or some part of laboratory instruction will have to be conducted on-line, preferably through virtual laboratories. Last but not least, the
P
fiscal reality of shrinking resources at many universities, both public and private, coupled with rising cost of physical laboratory infrastructure has prompted engineering educators to explore the possibility of incorporating virtual labs in engineering curricula even for on-campus engineering programs. For these conventional on-campus engineering programs virtual experiments can be combined with physical experiments for creation of hybrid or mix-reality laboratories that are both cost effective as well as inherently flexible.
Review of Previous Work
Modeling, simulation and visualization have been used by engineers to analyze physical phenomena and design complex engineering systems [2]. The same methodologies have been used in recent years by engineering educators to recreate on a computer screen a phenomenon related to a physical experiment in a laboratory. In more advanced versions of modeling, the entire physical experiment can be mapped into a web-based virtual experiment. The virtual experiments thus created can be used as building blocks for development of virtual laboratories that have significant potential for applications to engineering education. Virtual laboratories can be classified as recreative or interactive or immersive or collaborative. The hierarchy of virtual laboratory development is shown in Fig.1. At the bottom of the pyramid are recreative laboratories, a term coined to indicate that modeling, simulation and visualization have been used to recreate a physical phenomenon in the virtual domain. These laboratories or simulations are ideally suited for demonstration of many complex physical phenomena in a qualitative sense, and would generally lack interactivity – the ability of a user to manipulate the physical phenomenon through inputs. For example, simulation and visualization of a building collapse or the phenomenon associated with a snow avalanche would create a movie that would be helpful in familiarizing a viewer with the general phenomenon without involving viewer’s interaction with the simulation.
Interactive virtual labs involve a single user who can interact with a virtual experiment on a computer screen, using a computer mouse or a keyboard. The user can set operating parameters and record data using virtual instruments. A number of investigators have developed interactive laboratories for a variety of engineering disciplines. For example a recent special IEEE journal issue is dedicated entirely to virtual laboratories in the areas of mechanical, electrical and biomedical engineering [3]. Bhargava et al [4] have developed a virtual torsion laboratory for
P
teaching concepts related to torsion in different materials. Other virtual laboratories have been developed for topical areas involving solid mechanics [5], fluid mechanics [6], civil engineering [7], and electrical engineering [8].
Immersive virtual laboratories are an improvement over interactive virtual laboratories because they provide both interactivity as well as immersion that give users a sense of presence, similar to what one would encounter in physical laboratories. Examples of virtual reality labs can be found in many areas of education such as physics education [9-10], medical education [11] and engineering education [12-13]. Coupling of virtual reality with computer simulation has spawned a new field known as virtual engineering which is already being used in industry to design and analyze complex systems [2]. Virtual immersive labs that are also collaborative represent the apex point in the development of virtual laboratories. Collaboration among geographically distributed learners will be important for performing the experiment as a team. These virtual labs will be essential part of web-based engineering programs that are expected to come on-line in the near future.
The literature review of virtual labs indicates that although considerable work has been done in recent years, virtual laboratories are still far from becoming part of many engineering programs. Incorporation of virtual labs in engineering curricula faces barriers that must be overcome. The factors impeding assimilation of virtual labs in engineering education are both perceptual as well as substantive in nature. Physical labs are used as one of the primary means of providing hands-on experience to engineering students. In the mind-set of many present day engineering educators, hands-on experience is better gained in the physical domain as compared to hands-on experience obtained in the virtual domain through virtual laboratories. This is due to the widely held view that physical labs provide a window to real world while virtual labs are just an imitation of the real stuff – merely a computer-based simulation and visualization of the real world. To some extent this view is justified since virtual labs can at best be designed to mimic physical labs closely but they can never be a perfect representation of the physical labs. Fortunately, as we shall see later that at least in one application discussed in this work even less than perfect virtual labs created through modeling, simulation and visualization have important roles to play for enhancing student learning in laboratory courses. Also, future development of more advanced immersive virtual labs will incorporate a high level of realism currently lacking
P
in present day virtual labs. The substantive issue also relates to the need to demonstrate clearly and unequivocally that virtual labs have the capability of enhancing student learning and making laboratory experience engaging and productive.
Fig.1 Hierarchy of virtual Lab Development
The Goals and Objectives
The primary goal of this work is to demonstrate that engineering students’ laboratory experience can be enriched through incorporation of virtual experiments in laboratory courses. The emphasis is on assessment of impact on student learning brought about by implementation of virtual experiments. As a test case, we have introduced several virtual experiments in the junior-level thermo-fluids laboratory course (ME 305) in the mechanical engineering curriculum. The virtual experiments are used in the mixed mode wherein they are employed to prepare students through pre-lab practice sessions prior to the scheduled physical experiment sessions. The expectation is that by conducting the web-based pre-lab practice sessions students will become knowledgeable about objectives, procedure, data acquisition and expected outcomes of the physical experiment, and this would reinforce positively students’ handling of physical experiments. It is to be noted that for this specific application, since students will be exposed to
P age 22.1296.6
I
mmersi
v
e
and
Collaborati
v
e
Virtual Labs
I
mmersi
v
e Virtual Labs
I
nteracti
v
e Virtual Labs
Recreation
of Physical Phenomenon
both physical and virtual experiments, creation of virtual experiments even in two-dimensions would be sufficient, and modeling does not have to be very elaborate. The specific objectives are: (a) development, and implementation of web-based virtual experiments in the chosen laboratory course and (b) assessment of virtual experiments from a perspective of student learning enhancement.
Description of Virtual Experiments
The methodology for converting a physical experiment into a virtual experiment has been described in Refs [14-15], and readers are referred to those articles for more details. In designing all four virtual experiments described in this study, following criteria were used.
(i) The salient features of each physical experiment must be preserved in the physical to virtual domain mapping.
(ii) The objectives, experimental procedure, data acquisition and expected outcomes of the experiment are replicated with reasonable care so that the virtual experiment can serve as a proxy for the physical experiment during the pre-lab practice session.
(iii) The virtual experiments must be interactive, and allow for on-line data acquisition.
(iv) The operation of virtual experiment, including manipulation of it’s key components, must be based either on empirical data - collected from the physical experiment, or it must be based on the virtual data obtained from the solution of conservation equations (energy, mass, momentum etc.).
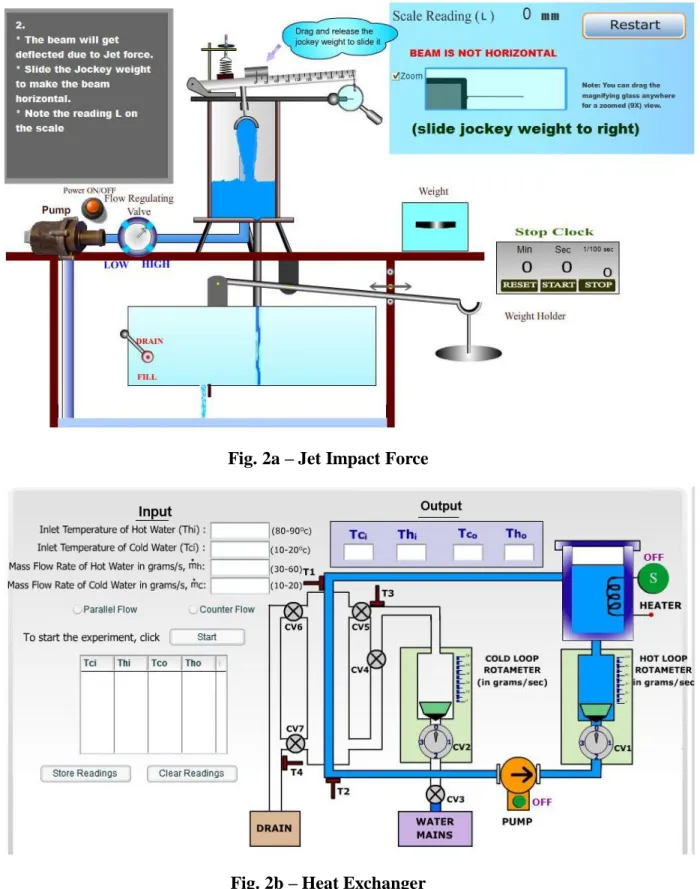
Figure 2 (included at the end of the paper) shows the screenshots of four virtual experiments (www.mem.odu.edu/me305) that have been successfully developed. Table 1 gives more details about implementation and assessment. All virtual experiments modules contain at least three sub-modules. They are:
(a) Description of the experimental procedure – This section describes steps that must be taken
sequentially to complete each experiment on-line. P
(b) Virtual interactive sub-module – This is the core part of the virtual experiment. It allows a user to interact with the experiment by enabling him or her to input operating data and retrieve corresponding data output on-line.
(c) Theoretical framework – This sub-module presents concepts, laws and equations governing the underlying physical phenomenon in the experiment. In some virtual experiments a web-project, using the virtual experiment, is also included to reinforce students’ understanding of underlying principles and equations.
Four virtual experiments have been developed thus far, and three of them have been implemented and assessed in the supplementation mode, in which virtual experiments are used for web-based virtual pre-lab practice sessions to prepare students for physical laboratory sessions.
Assessment of Impact of Virtual Experiments on Student Learning
For all virtual experiments that were implemented and assessed, students in the laboratory course were divided into “control” and “experimental” groups. The “control” group included students who did not use virtual experiments for pre-lab practice sessions. Students in this group prepared for the physical experiment session using the laboratory manual supplied to them by the course instructor. Students in the “experimental” group used the lab manual as well as virtual
experiments for the preparatory phase. Both groups were given an identical quiz to test them for their level of preparation for the physical experiment. In addition to collecting quiz performance data, student demographic data was also collected. The ten demographic factors considered in this study were gender, ethnicity, age, student level, class load, SAT verbal score, SAT math score, cumulative GPA, student status as transfer or freshman, and HS GPA. Student learning outcomes can be impacted by the virtual experiment as well as the ten demographic factors identified for assessment. Since demographic profiles of “control” and “experimental” groups may be different, a demographic factor analysis would be needed to identify those demographic factors that may contribute, in addition to a virtual experiment, to student learning enhancement.
Statistical Analysis of Assessed Data
The main objective of statistical analysis is to determine if an implemented virtual experiment contributes favorably to learning outcomes (quiz score etc.) of the “experimental” group and if
P
learning enhancement as reflected by increased group’s quiz mean score is statistically
significant. Since both group sizes were typically quite small (about 15 students) the test score distributions for both “control” and “experimental” groups may not be normally distributed. To test for the normality of quiz data, we have used the Shapiro-Wilk W statistics [16]. Results of the analysis indicated non-normal distributions for all virtual experiments implemented in the laboratory course. As a result, instead of using parametric methods that are appropriate for statistical analysis of a normally distributed sample, a median-based, pair-wise non-parametric Wilcoxon-Rank sum statistics [17] was used to account for non-normality of quiz score
distribution. The hypothesis of central tendency and dispersion was used to compare paired median as well as variance for all outcomes at 95% confidence level (α =0.05). At 95%
confidence level, if Wilcoxon Rank-sum p-value is less than 0.05 then a conclusion can be made that there is a significant difference between the mean scores on the quiz for “control” and “experimental” groups. In the same manner, at 95% confidence level, if Wilcoxon Rank-sum p-value is less than 0.05, then a conclusion can be made that there is significant difference between mean scores of the course outcomes (the quiz mean score) from “control” and “experimental” group settings due to contribution by the particular demographic variable. The details of the statistical analysis are given in Ref. [18].
Discussion of Results
The conclusions pertaining to module effectiveness in enhancing student learning for various virtual experiments are summarized in Table 2. As reported in the table, all three embedded virtual experiments were effective in enhancing student learning. This constitutes the most significant finding of the statistical analysis of assessed data. For all four outcomes for the three virtual experiments assessed, the statistical analysis showed that implemented virtual
experiments contributed effectively towards student learning gain. The p-value given in Table 2 is a measure of significance contributed by chance factor to the observed outcomes. In most social and educational research, a p-value greater than or equal to 0.05 is interpreted as
“insignificant” and is considered to be indicative of results that are unaffected by the chance i.e., no difference to student learning was made by the implemented virtual experiment. Conversely p-value < 0.05 indicates that improvement in student learning, characterized by improved quiz scores, can be attributed to the module implementation.
P
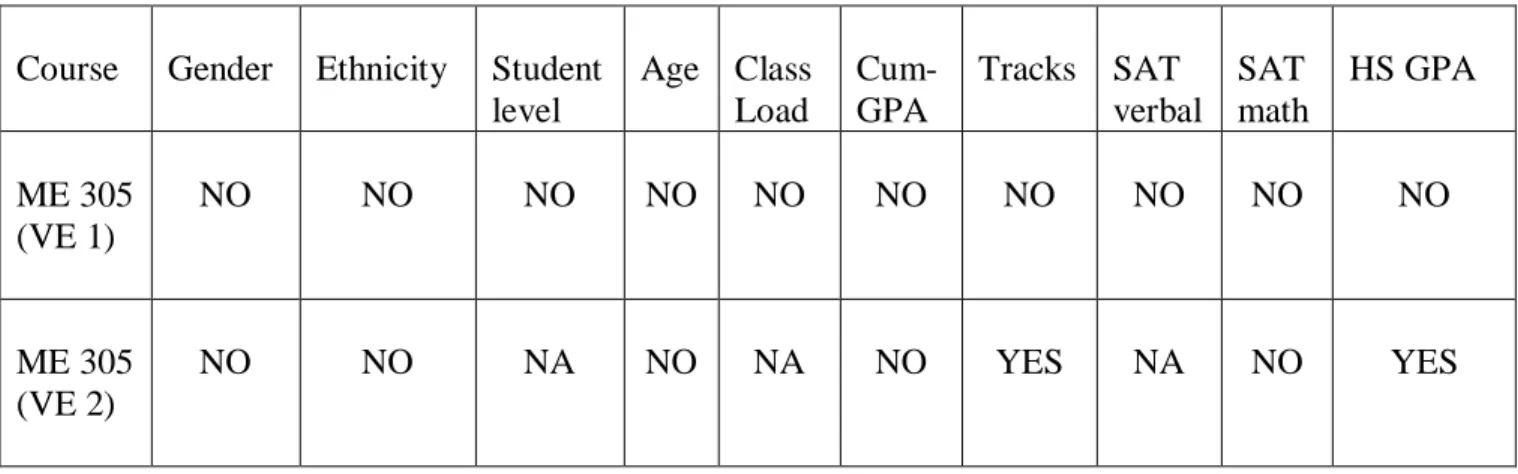
Table 3 presents the summary of results from the statistical analysis of student demographics as contributing factor to student learning enhancement. All ten demographic factors are listed against the virtual experiments analyzed. It should be noted that the demographic analysis was performed for only two experiments (VE 1 and VE 2). For the third virtual experiment (VE 3), the analysis could not be done due to unavailability of demographic data. The symbol “NO” in Table 3 indicates that the demographic factor is not a significant factor. The symbol “NA” indicates that a demographic factor is not available. It is noted that of the ten demographic factors considered, eight factors namely gender, ethnicity, age, student level, class load,
cumulative GPA, SAT verbal and SAT math scores did not contribute to the learning outcomes. Only “transfer” status and HS GPA contributed significantly to learning outcome. Demographic factors as shown in Table 3 were tested seventeen times for their impact on student learning, and fifteen times the results indicated that their impact on student learning was not significant in the statistical sense. In fact the analysis showed that only student status (transfer vs freshman) and HS GPA contributed to student learning enhancement.
Conclusions
The department level reform (DLR) grant awarded to Old Dominion University has created opportunities to revitalize engineering education through the use of technology tools such as simulation and visualization. Student learning enhancement is the foremost objective of this project. Assessment of student learning gains due to implementation of virtual experiments in the thermo-fluids laboratory course was accomplished, using credible experimental design and rigorous statistical analysis. Both these aspects of the assessment methodology addressed in this project are important if results are to be applicable to a larger population of engineering students from institutions across the country. Statistical analysis of assessed data reported in Tables 2 and 3 shows that implemented modules were effective in enhancing student learning. Results also indicated that out of the ten demographic factors considered in the analysis, eight factors (“gender”, “ethnicity”, “student level”, “age”, “class load”, “cum-GPA”, “SAT verbal”, and “SAT math scores”) did not have any impact on student learning. In other words, the modules are neutral to these factors. At the other end of the spectrum, students’ “HS GPA” and student track turned out to be significant factors. Students’ responses to the implemented modules, as measured by student survey forms were quite positive. Students were generally of the opinion
P
that their engagement with the web-based modules has helped them enhance learning achieved through conventional classroom setting.
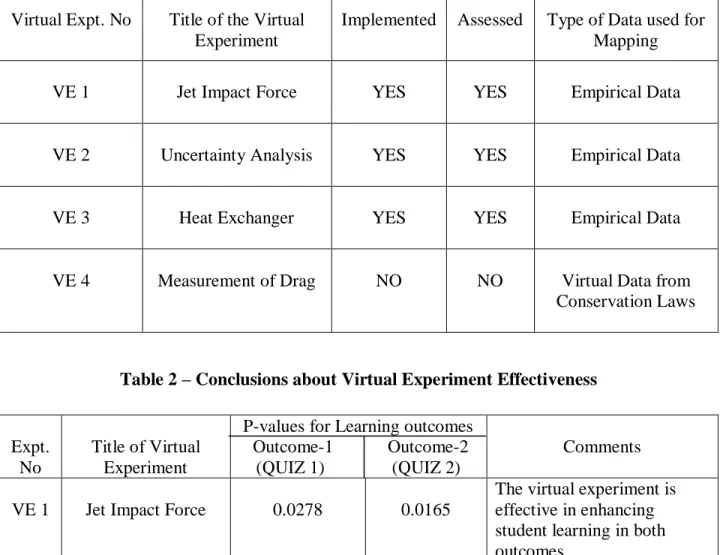
Table 1 - List of Virtual Experiments
Virtual Expt. No Title of the Virtual Experiment
Implemented Assessed Type of Data used for Mapping
VE 1 Jet Impact Force YES YES Empirical Data
VE 2 Uncertainty Analysis YES YES Empirical Data
VE 3 Heat Exchanger YES YES Empirical Data
VE 4 Measurement of Drag NO NO Virtual Data from
Conservation Laws
Table 2 – Conclusions about Virtual Experiment Effectiveness
Expt. No
Title of Virtual Experiment
P-values for Learning outcomes Outcome-1 Outcome-2
(QUIZ 1) (QUIZ 2)
Comments
VE 1 Jet Impact Force 0.0278 0.0165
The virtual experiment is effective in enhancing student learning in both outcomes
VE 2 Uncertainty Analysis 0.001 -
The virtual experiment is effective in enhancing student learning in both outcomes
P
Table 3 - Summary of Results from the Statistical Analysis of Demographic Factors
Course Gender Ethnicity Student level Age Class Load Cum-GPA Tracks SAT verbal SAT math HS GPA ME 305 (VE 1) NO NO NO NO NO NO NO NO NO NO ME 305 (VE 2) NO NO NA NO NA NO YES NA NO YES
NO: Factor Not Significant NA: Factor Not Available YES: Factor Significant
Acknowledgement
This work has been supported by a grant from the Engineering Education and Centers (EEC) Division of National Science Foundation (NSF-0530365). Any opinions, findings, conclusions or recommendations presented in this paper are those of authors and do not necessarily reflect the views of the National Science Foundation.
References
1. Felder, R.M., “Learning and Teaching Styles in Engineering Education, Engineering Education, 78 (7), 1988, PP. 674-681.
2. Bryden, M. and McCorkle, D., “Virtual Engineering”, Mechanical Engineering, Nov. 2005, PP. 38-42. 3. Special Issue on Virtual Laboratories, IEEE Transactions on Education, Vol. 51, No.1, Feb. 2008. 4. Bhargava et al., “Web-Based Virtual Torsion Laboratory”, Wiley Periodical Inc. 2006
5. Hashemi, J.et al., “Web-Based Delivery of Laboratory Experiments and Its Effectiveness Based on Student Learning Style”, ASEE Annual Conference, 2006.
6. Jia, R. et al., “A Virtual Laboratory on Fluid Mechanics”, ASEE Annual Conference, 2006.
P
7. Buddu, M., “Virtual Laboratories for Engineering Education”, International Conference on Engineering Education, Aug. 2002.
8. Bean, J.C., and Vijaykumar, V., “The Creation of Web-Based Interactive Virtual Experiments on
Microelectronics and Nanoscience for Early Engineering Students”, IEEE/ASEE Frontiers in Education Conference, 2002, Boston, MA.
9. Wu, Y. et al., “Web-Based Virtual Reality Physics Laboratory”, Proceedings of the 3rd
IEEE International Conference on Advanced Learning Technologies, 2003.
10. Shin, Y., “Virtual Reality Simulation in Web-Based Science Education”, Wiley Periodicals 2002.
11. Scerbo, M.W. et al., “A Virtual Operating Room for Context Relevant Training”, Proceedings of Human Factors and Ergonomics Society, Annual Meeting, 2007.
12. Messner, J.I. et al., “Using Virtual Reality to Improve Construction Engineering Education”, Proceedings of ASEE Annual Conference, 2006.
13. Bell, J.T. and Fogler, H.S., “Virtual Reality in Chemical Engineering Education”, Proceedings of the 1988 ASEE North Central Section Meeting, Detroit, Michigan.
14. Chaturvedi, S.K., Bawab, S., Akan, H., and Abdel-Salam, T.M., “Development of a Methodology to Visualize and conduct a Physical Experiment as a Web-Based Virtual
15. Chaturvedi, S.K. and Abdel-Salam, T., “A Web-Based Student Learning Tool for Thermodynamics Concepts Related to Multistaging in Compressors and Turbines”, Innovations 2008: World Innovations in Engineering Education and Research, Aug. 2008
16. Shapiro, S.S. and Wilk, M.B. (1965). “An Analysis of Variance Test for Normality (complete samples)”, Biometrika, 5:591-611.
17. Wilcoxon, F. (1945). “Individual comparisons by ranking methods”, Biometrics Bulletin, 1,80-83.
18. Chaturvedi, S.K. et al., “Engineering Laboratory Instruction in Virtual Environment – eLIVE”, Accepted for Publication in the Journal of Advances in Engineering Education, to appear in 2011.
P
Fig. 2a – Jet Impact Force
Fig. 2b – Heat Exchanger
P
age 22.1296.14
FILI.
Input
Inlet Temperature of Hot Water (Thi) : (80·900c) Inlet Temperarure of Cold Water (Tei) : ~. ---...;!oo-20"c) Mass Flow Rate of Hot Water in grams/s, mh: ~ (30·60)n Mass Flow Rate of Cold Water in grams/s, me:
Parallel Flow Counter Flow
To start the experiment, dick ~ Start- - CV6
Tei Thi Teo Tho
[ Store Readings ) 1 Clear Readings
DRAIN
Tc;
n
Scale Reading ( L) 0 mm
BEAM IS NOT HORIZONTAL
.!!!Zoom
Restart
Note: You can drag the m11gntfying glass anywhere
fo, • zoomed (OX} \lf•w. (slide jockey weight to right)
Weight Stop C lock Min Sec 11100 . . , Weight I lo Ider Output Th; Teo
n
'
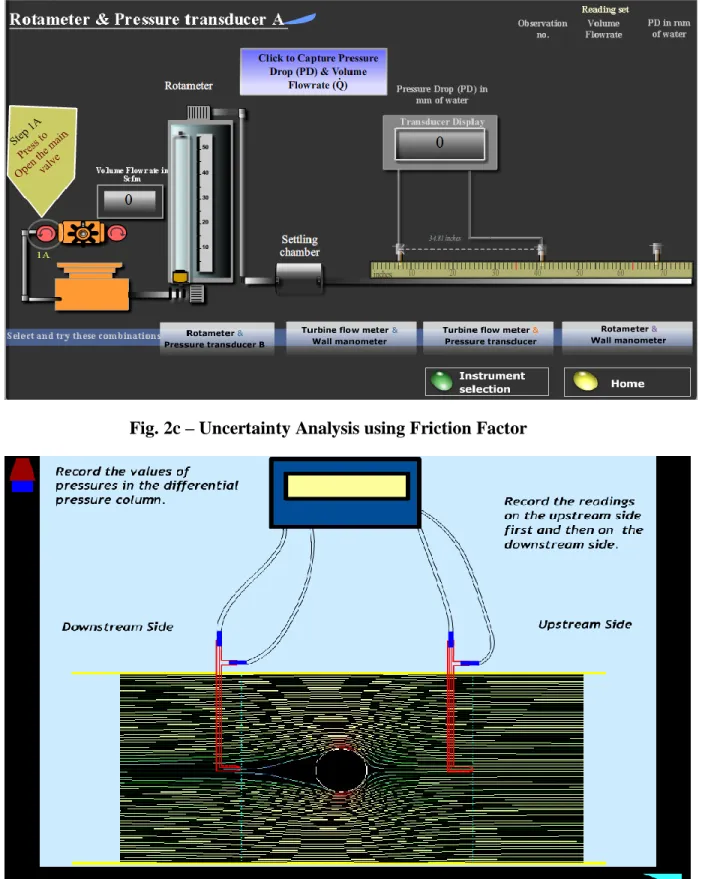
MAINS COLD LOOP ROTAMETER (in gram5/5ec) ROTAMETERFig. 2c – Uncertainty Analysis using Friction Factor
Fig. 2d – Measurement of Drag along a Cylinder
P
age 22.1296.15
Rotametcr & Pressure transducer . .\.-,,
Rotameter
c.di:toCapmre"'-re
Drop (PD) & Volume
Flow.-ate (Q) Settling chamber
-P~-ure Drop (PD) in nun ofwatet l---t !I 2•1 "I a I , 1 I PD in nun of ,,·au-r1S elect and try these combination Rotamater & Tur
....
bine flow meter & Turbine flow meter&
...._..t
...
Rotameter &...
-.
Record the values of pressures in the differential pressure column. //
,1
1
.,.,,., D011ttnstream Side.,,-:/
#
,// (( Instrument selectionRecord the readings
on the upstream side first and then on the downstream side.