HEDGE FUND RETURNS’ WEIGHTED-SYMMETRY AND THE OMEGA©
PERFORMANCE MEASURE
by Pierre Laroche, Innocap Investment Management and Bruno Rémillard, Department of
Management Sciences, HEC Montréal.
Introduction
Many investors consider investing in hedge funds (HF) because their dynamic investment strategies produce return distributions that often exhibit less downside risk and low correlations with the main traditional asset returns.
Analysts often proxy the downside risk by looking at the asymmetry of return distribution, as measured by the skewness coefficient. Recently, however, some analysts, such as Ineichen [2006], give a closer look at the asymmetry of HF returns. Among other things, they point out that the skewness coefficient can be highly misleading.
This paper aims to provide a more formal analysis framework that goes along these lines by applying the notion of weighted-symmetric (WS) probability distributions to HF returns. We also show that WS
distribution parameters have a direct link with the Omega© performance measure[1] developed by Keating
and Shadwick [2002].
The Notion of Weighted-Symmetry Definition and use of weighted-symmetry
Following Abdous and Rémillard [1995], a probability distribution function F(.) of a random return X is said to be weighted-symmetric (WS) about
θ
if and only if there exist two constantsp
∈
( )
0,1
andω
>
0
such that;
(
) (
1
) (
)
pPr X
− < − = −
θ
x
p Pr X
− >
θ ω
x
Equation(1)
where the
θ
parameter can be interpreted as a return threshold. In this paper, since the attractiveness of HF is largely dependant on their ability to protect capital, we measure the HF returns’ WS about[2]θ
= 0.Parameter p is the weight and can be interpreted as the likelihood of excess returns above
θ
. Parameterω
can be interpreted as an upside magnitude – downside magnitude ratio with respect toθ
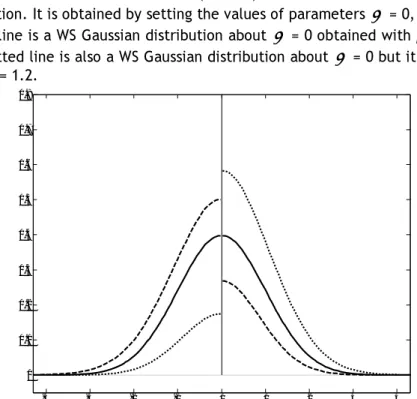
.The most interesting property of WS distributions for the study of HF returns is that it can be used to model a highly skewed and leptokurtic probability distribution by joining two halves of the same distribution with different weights on the left and the right portions1. Fig. 1 Graph 1 illustrates some example of WS
distributions about 0 for different p and
ω
values.[1] Copyright The Finance Development Center 2002.
[2] This is not equivalent of assuming that the returns have a zero mean. 1 Also Note that these distributions are discontinuous at
θ
unless p=ω1+ω. This is a technical issue that has no tangible
Fig. 1 Graph 1: Examples of weighted-symmetric Gaussian distributions
In this figure, the full line is a Gaussian (Normal) distribution with zero mean and unit standard deviation. It is obtained by setting the values of parameters
θ
= 0, p = 0.5 andω
= 1. The dashed line is a WS Gaussian distribution aboutθ
= 0 obtained with p = 0.3 andω
= 0.8 and the dotted line is also a WS Gaussian distribution aboutθ
= 0 but it is obtained withp = 0.8 and
ω
= 1.2. -4 -3 -2 -1 0 1 2 3 4 0 0.1 0.2 0.3 0.4 0.5 0.6 0.7 0.8Using WS parameters as an enhanced measure of symmetry
There are many ways to measure the asymmetry of a distribution. The first measure that comes to mind is the skewness statistic. However, its value can become very large (especially in presence of outliers) and is difficult to interpret. There exist many other measures of asymmetry (see Mandrekar and al. [2004] and Ngatchou-Wandji [2006] for a brief review of the most common ones). For all these alternative measures, it is difficult to identify deviations from symmetry, especially from a small number of observations, such as it is often the case when we analyse HF returns. Also, there are no widely used test statistics associated with them. These weaknesses are sufficient conditions to look for alternative asymmetry measures.
The notion of WS is a generalisation of the classical symmetry measure[3]. As noted in Graph 1, setting the
WS parameters p = ½ and
ω
=1 produces a symmetric distribution (for whatever value ofθ
and whatever family of probability distribution) in the classical sense of the expression; both sides of the distribution aroundθ
are identical.WS distribution’s parameters are more informative than any single symmetry measure such as the skewness coefficient. The latter blends all the asymmetry information whereas WS makes a clear distinction
between the frequency of the “good” (i.e. higher) returns and that of the “bad” ones. More precisely, the estimated value of p gives the weight of returns above
θ
(in this article we setθ
=0, hence p is the weight[3] As noted in Abdous and Rémillard [1995], WS is a special case of alternatives to symmetry proposed by Lehmann [1953]. Hence, the principles underlying the notion of WS have been around for over 50 years.
of positive returns) and the estimated value of
ω
gives the absolute value of the ratio of the expected value of above-θ
returns to the expected value of below-θ
returns. In other words, when we setθ
= 0, then ifω
> 1, it means that the average value of positive returns is greater than that of negative returns. The information conveyed by parameters p andω
hence constitutes a formal representation of the kind of observations highlighted by Ineichen [2006] (italic text within brackets has been added by us for clarity):“The skew statistic [of the HFR Multi-Strategy Index monthly returns] is slightly negative, which is actually quite funny” … “it is funny (or at least strange) that skew is negative because there are 75 observations in the 0.8 to 2.4 percent bucket, that is, the first bucket immediately to the right of the mean, while a normal distribution suggests only 68.”
Here are two examples along these lines. Let us begin by applying our WS model to the HFRI Fund of Funds Composite index (HFRI FHFCI) returns to which Ineichen refers in the above citation. We base our
estimation on HFRI FHFCI’s monthly returns over the period ranging from January 1999 to February 2007, for a total of 206 observations (which roughly corresponds to the observation period used by Ineichen in the above-cited text)2.
This HFRI FHFCI returns exhibited a skewness coefficient of -0.2696, a result that many analysts and investors would interpret as a sign of higher-than-desired downside risk. But when we look at the WS parameters, we obtain the following results: p = 0.7353 and
ω
= 1.6452. In other words, the upside weightis 73.53 percent and the Upside-Downside Magnitude Ratio is also very favourable. This result shows how misleading the skewness coefficient can be.
An even more striking example is that of HFRI’s Merger Arbitrage Index (HFRI MAI) returns. Over the same observation period as above, their skewness coefficient is very negative (-2.4924) whereas the estimated WS coefficients p and
ω
parameters are nearly 0.85 and 1.86 respectively, which gives a much bettercontrasting picture. See Fig. 2 Graph 2 for an illustration of these results.
Fig. 2 Graph 2: The WS distribution of two HFR Indices Monthly Returns
HFR FoHF Composite Index HFRI Merger Arbitrage Index
-0.080 -0.06 -0.04 -0.02 0 0.02 0.04 0.06 0.08 2 4 6 8 10 12 14
W-S density with θ = 0, ω = 1.6452 and p = 0.73529
Weighted-Symmetry and the Omega© statistic
2 The parameters estimation method is described in Aldous, Ghoudi and Rémillard (2003). -0.080 -0.06 -0.04 -0.02 0 0.02 0.04 2 4 6 8 10 12 14 16 18
Another interesting property of the notion of weighted-symmetry is that Keating and Shadwick’s original Omega© (
Ω
( )
θ
) formula is equivalent to a simple function of the weighted-symmetry parameters p andω
: (see Fig.3) Fig.3( )
1
p
p
θ
⎛
⎞
ω
Ω
=
⎜
⎟
×
−
⎝
⎠
Equation (2) First term:Ratio of Upside weight to Downside weight
Second term:
Ratio of Upside Magnitude to Downside Magnitude
When we apply equation (2) to the two indices we referred to, we obtain the following results shown in the next table. (Fig.4)
As we can see, these two WS estimations are equal to those obtained by applying the original Omega© formula (the differences are due to rounding).
Fig.4 Weighted-Symmetry Estimation of the Omega© Coefficient Estimation of Omega© using the original formula HFR FoHF Composite Index 0.7353 1.6452 4.5701 1 0.7352 ⎛ ⎞ = ⎜ − ⎟ ⎝ ⎠ 4.5699 HFR Merger Arbitrage Index
0.8488
1.8571 10.4253
1 0.8488
⎛
⎞
=
⎜
−
⎟
⎝
⎠
10.4240CONCLUSION
In this study we present the notion of weighted-symmetry (WS), a more informative measure of the
symmetry of a probability distribution. WS parameters are much less misleading than the skewness when an investor wants to rapidly assess the asymmetry or proxy the downside risk of a hedge fund.
We also presented how to estimate the Omega© performance measure by using the estimated parameters of the WS distribution.
An interesting extension to this work includes a broader analysis based on a significant sample of individual hedge funds in order to help the fund of hedge funds managers to better allocate their portfolio. For example, it might be wise to see if it is astute to mix home-run hitters (low p but very high
ω
) with good regular single hitters (very high p but lower – but still above 1.0 -ω
).References:
Abdous, B. and B. Rémillard, “Relating Quantiles and Expectiles Under Weighted-Symmetry”, Annals of the
Institute of Statistical Mathematics, 47 (1995).
Abdous, B., K. Kilani and B. Rémillard, “Nonparametric Weighted Symmetry Tests”, The Canadian Journal
of Statistics, 31, 4, 2003.
Ineichen, A.M., Asymmetric Returns: the Future of Active Asset Management, Wiley, 2006.
Keating, C. and W.F. Shadwick, “An Introduction to Omega©”, The Finance Development Center Limited, 2002.
Lehmann, E.L., “The Power of Rank tests”, Annals of Mathematics and Statistics, 24 (1953).
Mandrekar, J.N., S.J. Mandrekar and S.S. Cha, “Evaluating Methods of Symmetry”, Mayo Clinic – Division of Biostatistics Research Paper, 2004.
Ngatchou-Wandji, J., “On testing for the Nullity of Some Skewness Coefficients”, International Statistical
Review, 74 (2006).
Rémillard, B. and P. Laroche, “A Statistical Test for the Omega© Performance Measure”, Innocap Investment Management Research Paper, July 2007.