Editors: Claudio Silva, [email protected] Joel E. Tohline, [email protected]
V
I S u A l I z A t I o nC
o r n E rP
rovenance
for
v
isualizations
r
eProducibilityandb
eyondBy Claudio T. Silva, Juliana Freire, and Steven P. Callahan
The demand for the construction of complex visualizations is growing in many disciplines of science, as users are faced with ever increasing volumes of data to analyze. The authors present VisTrails, an open source provenance-management system that provides infrastructure for data exploration and visualization.
C
omputing has been an enor-mous accelerator for science, leading to an information ex-plosion in many different fields. Fu-ture scientific advances depend on our ability to comprehend the vast amounts of data currently being produced and acquired. To analyze and understand this data, though, we must assemble complex computational processes and generate insightful visualizations, which often require combining loosely coupled resources, specialized librar-ies, and grid and Web services. Such processes could generate yet more data, adding to the information over-flow scientists currently deal with.Today, the scientific community uses ad hoc approaches to data ex-ploration, but such approaches have serious limitations. In particular, scientists and engineers must expend substantial effort managing data (such as scripts that encode computa-tional tasks, raw data, data products, images, and notes) and recording
provenance information (that is, all the information necessary to reproduce a certain piece of data) so that they can answer basic questions: Who cre-ated a data product and when? When was it modified, and who modified it? What process was used to create the data product? Were two data products derived from the same raw data? This process is not only time-consuming, but also error-prone.
Without provenance, it’s diffi-cult (and sometimes impossible) to reproduce and share results, solve problems collaboratively, validate re-sults with different input data, and understand the process used to solve a particular problem. In addition, data products’ longevity becomes limited—without precise and suffi-cient information about how the data product was generated, its value di-minishes significantly.
The lack of adequate provenance support in visualization systems mo-tivated us to build VisTrails, an open source provenance-management sys-tem that provides infrastructure for data exploration and visualization through workflows. VisTrails trans-parently records detailed provenance of exploratory computational tasks and leverages this information be-yond just the ability to reproduce and share results. In particular, it uses this information to simplify the process of exploring data through visualization. Visualization Systems
Visualization systems such as Maya-Vi (http://mayavi.sourceforge.net) and ParaView (www.paraview.org)—which are built on top of Kitware’s Visual-ization Toolkit (VTK)1—as well as
SCIRun (http://software.sci.utahedu/ scirun.html) enable users to interac-tively create and manipulate complex visualizations. Such systems are based
on the notion of data flows,2 and they
provide visual interfaces for produc-ing visualizations by assemblproduc-ing pipe-lines out of modules (or functions) connected in a network. SCIRun supports an interface that lets users directly edit data flows. MayaVi and ParaView have a different interac-tion paradigm that implicitly builds data flows as the user makes oriented” choices (such as selecting an isosurface value).
Although these systems let users create complex visualizations, they lack the ability to support data explo-ration at a large scale. Notably, they don’t adequately support collabora-tive creation and exploration of mul-tiple visualizations. Because these systems don’t distinguish between the definition of a data flow and its instances, to execute a given data flow with different parameters (for example, different input files), users must manually set these parameters through a GUI. Clearly, this process doesn’t scale to more than a few vi-sualizations at a time. Additionally, modifications to parameters or to a data flow’s definition are destruc-tive—the systems don’t maintain any change history. This requires the user to first construct the visualiza-tion and then remember the input data sets, parameter values, and the exact dataflow configuration that led to a particular image.
Computing and Imaging Institute, where he does research primarily in visualization, graphics, and applied geometry. Joel is a professor of physics and astronomy at louisiana State university and a faculty member in lSu’s Center for Computation and technology, with a research focus on complex fluid flows in astrophysical systems. We both have extensive experience in high-performance computing. In partnership with our readers and colleagues, we hope to bring you relevant and effective information about visual-ization techniques that can directly affect the way our read-ers do science. We would like to use new Web technologies (Wikis, blogs, and so on) to encourage the community to
related ones (for example, using different data). ultimately, our hope is that this trend will spread to the point that published articles will contain not only textual descriptions of the techniques, but links to data, code, and the complete overall process used to generate the scientific results.
As a mechanism to capture and share provenance meta-data, authors can use Vistrails to produce specifications of the figures and plots presented in their articles. We’ll archive this information at www.vistrails.org/index.php/ CiSE. the data and processes associated with this column are already available on the Web site, so you can reproduce them, right now, from your desktop!
Finally, before constructing a vi-sualization, users must often acquire, generate, or transform a given data set—for example, to calibrate a simu-lation, they must obtain data from sen-sors, generate data from a simulation, and finally construct and compare the visualizations for both data sets. Most visualization systems, however, don’t give users adequate support for cre-ating complex pipelines that support multiple libraries and services. VisTrails: Provenance for Visualization
The VisTrails system (www.vistrails. org) we developed at the Univer-sity of Utah is a new visualization system that provides a comprehensive provenance-management infrastruc-ture and can be easily combined with existing visualization libraries. Unlike previous systems, VisTrails uses an action-based provenance model that uniformly captures changes to both parameter values and pipeline defini-tions by unobtrusively tracking all changes that users make to pipelines in an exploration task. We refer to
this detailed provenance of the pipe-line evolution as a visualization trail, or vistrail.
The stored provenance ensures that users will be able to reproduce the visualizations and lets them easily navigate through the space of pipe-lines created for a given exploration task. The VisTrails interface lets users query, interact with, and understand the visualization process’s history. In particular, they can return to previous versions of a pipeline and change the specification or parameters to gener-ate a new visualization without losing previous changes.
Another important feature of the action-based provenance model is that it enables a series of operations that greatly simplify the exploration process and could reduce the time to insight. In particular, the model al-lows the flexible reuse of pipelines and provides a scalable mechanism for creating and comparing numer-ous visualizations as well as their cor-responding pipelines. Although we originally built VisTrails to support exploratory visualization tasks, its
extensible infrastructure lets users in-tegrate a wide range of libraries. This makes the system suitable for other exploratory tasks, including data min-ing and integration.
Creating an Interactive Visualization with VisTrails To illustrate the issues involved in creating visualizations and how prov-enance can aid in this process, we present the following scenario, com-mon in medical data visualization.
Starting from a volumetric computed tomography (CT) data set, we generate different visualizations by exploring the data through volume rendering, isosurfacing (extracting a contour), and slicing. Note that with proper modi-fications, this example also works for visualizing other types of data (for ex-ample, tetrahedral meshes).
Dataflow-Processing Networks and Visual Programming
A useful paradigm for building visu-alization applications is the dataflow model. A data flow is a directed graph in which nodes represent computations,
V I S u A l I z A t I o n C o r n E r
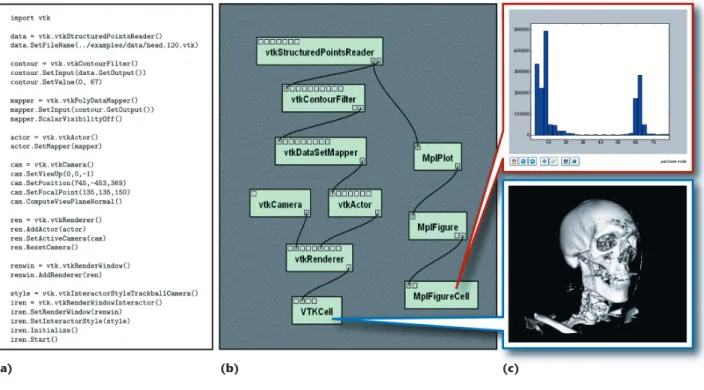
and edges represent data streams: each node or module corresponds to a procedure that’s applied on the in-put data and generates some outin-put data as a result. The flow of data in the graph determines the order in which a dataflow system executes the processing nodes. In visualization, we commonly refer to a dataflow network as a visualization pipeline. (For this article, we use the terms workflow, data flow, and pipeline interchange-ably.) Figure 1b shows an example of the data flow used to derive the im-ages shown in Figure 1c. The green rectangles represent modules, and the black lines represent connec-tions. Most of the modules in Figure 1 are from VTK, and labels on each module indicate the corresponding VTK class. In this figure, we natu-rally think of data flowing from top to bottom, eventually being rendered and presented for display.
We can use different mechanisms
for creating visualization pipelines— for example, scripting in a modern dynamic language, such as Python. Consider Figure 1a, which defines the workflow via a script written in Py-thon that uses VTK to read a volume data set from a file, extract an isosur-face, map the isosurface to renderable geometry, and then finally render it in an interactive window.
Visual programming interfaces for designing data flows have become popular and several systems, such as SCIRun, have adopted them. These interfaces give users a more intuitive view of the pipeline. They also dy-namically perform type checking and guide the connection between mod-ules’ input and output ports—once the user selects a module’s output, connections are allowed only to the target module’s appropriate input. VisTrails automatically pulls edges toward the correct input port. As we discuss later, another benefit of
hav-ing a high-level, structured workflow description is that we can use expres-sive languages in querying and updat-ing workflows.
Comparing and Exploring Multiple Visualizations
Regardless of the specific mechanism we use to define a pipeline, the visu-alization process’s end goal is to gain insight from the data. To obtain such insight, users must often generate and compare multiple visualizations. Going back to our scenario, several alternatives exist for rendering our CT data. Isosurfacing is a commonly used technique. Given a function f:
Rn→R and a value a, an isosurface consists of the set of points in a do-main that map to a—that is, Sa = {x∈
Rn: f(x) = a}.
The range of a values determines all possible isosurfaces that the user can generate. To identify “good” a values that represent a data set’s important
(a) (b) (c)
Figure 1. Dataflow programming for visualization. (a) We commonly use a script to describe a pipeline from existing libraries such as the Visualization Toolkit (VTK). (b) Visual programming interfaces, such as the one VisTrails provides, facilitate the creation and maintenance of these dataflow pipelines. The green rectangles represent modules, and the black lines represent connections. (c) The end result of the script or VisTrails pipeline is a set of interactive visualizations.
VisTrails provides a very simple plug-in functionality that you can use to add packages and libraries, including your own. For our example, we used matplotlib’s 2D plotting functionality (http://matplotlib.sourceforge.net) to generate the histogram at the top of Figure 1c. This histogram helps in data exploration by suggesting re-gions of interest in the volume. The plot shows that the highest frequency features lie between the ranges [0,25] and [58,68]. To identify the features that correspond to these ranges, we must explore these regions directly through visualization.
Scalable exploration of parameter spaces. VisTrails provides an interface for parameter exploration that lets users specify a set of parameters to explore, as well as how to explore, group, and display them. As a simple 1D example, Figure 2 shows an exploration of the
can also link the spreadsheet’s cells to synchronize the interactions between visualizations. Note that VisTrails leverages the dataflow specifications to identify and avoid redundant op-erations. By using the same cache for different cells in the spreadsheet, VisTrails lets users efficiently explore numerous related visualizations. Comparing different visualization tech-niques. Volume rendering is a power-ful computer graphics technique for visualizing 3D data. Whereas many visualization algorithms focus on creating a rendering of surfaces— although they might be surfaces of 3D objects—volume rendering lets us see “inside” the volume. This tech-nique models the volume as cloud-like cells of semitransparent material. A surface rendering of the human body might show only the skin, for example, but a complete volume
ren-distinguishing between them can be difficult. The VisTrails system lets us compare workflows using a visual dif-ference interface. To demonstrate this capability, we compute the difference between the original isosurface-gen-eration pipeline and the new volume-rendering pipeline. Figure 3 shows the visual difference of the workflows that we can inspect, along with their resulting visualizations. In Figure 3a, we use volume rendering to create the image, in which we can see the skin on top of the bone structure; Figure 3b shows only the bone structure ren-dered with our standard isosurface technique. This ability to (efficiently) compare workflows and visualizations is one of the benefits of the VisTrails action-based provenance model and becomes increasingly important as a workflow becomes more complex and is shared among collaborators.
V I S u A l I z A t I o n C o r n E r
comparisons are challenging because they require module-by-module (vi-sual programming) or line-by-line
(scripting) comparisons. Although the former can be computationally intrac-table (the related decision problem of
subgraph isomorphism is NP-complete), the latter could lead to results that are hard to interpret.
(a) (b)
(c)
Figure 4. Multiple rendering techniques. (a) VisTrails renders visualizations by combining volume rendering and isosurfacing and updates them with user interactions. (b) The corresponding pipeline represents the data flow for creating interactive visualizations. (c) VisTrails provides a fully browseable history of the exploration process that led to this final set of visualizations.
(a)
(b) (c)
Figure 3. A visual difference between different pipelines in VisTrails. We show the difference between pipelines that generated (a) volume rendering and (b) isosurface visualizations. (c) The interface distinguishes shared modules in dark gray, the modules unique to isosurfacing in blue, those unique to direct volume rendering in orange, and those with parameter changes in light gray.
Interacting with visualizations. The images we generated so far corre-spond to simple, static workflows. To perform a more dynamic compari-son between volume rendering and isosurfacing, we add a feedback loop into the workflow to let users adjust the visualization interactively. We thus build a new workflow that uses the isosurfacing and volume render-ing algorithms simultaneously. We add a clipping plane into the volume visualization to assign the volume regions used for each algorithm. In addition, we use a point on the plane to define axis-aligned slices of the volume that we display in distinct spreadsheet cells. The pipeline
in-teractively updates these slices along with the plane during user interac-tions. Figure 4 shows the resulting visualizations along with the com-plex dynamic workflow required to produce them.
Provenance and
Exploratory Visualization
The combination of multiple visual-ization algorithms, different librar-ies, and the interactions between them considerably complicates the workflow specification. In addition, creating a set of visualizations from data is not always a linear process and often involves several itera-tions as a user formulates and tests
hypotheses. Whereas for simple experiments, manual approaches to provenance management might be feasible, complex computational tasks involving large volumes of data or multiple researchers require au-tomated approaches. As these tasks’ complexity and scale increases, data organization becomes a major com-ponent of the process.
VisTrails manages the data ma-nipulated and metadata created in the course of an exploratory task.3 As
a user (or group of users) generates a series of visualizations, VisTrails transparently tracks all the steps this exploration followed—that is, the modules and connections added and tion about workflow execution (such as who executed
a module, on which machine, and how much time elapsed). Vistrails also provides a flexible annotation framework through which users can specify specific provenance information.
Querying and reusing history. Provenance information is stored in a structured way. users have the choice of using a relational database (such as MySQl or IBM DB2) or XMl files in the file system. the system provides flexible and intuitive query interfaces through which users can explore and reuse provenance information. users can formulate simple keyword-based and selection queries (find a visualization that a given user created, for example) as well as structured queries (find visualizations that apply simplification before an isosurface computa-tion for irregular grid data sets).
Support for collaborative exploration. users can configure the system with a database back end that can act as a shared repository. this back end also provides a syn-chronization facility that lets users collaborate asynchro-nously and in a disconnected fashion—they can check changes in and out, akin to a version-control system (such as subversion (SVn), http://subversion.tigris.org). •
•
parameters in a workflow. users can display the results of a parameter exploration side by side in the Vistrails spreadsheet for easy comparison.
Task creation by analogy. Vistrails supports analogies as first-class operations to guide semiautomated changes to multiple workflows, without requiring users to directly manipulate or edit the workflow specifications. Please visit www.vistrails.org to access the Vistrails community Web site. You’ll find information including instructions for obtaining the software, online docu-mentation, video tutorials, and pointers to papers and presentations.
Vistrails is written in Python and uses the multiplat-form Qt library for its user interface. the system is open source, released under the GPl 2.0 license. the pre-com-piled versions for Windows, Mac oS X, and linux come with an installer and several packages, including VtK, matplotlib, and Image Magick. Additional packages, including ones users have written, are also available, but you can easily add new packages using the Vistrails plug-in infrastructure. Detailed instructions are available at our Web site.
V I S u A l I z A t I o n C o r n E r
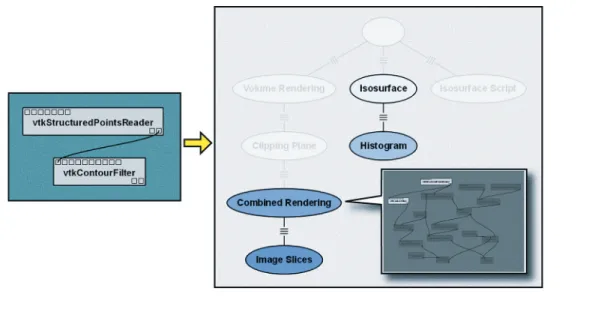
deleted, parameter value changes, and so on. Figure 4c shows a history tree of the different pipelines created in the course of our running example. The nodes in this tree correspond to pipe-lines; an edge between two pipelines corresponds to changes performed on the parent pipeline to obtain its child. For readability, by default, only the nodes in the tree that the user tags as important are displayed.
By tracking all the changes made to a workflow ensemble, VisTrails properly captures each step, leaving a complete trail of the work. Hav-ing access to the different pipelines’ specifications lets others reproduce and share the results of each step in the exploratory process. To demon-strate this, we made the vistrail
asso-ciated with this example available for download with the VisTrails system (see “The VisTrails System” sidebar). You can recreate each figure shown in this article by executing the different nodes in the history tree. Note that by using the action-based provenance model, we obtain a very concise rep-resentation of the history, which uses substantially less space than the alter-native of explicitly storing multiple
versions of a pipeline.3
The exploration trail VisTrails cap-tures also supports various activities that are crucial for performing reflec-tive reasoning and obtaining insights, such as following chains of reasoning backward and forward and comparing different results.4 The tree-based view
lets users
seamlessly navigate over the history tree and return to previous pipeline versions after reaching a dead end; undo bad changes;
reuse pipelines and pipeline frag-ments from previous versions; compare different pipelines and their results; and
be reminded, intuitively, of the ac-tions that led to a particular result. Thus, users can efficiently explore several related visualizations.
The issue of reproducibility for vi-sualization has been considered be-fore,5 but we should note that whereas
some visualization and workflow sys-tems provide support for provenance tracking, their focus has been on data provenance—that is, information about how the system derived a given data product, including the param-eter values used6—and on interaction
provenance (such as capturing a visu-alization’s viewing manipulations).7
VisTrails is the first system to capture information about how workflows evolve over time.
For instance, to generate the composite visualization in our final example, we extended our pipeline labeled Volume Rendering to include •
• • • •
Figure 5. The VisTrails query-by-example interface. (a) Users can define a set of modules and parameters in the visual programming interface to create a query template. (b) The query results are shown in the history tree, which users can browse for specific instances of the match (inset).
Table 1. Query examples.
Query Result
volume Highlights all nodes in the history tree in which the string “volume” appears (for example, in a module name, parameter name, annotation) user:juliana Highlights all nodes in the history tree created by
the user “juliana”
before: March 30, 2007 Highlights all nodes in the history tree created before “March 30, 2007”
cess, and the user can also reuse them. In this case, we applied the modules unique to “Isosurfacing” to “Volume Rendering” to create a new pipeline called “Combined Rendering,” that uses a cutting plane to define regions for the rendering methods. VisTrails can automatically apply pipeline dif-ferences (like a patch) to derive new pipelines in a process we call visual-ization creation by analogy.8
Another benefit to having a high-level specification of the visualiza-tion process is that users can query the pipelines and their execution instances. Scientists can query a vis-trail to find anomalies in previously generated visualizations and locate data products and visualizations based on operations applied in the visualization process. VisTrails sup-ports simple, keyword-based queries as well as structured queries. In addi-tion to providing informaaddi-tion about the results (for example, workflow identifiers and attributes), VisTrails can visually display query results by highlighting the workflows and mod-ules that satisfy the query. Table 1 shows an example.
Users might also define queries by example.8 As Figure 5 illustrates,
us-ers can construct (or copy and paste) a pipeline fragment into the VisTrails query tab to identify in the history tree all nodes that contain that frag-ment. They can then browse through the highlighted nodes and click on one
ploratory tasks. With this infrastruc-ture in place, our research focus is now on what we can do with all the provenance accumulatation. By min-ing this information, we hope to learn useful patterns that can guide users in assembling and refining complex computational tasks.
Acknowledgments
This article summarizes work being done in the VisTrails project. It’s only possible through the work of all our team members: Erik Anderson, Jason Callahan, David Koop, Emanuele Santos, Carlos E. Scheidegger, and Huy T. Vo. The data used in this ar-ticle is available courtesy of the Na-tional Library of Medicine’s Visible Human Project. The US National Sci-ence Foundation partially supported this work under grants IIS-0513692, CCF-0401498, EIA-0323604, CNS-0541560, OCE-0424602, and OISE-0405402. The US Department of Energy, an IBM Faculty Award, and a University of Utah Seed Grant also partially supported this work.
References
W. Schroeder, K. Martin, and B. lorensen,
The Visualization Toolkit: An Object-Oriented Approach To 3D Graphics, Kitware, 2003. E.A. lee and t.M. Parks, “Dataflow Process networks,” Proc. IEEE, vol. 83, no. 5, 1995, pp. 773–801.
S. Callahan et al., “Managing the Evolution of Dataflows with Vistrails (extended ab-stract),” Proc. IEEE Workshop on Workflow and
1. 2. 3.
357–369.
D.P. Groth and K. Streefkerk, “Provenance and Annotation for Visual Exploration Systems,” IEEE Trans. Visualization and Computer Graphics, vol. 12, no. 6, 2006, pp. 1500–1510.
C. Scheidegger et al., Querying and Creating Visualizations by Analogy,” to be published in IEEE Trans. Visualization and Computer Graphics, 2007.
Claudio T. Silva is an associate professor at
the university of utah. His research inter-ests include visualization, geometry pro-cessing, graphics, and high-performance computing. Silva has a PhD in computer science from SunY at Stony Brook. He is a member of the IEEE, the ACM, Eu-rographics, and Sociedade Brasileira de Matematica. Contact him at csilva@ cs.utah.edu.
Juliana Freire is an assistant professor at
the university of utah. Her research inter-ests include scientific data management, Web information systems, and information integration. Freire has a PhD in computer science from SunY at Stony Brook. She is a member of the ACM and the IEEE. Contact her at [email protected].
Steven P. Callahan is a research assistant and
PhD candidate at the university of utah. His research interests include scientific visual-ization, visualization systems, and computer graphics. Callahan has an MS in computa-tional engineering and science from the university of utah. Contact him at stevec@ sci.utah.edu.
7. 8.