Over the last several decades, we have repeatedly demonstrated the ability to grow our business through market cycles by concentrating on our long-term drivers of growth. This financial strength and resiliency have allowed us to continue to make ongoing investments in capabilities to support our clients, our employees, and our business. Today, we are more focused than ever on enhancing our business model, being an employer of choice, and delivering services that add real value for our advisors and institutions and their clients.
Driving efficiencies in our core business
Following several years of considerable growth and expansion, created both organically and through acquisitions, we turned our attention in 2013 to improving our operational performance by achieving greater efficiencies in our core business. This enabled us to further differentiate our business model while also enhancing advisor productivity by introducing new technology and systems. We also leveraged recently acquired properties in the retirement and high-net-worth markets to deepen our position in those areas and to serve a broader range of advisors and institutions.
At the same time, we invested in our operations to create a more efficient infrastructure. We enhanced our technology platform and capabilities, as well as our regulatory and risk management functions. We outsourced some non-core functions while investing in other areas, including advisor-facing support services. And, we did this while achieving further
LPL financiaL HoLDings inc. 2013 AnnuAl RepORT 1
Message from the
Chairman & CEO
As I reflect on the past year, I am proud of the many positive ways LPL Financial—in partnership
with our employees and the financial advisors and institutions we support—is making a
difference by enriching the lives of millions of investors. Our success is a testament to
our overarching mission: to enable our clients to focus on creating the personal, long-term
relationships that are the foundation for turning life’s aspirations into financial realities.
This sense of purpose is the primary reason why we are the nation’s premier independent
broker/dealer
1and a leader in advisory and custody services today.
@MSCasady
Dear Fellow Shareholder,
We are building a smarter, simpler, and more personal LPL.
operational efficiencies made possible through our size and scale. We expect the investments we made this year in our people and technology will enable us to realize benefits in 2014 and beyond.
The result is a smarter, simpler, and more personal lpl, and our goal is to deliver on this promise every day: working smarter by using data and analytics to drive business decisions; making work simpler by streamlining processes and reducing paperwork for our advisors and their clients; and becoming more personal by delivering our services in a more tailored and targeted manner. By reducing complexity for our advisors and institution partners, we enable them to devote more time to serving their clients and growing their businesses. These are all steps in a longer journey to further strengthen our competitive leadership position.
2013 resuLts
Our ability to drive efficiency into our core business positioned the company for financial success in 2013. For a fourth consecutive year, we increased revenue, generating 13 percent year-over-year growth to a record $4.1 billion. Adjusted earnings per share grew for the fifth consecutive year, up 20 percent year-over-year to a record $2.44 per share, benefiting both from strong growth in profits and our decision to repurchase 5.8 million shares in 2013.
Our revenue growth was driven by strong investor reengagement—which was sustained over the course of a full year for the first time since the market break in 2008—and by strong market appreciation. Our results were further aided by our continued success in retaining and recruiting advisors. We believe our 97 percent annual production retention continues to lead the industry. We also benefited from a rebound in advisor recruiting. Despite a slow start, we finished strong in 2013, adding 321 net new advisors, putting us once again among the top firms in the industry in terms of attracting new clients. Our pipeline remains strong, and we are optimistic about our momentum heading into 2014. $330.3 $315.6 $279.4 2011 2012 2010 2009 $373.3 0 50 100 150 200 250 300 0.0 0.5 1.0 1.5 2.0 2.5 0 1000 2000 3000 4000 5000 0 100 200 300 400 500 ANNUAL REVENUE [$ Millions] $4,141 $3,661 $3,479 $3,113 $2,750 ADJUSTED EPS ADJUSTED EARNINGS [$ Millions] 2013 $259 $225 $219 $173 $130 2012 2011 2010 2009 TOTAL FUNDED CLIENT ACCOUNTS [Millions] 4.4 4.3 4.2 4.0 3.9 TOTAL ADVISORS 13,673 12,847 13,352 12,444 11,950 0 1 2 3 4 5 0 3000 6000 9000 12000 15000
ADJUSTED EARNINGS PER SHARE
$2.44 $2.03 $1.95 $1.71 $1.32 TOTAL ASSETS [$ Billions] 2013 $438.4 2011 2012 2010 2009 2013 2011 2012 2010 2009 2013 2011 2012 2010 2009 2013 2011 2012 2010 2009 2013 $330.3 $315.6 $279.4 2011 2012 2010 2009 $373.3 0 50 100 150 200 250 300 0.0 0.5 1.0 1.5 2.0 2.5 0 1000 2000 3000 4000 5000 0 100 200 300 400 500 ANNUAL REVENUE [$ Millions] $4,141 $3,661 $3,479 $3,113 $2,750 ADJUSTED EPS ADJUSTED EARNINGS [$ Millions] 2013 $259 $225 $219 $173 $130 2012 2011 2010 2009 TOTAL FUNDED CLIENT ACCOUNTS [Millions] 4.4 4.3 4.2 4.0 3.9 TOTAL ADVISORS 13,673 12,847 13,352 12,444 11,950 1 2 3 4 5 0 3000 6000 9000 12000 15000
ADJUSTED EARNINGS PER SHARE
$2.44 $2.03 $1.95 $1.71 $1.32 TOTAL ASSETS [$ Billions] 2013 $438.4 2011 2012 2010 2009 2013 2011 2012 2010 2009 2013 2011 2012 2010 2009 2013
2 LPL financiaL HoLDings inc. 2013 AnnuAl RepORT
In 2013, we added 321 net new advisors, putting us once again among the top firms in the industry in terms of attracting new clients. Our pipeline remains strong, and we are optimistic about our momentum heading into 2014.
BUILDING ON OUR TRACK RECORD TO ADD VALUE TO SHAREHOLDERS
One of the unique features of our business model is the ability of our capital-light structure to generate significant free cash flow. We have established a track record of reinvesting in the business to sustain long-term growth while possessing the flexibility to return capital to shareholders. We believe there is an additional upside to the value of LPL in its current model, driven by long-term industry trends, our leadership position in a consolidating marketplace, and a rising interest rate environment. As a result, we see opportunity for continued share repurchases and dividend growth. Since our initial public offering, we have invested $507 million in capital to repurchase 15.2 million shares at a weighted average share price of $33.25 and declared $317 million in dividends. SIGNIFICANT OPPORTUNITIES AHEAD We are proud of the progress we are making to achieve our long-term goals and encouraged by our growing reputation in the industry as the place to be for advisors seeking independence. In 2014, we will expand our commitment to create a smarter, simpler, more personal LPL by driving further efficiency into the business, supporting the growth of both our
advisors and financial institutions, and continuing to streamline our operations.
While the business continues to achieve many milestones, we have more opportunities before us to add value to advisors’ practices and make a difference in the lives of their clients. We will continue to offer our perspective and experience on issues that are reshaping our industry—from regulatory matters to addressing the growing need for financial advice and guidance here in the U.S.—as our population matures and prepares for a longer retirement. The success of the equity markets in 2013 and the impact of rising long-term interest rates on the fixed income markets present a new set of opportunities and challenges for investors. In addition, the array of products available to meet various investor goals continues to expand in both quantity and complexity. These factors place a growing premium on independent advice.
As we begin 2014, I am optimistic about the opportunities we have created at LPL to deliver positive results and win in the marketplace. We are well positioned to drive sustained future growth and create value for our shareholders, our employees, and our advisors who are helping their clients turn life’s aspirations into financial realities.
Sincerely,
Mark S. Casady Chairman and CEO
$330.3 $315.6 $279.4 2011 2012 2010 2009 $373.3 0 50 100 150 200 250 300 0.0 0.5 1.0 1.5 2.0 2.5 0 1000 2000 3000 4000 5000 0 100 200 300 400 500 ANNUAL REVENUE [$ Millions] $4,141 $3,661 $3,479 $3,113 $2,750 ADJUSTED EPS ADJUSTED EARNINGS [$ Millions] 2013 $259 $225 $219 $173 $130 2012 2011 2010 2009 TOTAL FUNDED CLIENT ACCOUNTS [Millions] 4.4 4.3 4.2 4.0 3.9 TOTAL ADVISORS 13,673 12,847 13,352 12,444 11,950 0 1 2 3 4 5 0 3000 6000 9000 12000 15000
ADJUSTED EARNINGS PER SHARE $2.44 $2.03 $1.95 $1.71 $1.32 TOTAL ASSETS [$ Billions] 2013 $438.4 2011 2012 2010 2009 2013 2011 2012 2010 2009 2013 2011 2012 2010 2009 2013 2011 2012 2010 2009 2013
WATCH THE VIDEO:
Visit our online annual report on LPL.com to watch Mark Casady share more of his perspective on how we made a difference in 2013.
LPL FINANCIAL HOLDINGS INC. 2013 ANNUAL REPORT 3
Since our initial public offering, we have invested $507 million in capital to repurchase 15.2 million shares at a weighted average share price of $33.25 and declared $317 million in dividends.
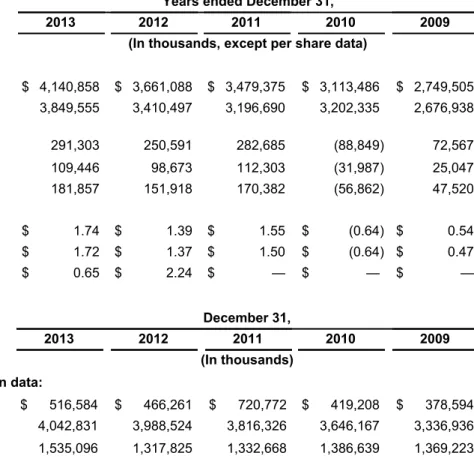
For the year ended December 31, 2013 2012 2011 2010 2009 Consolidated statements of income data:
Net revenues (in thousands) $ 4,140,858 $ 3,661,088 $ 3,479,375 $ 3,113,486 $ 2,749,505 Total expenses (in thousands) $ 3,849,555 $ 3,410,497 $ 3,196,690 $ 3,202,335 $ 2,676,938 (Loss) income from operations (in thousands) $ 291,303 $ 250,591 $ 282,685 $ (88,849) $ 72,567 Net (loss) income (in thousands) $ 181,857 $ 151,918 $ 170,382 $ (56,862) $ 47,520 Per-share data:
(Loss) Earnings per diluted share $ 1.72 $ 1.37 $ 1.50 $ (0.64) $ 0.47
Weighted average diluted shares outstanding (in thousands) 106,003 111,060 112,119 100,933 98,494 Consolidated statements of financial condition data:
Cash and cash equivalents (in thousands) $ 516,584 $ 466,261 $ 720,772 $ 419,208 $ 378,594 Total assets (in thousands) $ 4,042,831 $ 3,988,524 $ 3,816,326 $ 3,646,167 $ 3,336,936 Total debt (in thousands)(1) $ 1,535,096 $ 1,317,825 $ 1,332,668 $ 1,386,639 $ 1,369,223
Other financial and operating data:
Adjusted EBITDA (in thousands)(2) $ 511,438 $ 454,482 $ 459,720 $ 413,113 $ 356,068
Adjusted earnings (in thousands)(2) $ 258,805 $ 225,029 $ 218,585 $ 172,720 $ 129,556
Adjusted earnings per share(3) $ 2.44 $ 2.03 $ 1.95 $ 1.71 $ 1.32
Gross margin (in thousands)(4) $ 1,248,014 $ 1,112,251 $ 1,030,951 $ 937,933 $ 844,926
Number of advisors 13,673 13,352 12,847 12,444 11,950
Advisory and brokerage assets (in billions) $ 438.4 $ 373.3 $ 330.3 $ 315.6 $ 279.4 Advisory assets under management (in billions) $ 151.6 $ 122.1 $ 101.6 $ 93.0 $ 77.2
Average number of full-time employees 3,047 2,865 2,687 2,517 2,430
(1) Total debt consists of our senior secured credit facilities, senior unsecured subordinated notes, revolving line of credit facility, and bank loans payable.
(2) Adjusted earnings represent net income before: (a) employee share-based compensation expense, (b) amortization of intangible assets resulting from various acquisitions, (c) debt extinguishment costs, (d) restructuring and conversion costs, (e) equity issuance and related offering costs and (f) other. Reconciling items are tax effected using the income tax rates in effect for the applicable period, adjusted for any potentially non-deductible amounts. Adjusted earnings per share represents adjusted earnings divided by weighted average outstanding shares on a fully diluted basis. The Company prepares adjusted earnings and adjusted earnings per share to eliminate the effects of items that it does not consider indicative of its core operating performance. The Company believes these measures provide investors with greater transparency by helping illustrate the underlying financial and business trends relating to results of operations and financial condition and comparability between current and prior periods. Adjusted earnings and adjusted earnings per share are not measures of the Company’s financial performance under GAAP and should not be considered as an alternative to net income or earnings per share or any other performance measure derived in accordance with GAAP, or as an alternative to cash flows from operating activities as a measure of profitability or liquidity.
Adjusted EBITDA is defined as EBITDA (net income plus interest expense, income tax expense, depreciation and amortization), further adjusted to exclude certain non-cash charges and other adjustments. The Company presents adjusted EBITDA because the Company considers it a useful financial metric in assessing the Company’s operating performance from period to period by excluding certain items that the Company believes are not representative of its core business, such as certain material non-cash items and other adjustments that are outside the control of management. Adjusted EBITDA is not a measure of the Company’s financial performance under GAAP and should not be considered as an alternative to net income or any other performance measure derived in accordance with GAAP, or as an alternative to cash flows from operating activities as a measure of profitability or liquidity. In addition, adjusted EBITDA can differ significantly from company to company depending on long-term strategic decisions regarding capital structure, the tax jurisdictions in which companies operate and capital investments.
You can find additional related information, including a reconciliation of such non-GAAP measures for the years ended December 31, 2013, 2012 and 2011, within this Annual Report on Form 10-K for the year ended December 31, 2013. For a reconciliation of such non-GAAP measures for the years December 31, 2010 and 2009, please consult our Annual Report on Form 10-K for the year ended December 31, 2011.
(3) Represents adjusted earnings divided by weighted average number of shares outstanding on a fully diluted basis.
(4) Gross margin is calculated as net revenues less production expenses. Production expenses consist of the following expense categories from our consolidated statements of operations: (i) commissions and advisory fees and (ii) brokerage, clearing, and exchange. All other expense categories, including depreciation and amortization, are considered general and administrative in nature. In 2010, upon closing our IPO in the fourth quarter, the restriction on approximately 7.4 million shares of common stock issued to our advisors under the Fifth Amended and Restated
Financial
Highlights
UNITED STATES SECURITIES AND EXCHANGE COMMISSION
Washington, D.C. 20549Form 10-K
ANNUAL REPORT PURSUANT TO SECTION 13 or 15(d) OF THE SECURITIES EXCHANGE ACT OF 1934 For the fiscal year ended December 31, 2013
or
TRANSITION REPORT PURSUANT TO SECTION 13 or 15(d) OF THE SECURITIES EXCHANGE ACT OF 1934 For the transition period from________to
Commission file number 001-34963
LPL Financial Holdings Inc.
(Exact name of registrant as specified in its charter)Delaware 20-3717839
(State or other jurisdiction of incorporation or organization) (I.R.S. Employer Identification No.)
75 State Street, Boston, MA 02109
(Address of principal executive offices; including zip code)
617-423-3644
(Registrant’s telephone number, including area code)
Securities registered pursuant to Section 12(b) of the Act:
Title of Each Class Name of Each Exchange on Which Registered Common Stock — $.001 par value per share NASDAQ Global Select Market
Securities registered pursuant to Section 12(g) of the Act: None
Indicate by check mark if the registrant is a well-known seasoned issuer, as defined in Rule 405 of the Securities Act. Yes No Indicate by check mark if the registrant is not required to file reports pursuant to Section 13 or 15(d) of the Exchange Act. Yes No Indicate by check mark whether the registrant (1) has filed all reports required to be filed by Section 13 or 15(d) of the Securities Exchange Act of 1934 during the preceding 12 months (or for such shorter period that the registrant was required to file such reports), and (2) has been subject to such filing requirements for the past 90 days. Yes No
Indicate by check mark whether the registrant has submitted electronically and posted on its corporate web site, if any, every Interactive Data File required to be submitted and posted pursuant to Rule 405 of Regulation S-T (§ 232.405 of this chapter) during the preceding 12 months (or for such shorter period that the registrant was required to submit and post such files). Yes No
Indicate by check mark if disclosure of delinquent filers pursuant to Item 405 of Regulation S-K (§ 229.405 of this chapter) is not contained herein, and will not be contained, to the best of registrant’s knowledge, in definitive proxy or information statements incorporated by reference in Part III of this Form 10-K or any amendment to this Form 10-K.
Indicate by check mark whether the registrant is a large accelerated filer, an accelerated filer, a non-accelerated filer, or a smaller reporting company. See the definitions of “large accelerated filer,” “accelerated filer” and “smaller reporting company” in Rule 12b-2 of the Exchange Act. (Check one):
Large accelerated filer Accelerated filer Non-accelerated filer Smaller reporting company
(Do not check if a smaller reporting company)
Indicate by check mark whether the registrant is a shell company (as defined in Rule 12b-2 of the Act). Yes No
As of June 28, 2013, the aggregate market value of the voting stock held by non-affiliates of the registrant was $2.6 billion. For purposes of this information, the outstanding shares of Common Stock owned by directors and executive officers of the registrant were deemed to be shares of the voting stock held by affiliates.
The number of shares of common stock, par value $0.001 per share, outstanding as of February 19, 2014 was 100,343,788.
DOCUMENTS INCORPORATED BY REFERENCE
Portions of the definitive Proxy Statement to be delivered to stockholders in connection with the Annual Meeting of Stockholders are incorporated by reference into Part III.
TABLE OF CONTENTS
Page
PART I
Item 1 Business 1
Item 1A Risk Factors 16
Item 1B Unresolved Staff Comments 30
Item 2 Properties 30
Item 3 Legal Proceedings 31
Item 4 Mine Safety Disclosures 31
PART II
Item 5 Market for Registrant’s Common Equity, Related Stockholder Matters and Issuer
Purchases of Equity Securities 32
Item 6 Selected Financial Data 36
Item 7 Management’s Discussion and Analysis of Financial Condition and Results of
Operations 39
Item 7A Quantitative and Qualitative Disclosures About Market Risk 73 Item 8 Financial Statements and Supplementary Data 76 Item 9 Changes in and Disagreements with Accountants on Accounting and Financial
Disclosure 76
Item 9A Controls and Procedures 76
Item 9B Other Information 79
PART III
Item 10 Directors, Executive Officers and Corporate Governance 80
Item 11 Executive Compensation 82
Item 12 Security Ownership of Certain Beneficial Owners and Management and Related
Stockholder Matters 82
Item 13 Certain Relationships and Related Transactions, and Director Independence 82 Item 14 Principal Accountant Fees and Services 82
PART IV
Item 15 Exhibits and Financial Statement Schedules 83
EXHIBIT INDEX 83
WHERE YOU CAN FIND MORE INFORMATION
We file annual, quarterly and current reports, proxy statements and other information required by the Securities Exchange Act of 1934, as amended (the “Exchange Act”), with the Securities and Exchange Commission (the "SEC"). You may read and copy any document we file with the SEC at the SEC’s public reference room located at 100 F Street, N.E., Washington, D.C. 20549, U.S.A. Please call the SEC at 1-800-SEC-0330 for further information on the public reference room. Our SEC filings are also available to the public from the SEC’s internet site at http://
www.sec.gov.
On our Internet website, http://www.lpl.com, we post the following recent filings as soon as reasonably practicable after they are electronically filed with or furnished to the SEC: our annual reports on Form 10-K, our quarterly reports on Form 10-Q, our current reports on Form 8-K, and any amendments to those reports filed or furnished pursuant to Section 13(a) or 15(d) of the Exchange Act. Hard copies of all such filings are available free of charge by request via email ([email protected]), telephone (617) 897-4574, or mail (LPL Financial Investor Relations at 75 State Street, 24th Floor, Boston, MA 02109). The information contained or incorporated on our website is not a part of this Annual Report on Form 10-K.
When we use the terms “LPLFH”, “we”, “us”, “our”, and the “firm” we mean LPL Financial Holdings Inc., a
Delaware corporation, and its consolidated subsidiaries, taken as a whole, as well as any predecessor entities,
unless the context otherwise indicates.
SPECIAL NOTE REGARDING FORWARD-LOOKING STATEMENTS
Statements in Item 7 - “Management's Discussion and Analysis of Financial Condition and Results of Operations” and other sections of this Annual Report on Form 10-K regarding the Company's future financial and operating results, growth, business strategy, plans, liquidity, ability and plans to repurchase shares and pay dividends in the future, including statements regarding projected costs, projected savings, projected expenses and anticipated improvements to the Company's operating model, services, and technology as a result of the Service Value Commitment, as well as any other statements that are not related to present facts or current conditions or that are not purely historical, constitute forward-looking statements. These forward-looking statements are based on the Company's historical performance and its plans, estimates and expectations as of February 25, 2014. The words “anticipates,” “believes,” “expects,” “may,” “plans,” “predicts,” “will” and similar expressions are intended to identify forward-looking statements, although not all forward-looking statements contain these identifying words. Forward-looking statements are not guarantees that the future results, plans, intentions or expectations expressed or implied by the Company will be achieved. Matters subject to forward-looking statements involve known and unknown risks and uncertainties, including economic, legislative, regulatory, competitive and other factors, which may cause actual financial or operating results, levels of activity, or the timing of events, to be materially different than those expressed or implied by forward-looking statements. Important factors that could cause or contribute to such differences include: changes in general economic and financial market conditions, including retail investor sentiment; fluctuations in the value of assets under custody; effects of competition in the financial services industry; changes in the number of the Company's financial advisors and institutions, and their ability to market effectively financial products and services; changes in interest rates and fees payable by banks participating in the Company's cash sweep program, including the Company's success in negotiating agreements with current or additional
counterparties; the Company's success in integrating the operations of acquired businesses; execution of the Company's plans related to the Service Value Commitment, including the Company's ability to successfully
transform and transition business processes to third party service providers; the Company's success in negotiating and developing commercial arrangements with third party service providers that will enable the Company to realize the service improvements and efficiencies expected to result from the Service Value Commitment; the performance of third party service providers to which business processes are transitioned from the Company; the Company's ability to control operating risks, information technology systems risks and sourcing risks; the effect of current, pending and future legislation, regulation and regulatory actions, including disciplinary actions imposed by self-regulatory organizations; and the other factors set forth in Part I, Item 1A - “Risk Factors”. Except as required by law, the Company specifically disclaims any obligation to update any forward-looking statements as a result of developments occurring after the date of this annual report, even if its estimates change, and you should not rely on statements contained herein as representing the Company's views as of any date subsequent to the date of this annual report.
PART I Item 1. Business
General Corporate Overview
We are the nation's largest independent broker-dealer, a top custodian for registered investment advisors ("RIAs"), and a leading independent consultant to retirement plans. We provide an integrated platform of brokerage and investment advisory services to more than 13,600 independent financial advisors and financial advisors at more than 700 financial institutions (our "advisors") throughout the United States, enabling them to provide their retail investors (their "clients") with objective financial advice through a lower-risk model. We also support approximately 4,500 financial advisors who are affiliated and licensed with insurance companies through customized clearing services, advisory platforms and technology solutions.
We support a diverse client base through our subsidiary companies. LPL Financial LLC ("LPL Financial") is a clearing broker-dealer and an investment advisor that primarily transacts business as an agent for our advisors on behalf of their clients through a broad array of financial products and services. Fortigent Holdings Company, Inc. and its subsidiaries ("Fortigent") is a leading provider of solutions and consulting services to RIAs, banks and trust companies that serve worth clients. The Private Trust Company, N.A. ("PTC") manages trusts for high-net-worth clients.
While our services are diverse, our singular focus is to provide advisors with the front-, middle- and back-office support they need to serve the large and growing market for independent investment advice. We believe we are the only company that offers advisors the unique combination of an integrated technology platform,
comprehensive self-clearing services and open architecture access to leading financial products, all delivered in an environment unencumbered by conflicts from product manufacturing, underwriting or market-making.
For over 20 years we have served and supported the independent advisor market. We are a market leader with the largest independent advisor base and we believe we have the fourth largest overall advisor base in the United States. Through our advisors, we are also one of the largest distributors of financial products in the United States with over $73 billion in sales of mutual funds, annuities and advisory services. Our significant scale combined with our differentiated focus on the independent market has created a competitive advantage that enables ongoing growth through the attraction and retention of advisors. We are also able to continually reinvest in and improve resources to help our advisors manage the increasing complexity of the financial advisory and brokerage business, improve productivity and achieve their own goals for long-term growth. We currently have 3,185 employees with primary offices in Boston, Charlotte and San Diego.
Our Business
We believe that independent, objective financial guidance is a fundamental need for everyone. To fulfill that need, we enable our advisors to focus on what they do best —build personal, long-term client relationships that serve as the foundation for turning life's aspirations into financial realities. With our support, our advisors are able to provide their clients with high-quality independent financial advice and investment solutions. We help our advisors manage the complexity of their businesses by providing a comprehensive integrated technology platform,
customized custody and clearing services and an open-architecture product platform that offers financial management and investment solutions from over 790 providers. We offer no proprietary products of our own. Because we do not offer proprietary products, we enable the independent financial advisors, banks and credit unions with whom we partner to offer their clients truly objective, low-conflict advice.
Our business is dedicated exclusively to our advisors; we are not a market-maker nor do we offer investment banking or underwriting services. Additionally, we offer our advisors the highest average payout ratios among the five largest U.S. broker-dealers, as ranked by number of advisors, which we believe provides us with a significant competitive advantage.
Our flexible model attracts many different types of advisors, such as independent financial advisors, RIAs, advisors focused on serving retirement plans and advisors at small and mid-sized financial institutions.
Furthermore, we believe that we are the only independent broker-dealer with an integrated platform supporting RIAs.
Our revenues are derived primarily from commission and advisory fees generated by our advisors. We also generate asset-based revenues from our financial product sponsor relationships, cash sweep programs and omnibus processing and networking services. Under our self-clearing platform, we custody the majority of client assets invested in these products. Our custody activities include providing statements, processing transactions and
performing ongoing account management. In addition, we generate revenues from advisor- and technology-related fees.
Our Advisor Relationships
Our advisors build long-term relationships with their clients in communities across the U.S. by guiding them through the complexities of investment decisions, retirement solutions, financial planning and wealth-management. Our advisors support approximately 4.4 million client accounts. Our services support the evolution of our advisors’ businesses over time and are designed to change as our advisors' needs change.
Our relationship with our advisors is expressed in our Commitment Creed, which for more than 20 years has set forth the guiding principles that have been the foundation for our culture and reflected our singular focus on the advisors we serve. The size and growth of our business are reflective of this focus.
Advisors licensed with LPL Financial as registered representatives and as investment advisory
representatives are able to conduct both commission-based business on our brokerage platform and fee-based business on our corporate RIA platform. In order to be licensed with LPL Financial, advisors must be approved through our assessment process, which includes a thorough review of each advisor’s education, experience and credit and compliance history. Approved advisors become registered with LPL Financial and enter into a
representative agreement that establishes the duties and responsibilities of each party. Pursuant to the
representative agreement, each advisor makes a series of representations, including that the advisor will disclose to all clients and prospective clients that the advisor is acting as LPL Financial's registered representative or
investment advisory representative, that all orders for securities will be placed through LPL Financial, that the advisor will sell only products LPL Financial has approved and that the advisor will comply with LPL Financial policies and procedures as well as securities rules and regulations. These advisors also agree not to engage in any outside business activity without prior approval from us and not to act as an agent for any of our competitors.
In return for the services we provide to advisors, including, among others, transaction processing and technology services to support their daily activities, we typically retain a range of 10 to 15 percent of the
commission and advisory revenue generated by our advisors and pay out the remaining 85 to 90 percent directly to them. Advisors are also entitled to receive annual production bonuses, based on their individual and branch
production. In addition, advisors pay certain fees directly to us relating to technology and platform access, insurance coverage and licensing fees, as well as administrative fees. The registered representative agreement, which covers such fees, is terminable by us or the advisor without cause on 30 days' notice and by us for cause immediately upon notice.
LPL Financial also supports over 280 stand-alone RIA practices ("Independent RIAs") with over 2,000 advisors who conduct their advisory business through separate entities by establishing their own RIAs, rather than using our corporate RIA. These Independent RIAs engage us for technology, clearing, compliance related and custody services, as well as access to certain of our investment platforms. These advisors retain 100% of their advisory fees. In return, we charge separate fees for custody, trading and support services to the Independent RIAs. In addition, Independent RIAs seeking to operate a hybrid model carry their brokerage license exclusively with LPL Financial and access our fully-integrated brokerage platform under standard terms.
Our advisors average over 15 years of industry experience. This level of industry experience allows us to focus on supporting and enhancing our advisors’ businesses without needing to provide basic training or subsidizing advisors who are new to the industry. Our independent advisors join us from a broad range of firms including wirehouses, regional and insurance broker-dealers, banks and other independent firms. Our flexible business platform allows our advisors to choose the most appropriate business model to support their clients, whether they conduct brokerage business, offer brokerage and fee-based services on our corporate RIA platforms or provide fee-based services through their own RIAs.
The majority of our advisors are entrepreneurial independent contractors who deliver their services through over 4,000 branch offices. They are primarily located in rural and suburban areas and as such are viewed as local providers of independent advice. Approximately 77% of these advisors operate under their own business name. We assist these advisors with their own branding, marketing and promotion, and regulatory review.
We believe we are the market leader in providing support to over 2,200 financial advisors at approximately 700 banks and credit unions nationwide. For these institutions, whose core capabilities may not include investment and financial planning services, or who find the technology, infrastructure and regulatory requirements to be cost prohibitive, we provide their financial advisors with the services they need to be successful, allowing the institutions to focus more energy and capital on their core businesses. In addition, we have expanded our technology and
wealth management solutions to support trust departments at such institutions, which enables them to more efficiently manage their assets.
A subset of our advisors provides advice and serves group retirement plans primarily for small and mid-size businesses. These approximately 1,500 advisors serve over 20,800 retirement plans representing $60.6 billion in retirement plan assets custodied at various custodians. LPL Financial provides these advisors with marketing tools and technology capabilities, which are designed for retirement solutions.
We also provide support to approximately 4,500 additional financial advisors who are affiliated and licensed with insurance companies. These arrangements allow us to provide outsourced customized clearing, advisory platforms and technology solutions that enable the financial advisors at these insurance companies to offer a breadth of services to their client base in an efficient manner.
Through our subsidiary Fortigent, we provide unique solutions and consulting services aimed to assist RIAs, banks and trust companies serving high-net-worth clients by providing them with sophisticated investment advice and helping them build their wealth management practices.
Our Value Proposition
The core of our business is dedicated to meeting the evolving needs of our advisors and providing the platform and tools to grow and enhance the profitability of their businesses. Our Service Value Commitment
expresses our dedication to continuous improvement in the processes, systems and resources we leverage to meet these needs. In February 2013, we announced the next phase of evolution of our Service Value Commitment, which is designed to create a better service experience for our advisors, evolve our operating model to simplify processes and enhance our ability to invest in areas that are differentiators for our business by lowering our costs in areas where work can be performed more effectively by outsourcing partners specializing in this work.
We support our advisors by providing front-, middle- and back-office solutions through the four pillars of our distinct value proposition: integrated technology solutions, comprehensive clearing and compliance services, practice management programs and training and independent research. The comprehensive and automated nature of our offering enables our advisors to focus on their clients while successfully and efficiently managing the
complexities of running their own practice.
Integrated Technology Solutions
We provide our technology and service to advisors through BranchNet, our proprietary, integrated technology platform that is server-based and web-accessible. Using the BranchNet workstation as their core technology platform, our advisors can effectively manage all critical aspects of their businesses while remaining highly efficient and responsive to their clients’ needs. Time-consuming processes, such as account opening and management, document imaging, transaction execution, and account rebalancing, are automated to improve efficiency and accuracy. We believe BranchNet allows our advisors to transact and monitor their business more efficiently, lowering operating costs for their business.
Through BranchNet, our advisors have direct access to a fully integrated array of tools and support systems, including:
• comprehensive account lookup for accounts;
• straight-through processing of trade orders and account maintenance requests; and • secure and reliable data maintenance.
In addition to the account management capabilities of BranchNet, our Resource Center, which is embedded within BranchNet, provides advisors with access to our research, training, compliance and support services, as well as the ability to review products and develop marketing materials, including:
• direct access to financial product information and exclusive research commentaries; detailed regulatory requirements; valuable marketing tools; operational information; comprehensive training and technical support;
• client management and business development tools; • trading and research tools; and
• business management resources.
Many advisors also subscribe to premium features, such as performance reporting, financial planning and customized websites. Select third-party resources have been integrated into our technology software, which
enables seamless access to important tools, broadens our range of offerings and reduces duplicate operational functions. Once on BranchNet, advisors have the ability to choose which services suit their business plan, purchasing only the services that they believe are needed to grow their business.
Comprehensive Clearing and Compliance Services
We custody and clear the majority of our advisors’ transactions, providing a simplified and streamlined advisor experience and expedited processing capabilities. Our self-clearing platform enables us to better control client data, more efficiently process and report trades, facilitate platform development, reduce costs and ultimately enhance the service experience for our advisors and their clients. Our self-clearing platform also enables us to serve a wider range of advisors, including Independent RIAs.
Because we are self-clearing, we can address all facets of securities transaction processing, including: • order routing, trading support, execution and clearing, and position keeping;
• regulatory and tax compliance and reporting; and • investment accounting and recordkeeping.
All of these services are backed by our service center and operations organizations focused on providing timely, accurate and consistent support. Our employees share a passion for maximizing our advisors’ ease of doing business and thereby enhancing their ability to serve their clients. Each employee is highly committed to delivering a level of service unmatched in our competitive space.
Service360, a service paradigm available to the majority of our advisors and Independent RIAs, offers a small team-based approach. This service model emphasizes personal accountability and empowerment within each Service360 team. Service360 currently serves over 9,700 advisors.
We continue to make substantial investments in our compliance function to provide our advisors with a strong framework through which to understand and operate within regulatory guidelines as well as guidelines established by our firm. These investments include hiring and retaining experienced compliance and risk professionals and technology-related expenditures. Our compliance and risk management tools are integrated into our technology platform to further enhance the overall effectiveness and scalability of our control environment. All of this enables us to maintain our long term track-record of strong regulatory compliance, as evidenced by the number of regulatory events reported in Financial Industry Regulatory Authority, Inc.'s (“FINRA”) BrokerCheck Reports.
Our team of approximately 370 risk and compliance employees assist our advisors through:
• training and advising advisors on new products, new regulatory guidelines, compliance and risk management tools, security policies and procedures, anti-money laundering and best practices;
• supervising sales practice activities and facilitating the oversight activities for branch managers; • conducting technology-enabled surveillance of trading activities and sales practices;
• overseeing and monitoring of registered investment advisory activities;
• inspecting branch offices and advising on how to strengthen compliance procedures; and • continuing to invest in technology assisted supervisory tools.
Practice Management Programs and Training
Our practice management programs are designed to help financial advisors in independent practices and financial institutions, as well as all levels of financial institution leadership, enhance and grow their businesses. Our experience gives us the ability to benchmark the best practices of successful advisors and develop customized recommendations to meet the specific needs of an advisor’s business and market. Because of our scale, we are able to dedicate an experienced group of approximately 190 practice management professionals who counsel our advisors to build and better manage their business and client relationships through one-on-one support as well as group training. In addition, we hold over 110 conferences and group training events around the country annually for the benefit of our advisors. Our practice management and training services include:
• personalized business consulting that helps advisors and program leadership enhance the value and operational efficiency of their businesses;
• advisory and brokerage consulting and financial planning to support advisors in growing their businesses with our broad range of products and fee-based offerings, as well as wealth management services to assist advisors serving high-net-worth clients with comprehensive estate, tax, philanthropic, and financial planning processes;
• marketing strategies, including campaign templates, to enable advisors to build awareness of their services and capitalize on opportunities in their local markets;
• succession planning and an advisor loan program for advisors looking to either sell their own or buy another practice;
• transition services to help advisors establish independent practices and migrate client accounts to us; and • training and educational programs on topics including technology, use of advisory platforms and business
development.
Independent Research
We provide our advisors with integrated access to comprehensive research on a broad range of investments and market analysis, including on mutual funds, separate accounts, alternative investments and annuities, asset allocation strategies, financial markets and the economy. We take our research and create packaged, discretionary portfolios, for which we serve as a portfolio manager, that are available through the LPL Financial turnkey advisory asset management platforms. Our research team consists of approximately 35 professionals with an average of 11 years of industry experience providing unbiased and low-conflict advice. Our research operation is designed to empower our advisors to provide their clients with thoughtful advice in a timely manner. Our research team actively works with our product due diligence group to effectively scrutinize the financial products offered through our platform. Our lack of proprietary products or investment banking services helps ensure that our research remains unbiased and objective. A substantial portion of our research is approved by our Marketing Regulatory Review organization for use with clients, allowing our advisors to leverage these materials to help clients understand complex investment topics and make informed decisions.
Our research enables advisors to:
• keep abreast of changes in markets, investments and the global economy, through our daily market update call and email, published materials, social media content and media presence;
• proactively respond to emerging trends;
• leverage the expertise and experience of our research team in building individual investment portfolios; and • seek specific advice through our ASK (accurate, swift and knowledgeable) Research Team, a group of
research professionals dedicated exclusively to advisor investment-research inquiries via phone and email. With a focus on performance, service and transparency, our research team utilizes a wide spectrum of available tools to deliver timely perspectives on the ever-changing economic marketplace and products, enabling advisors to help their clients understand and adjust to the latest developments. Through its objective
recommendations and portfolio management, the research group helps advisors meet a broad range of investor needs effectively, which in turn allows advisors to focus on their clients and growing their practice.
We also offer independent investment research through our wholly-owned subsidiary, Fortigent. Fortigent's research team consists of approximately 12 dedicated professionals who provide objective advice and guidance on macro-economic analysis, capital markets assumptions, and strategic and tactical asset allocation. Fortigent also provides robust third-party asset manager search, selection and monitoring services for both traditional and alternative strategies across all investment access points (ETFs, mutual funds, separately managed accounts, unified managed accounts and limited partnerships). Fortigent's targeted client base consists of independent advisors (RIAs), banks and trust companies that target primarily taxable high-net-worth investors and families. In addition, Fortigent also provides model management services for both traditional and alternative investment portfolios.
Our Economic Value Proposition
We offer a compelling economic value proposition to independent advisors that is a key factor in our ability to attract and retain advisors and their practices. The independent channels pay advisors a greater share of brokerage commissions and advisory fees than the captive channels — generally 80-90% compared to 30-50%. Through our scale and operating efficiencies, we are able to offer our advisors what we believe to be the highest average payout ratios among the five largest U.S. broker-dealers, ranked by number of advisors, providing us with a significant competitive advantage.
Furthermore, we believe our superior technology and service platforms enable our advisors to operate their practices with a greater focus on generating revenue opportunities and at a lower cost than other independent advisors. As a result, we believe our practice owners earn meaningfully more pre-tax profit than practice owners affiliated with other independent brokerage firms. We attribute this difference in profitability in part to lower fixed costs driven by the need for fewer support staff at our associated practices. Finally, as business owners, our independent financial advisors, unlike captive advisors, also have the opportunity to build equity in their own businesses.
Our Product and Solution Access
We do not manufacture any financial products. Instead, we provide our advisors open architecture access to a broad range of commission, fee-based, cash and money market products and services. Our product due diligence group conducts extensive diligence on substantially all of our product offerings, including annuities, mutual funds, exchange-traded funds, and alternative investments, including real estate investment trusts. Our platform provides access to over 11,000 financial products, manufactured by over 790 product sponsors. Typically, we enter into arrangements with these product sponsors pursuant to the sponsor’s standard distribution agreement.
The sales and administration of these products are facilitated through BranchNet and our Resource Center, which together allow our advisors to access client accounts, product information, asset allocation models,
investment recommendations, and economic insight as well as to perform trade execution.
The following table presents a breakdown of the assets of advisors to whom we provide advisory and brokerage services as of December 31, 2013 (dollars in billions):
Advisory Brokerage Total Assets
Independent advisors' assets custodied by LPL Financial $ 117.6 $ 257.9 $ 375.5 Independent RIAs' assets custodied by LPL Financial 34.0 28.9 62.9 Total advisors' assets custodied by LPL Financial $ 151.6 $ 286.8 $ 438.4
Advisors with Independent RIA firms have the ability to conduct investment advisory business using our platform and tools, and carry a brokerage license with LPL Financial to support brokerage accounts as well.
Of the $151.6 billion of advisory assets under custody, $113.6 billion are mutual funds. Brokerage sales of financial products were over $29 billion, including over $11 billion in mutual funds and $18 billion in annuities. This sales volume is illustrative of our scale and significant distribution capabilities, as we can offer leading products and services with attractive economics to our advisors.
Commission-Based Products
Commission-based products are those for which we and our advisors receive an upfront commission and, for certain products, a trailing commission. Our brokerage offerings include variable and fixed annuities, mutual funds, equities, alternative investments such as non-traded real estate investment trusts and business development companies, retirement and 529 education savings plans, fixed income and insurance. Our insurance offering is provided through LPL Insurance Associates, Inc. (“LPLIA”), a brokerage general agency which provides
personalized advance case design, point-of-sale service and product support for a broad range of life, disability and long-term care products. As of December 31, 2013, the total assets in our commission-based products were $286.8 billion.
Fee-Based Advisory Platforms and Support
We have been an innovator in fee-based advisory solutions since the introduction of our Strategic Asset Management platform in 1991. Today, LPL Financial has five fee-based advisory platforms that provide centrally managed or customized solutions from which advisors can choose to meet the investment needs of their mass affluent and high-net-worth clients. The fee structure aligns the interests of our advisors with their clients, while establishing a recurring revenue stream for the advisor and for us. Our fee-based platforms provide access to no-load/load-waived mutual funds, exchange-traded funds, stocks, bonds, conservative option strategies, unit investment trusts and institutional money managers and no-load multi-manager variable annuities. As of December 31, 2013, the total assets under custody in these platforms were $151.6 billion.
Cash Sweep Programs
We assist our advisors in managing their clients’ cash balances through two primary cash sweep programs depending on account type: a money market sweep vehicle involving money market fund providers and an insured bank deposit sweep vehicle. Our insured bank deposit sweep vehicle allocates client cash balances across multiple non-affiliated banks to provide advisors with up to $1.5 million ($3.0 million joint) of insurance through the Federal Deposit Insurance Corporation (“FDIC”). As of December 31, 2013, the total assets in our cash sweep programs, which are held within brokerage and advisory accounts, were approximately $24.9 billion, with $7.5 billion held in a money market sweep vehicle and $17.4 billion in an insured bank deposit sweep vehicle.
Retirement Services
We offer a retirement solution that is fee-based and which allows qualified advisors to provide consultation and advice to plan sponsors using our corporate RIA. We also offer a retirement solution that provides for commission-based services. Both solutions deliver a comprehensive suite of products and services, which we believe have been instrumental in gaining new and larger retirement plan business. In 2013, we launched our Worksite Financial Solutions platform, which furnishes our advisors with the ability to serve Individual Retirement Account ("IRA") rollovers in an efficient and compliant manner. Our advisors, whether through our corporate RIA or through their own independent RIA, serve over 20,800 retirement plans representing $60.6 billion in retirement plan assets, which are custodied with various custodians. These retirement plan assets are custodied with 30 third-party providers of retirement plan administrative services who provide us with reporting feeds. There are additional retirement plan assets supported by our advisors, custodied with third party providers who do not provide reporting feeds to us, and we estimate the total assets in retirement plans (including such additional assets) served by our advisors to be between $95.0 billion and $105.0 billion. The retirement assets are not included in our reported brokerage and advisory assets.
Other Services
We provide a number of tools and services that enable advisors to maintain and grow their practices. Through our subsidiary, PTC, we provide administrative and custodial services to trusts for estates and families. Under our unique model, an advisor may provide the trust with investment management services. Administrative services for the trust are provided by PTC. We also provide open architecture investment management solutions to trust departments of financial institutions through LPL Financial's Concord Trust and Wealth Solutions division ("Concord"). At December 31, 2013, Concord supported $10.6 billion in trust assets for 29 institutions.
In addition, we are a leading provider of solutions and consulting services to registered investment advisors, banks and trust companies that serve high-net-worth clients through Fortigent. At December 31, 2013, $73.9 billion of assets were supported by Fortigent. The assets supported by Concord and Fortigent are not custodied by LPL Financial and are therefore not included in our reported brokerage and advisory assets.
Our Financial Model
Our financial model has inherent resilience, and our overall financial performance is a function of the following dynamics of our business:
• Our revenues stem from diverse sources, including advisor-generated commission and advisory fees as well as fees from product manufacturers, omnibus and networking services, cash sweep balances and other ancillary services. Revenues are not concentrated by advisor, product or geography. For the year ended December 31, 2013, no single relationship with our independent advisor practices, banks, credit unions, or insurance companies accounted for more than 3% of our net revenues, and no single advisor accounted for more than 1% of our net revenues.
• The majority of our revenue base is recurring in nature, with approximately 65% recurring revenue in 2013.
(1) Transaction and fee revenues include individual advisor and account fees.
• The largest variable component of our cost base is directly linked to revenues generated by our advisors. Furthermore, the payout percentages are tied to advisor productivity levels.
• We actively manage our expense base in order to achieve efficient, scalable and sustainable growth.
• A proportion of our revenues, such as software licensing and account and client fees, are not correlated with the equity financial markets.
• Our operating model is scalable and can deliver expanding profit margins over time.
• We are able to operate with low capital expenditures and limited capital requirements, and as a result generate substantial free cash flow, which we have committed to investing in our business as well as returning value to shareholders. During 2013, we used cash flows to fund $219.1 million of share repurchases and to pay $68.0 million in quarterly dividends.
• We continue to invest in our business during difficult market conditions to position us for long-term growth.
Our Competitive Strengths
• Market Leadership Position and Significant Scale. We are the established leader in the independent advisor market, which is our core business focus. Our scale enables us to benefit from the following dynamics:
• Continual Reinvestment. We actively reinvest in our comprehensive technology platform and practice management support, which further improves the productivity of our advisors.
• Pricing Power. As one of the largest distributors of financial products in the United States, we are able to obtain attractive economics from product manufacturers.
• Payout Ratios to Advisors. Among the five largest U.S. broker-dealers by number of advisors, we offer the highest average payout ratios to our advisors.
The combination of our ability to reinvest in our business and maintain highly competitive payout ratios has enabled us to attract and retain advisors. This, in turn, has driven our growth and led to a continuous cycle of reinvestment that reinforces our established scale advantage.
• Unique Value Proposition:
Independent Advisors. We deliver a comprehensive and integrated suite of products and services to support the practices of our independent advisors. We believe we are the only institution that offers a low-conflict, open architecture and scalable platform. The benefits of our purchasing power lead to high average payouts and greater economics to our advisors. Our platform also creates an entrepreneurial opportunity that empowers independent advisors to build equity in their businesses. This generates a significant opportunity to attract and retain highly qualified advisors who are seeking independence.
Institutions. We provide solutions to financial institutions, such as regional banks, credit unions and insurers, who seek to provide a broad array of services for their clients. We believe many institutions find the technology, infrastructure and regulatory requirements associated with delivering financial advice to be cost-prohibitive. We provide comprehensive solutions that enable financial advisors at these
institutions to offer financial advice.
• Flexibility of Our Business Model. Our business model allows our advisors the freedom to choose how they conduct their business, which helps us attract and retain advisors from multiple channels, including wirehouses, regional broker-dealers and other independent broker-dealers. Our accommodating platform serves a variety of independent advisor models, including independent financial advisors, RIAs and Independent RIAs. The flexibility of our business model makes it easy for our advisors to transition among independent advisor models and product mix as their business evolves and preferences change within the market. Our business model provides advisors with a multitude of customizable service and technology offerings, which allows them to increase their efficiency, focus on their clients and grow their practice. • Ability to Serve over 90% of Retail Assets. Our historic focus has been on advisors who serve the
mass-affluent market (investors with $100,000 or greater in investable assets). We have designed and integrated all aspects of our platforms and services to profitably meet the needs of these advisors. We believe there continues to be an attractive opportunity in the mass-affluent market, in part because wirehouses have not typically focused on this space. Although we have grown through our focus in this area, the flexibility of our platform, along with our acquisition of Fortigent, allow us to expand our breadth of services to better support the high-net-worth market. As of December 31, 2013, our advisors supported accounts with more than $1million in assets that in the aggregate represented $80.2billion in advisory and brokerage assets, 18.3% of our total assets custodied. Although our advisors' average production is typically below that of some of the wirehouse channel firms, our array of integrated technology and services can support advisors with
significant production and can compete directly with wirehouses and custodians. Based on Cerulli Associates' wealth tiers, our growth and expansion now allows us to serve each tier between the mass market and high-net-worth market, accounting for approximately 91% of retail assets.
• Experienced and Committed Senior Management Team. We have an experienced and committed senior management team that provides stable leadership and strategic vision for our business. On average, our senior management has 21 years of industry experience. The team has a proven track record of success as demonstrated in the Company’s financial performance through the recent market downturn. Having played a significant role in the building out of the business, senior management also has a fundamental and thorough understanding of the operations. The management team is aligned with stockholders and holds significant equity ownership in the Company; certain of our senior executives are subject to mandatory stock ownership guidelines.
Our Sources of Growth
We expect to increase our revenue and profitability by benefiting from favorable industry trends and by executing strategies to accelerate our growth beyond that of the broader markets in which we operate.
Favorable Industry Trends
• Growth in Investable Assets. According to Cerulli Associates, over the past five years, assets under management for the market segments in the United States that we address grew 3.0% per year, while retirement assets are expected to grow 6.3% per year over the next five years (in part due to the retirement of the baby boomer generation and the resulting assets that are projected to flow out of retirement plans and into individual retirement accounts). In addition, IRA assets are projected to grow from $5.9 trillion as of 2013 to $8.2 trillion by 2017. In addition to the retirement of the baby boomer generation, there is a general need in the United States for greater and smarter retirement savings as well as increased regulatory pressures on 401(k) plan sponsors.
(1) Cerulli Quantitative Update - The State of U.S. Retail and Institutional Asset Management, November 2013. (2) Cerulli Quantitative Update - Retirement Markets, November 2013.
• Increasing Demand for Independent Financial Advice. Retail investors, particularly in the mass-affluent market, are increasingly seeking financial advice from independent sources. We are highly focused on helping independent advisors meet the needs of the mass-affluent market, which constitutes a significant and underserved portion of investable assets, according to Cerulli Associates, and we believe presents significant opportunity for growth.
• Advisor Migration to Independence. Independent channels are gaining market share from captive channels. We believe that we are not just a beneficiary of this secular shift, but an active catalyst in the movement to independence. There is an increased shift towards advisors seeking complete independence by forming an RIA and registering directly with the SEC. However, these advisors are generally interested in retaining assets in brokerage accounts. This shift is leading to significant growth in Independent RIA
advisors.
• Macroeconomic Trends. While the current macroeconomic environment has exhibited volatility recently, we anticipate an appreciation in asset prices and a rise in interest rates over the long term. We expect that our business will benefit from growth in advisory and brokerage assets as well as increasing interest rates.
Executing Our Growth Strategies
• Attracting New Advisors to Our Platform. We intend to grow the number of advisors — either those who are independent or who are aligned with financial institutions — who are served by our platform. We have a 4.3% market share of the approximately 310,000 financial advisors in the United States, according to Cerulli Associates, and we have the ability to attract seasoned advisors of any practice size and from any channel, including wirehouses, regional broker-dealers and other independent broker-dealers.
Channel Advisors Market Share
Independent Broker-Dealer(1) 78,886 25.6% Insurance Broker-Dealer 88,115 28.7% Wirehouse 49,913 16.2% Regional Broker-Dealer 30,628 10.0% RIA(1) 27,839 9.0% Bank Broker-Dealer 13,728 4.5%
Dually registered RIAs(1) 18,513 6.0%
Total 307,622 100%
___________________
(1) The 18,513 advisors classified as dually registered RIAs are advisors who are both licensed through independent broker-dealers and registered as investment advisors. Including the 18,513 dually registered advisors, advisors in the Independent Broker-Dealer channel represent 31.6% of the advisor population. Including the 18,513 dually registered advisors, advisors in the RIA channel represent 15.0% of the advisor population.
• Increasing Productivity of Existing Advisor Base. The productivity of advisors increases over time as we enable them to add new clients, gain shares of their clients’ investable assets, and expand their existing practices with additional advisors. We facilitate these productivity improvements by helping our advisors better manage their practices in an increasingly complex external environment, which results in assets per advisor improving over time.
• Ramp-up of Newly-Attracted Advisors. We primarily attract experienced advisors who have established practices. In our experience, it takes an average of four years for newly recruited advisors to fully re-establish their practices and associated revenues. This seasoning process creates accelerated growth of revenue from new advisors.
• Our Business Model has Inherent Economies of Scale. The largely fixed costs necessary to support our advisors delivers higher marginal profitability as client assets and revenue grow. Historically, this dynamic has been demonstrated through the growth in our operating margins. Our 2013 announcement about evolving our Service Value Commitment is reflective of our dedication to continuously transforming our business by enhancing the quality and speed of our operational processing while improving our cost structure by lowering costs in areas that are not differentiators for our business.